BreastScreening: On the Use of Multi-Modality in Medical Imaging Diagnosis
Abstract.
This paper describes the field research, design and comparative deployment of a multimodal medical imaging user interface for breast screening. The main contributions described here are threefold: 1) The design of an advanced visual interface for multimodal diagnosis of breast cancer (BreastScreening); 2) Insights from the field comparison of Single-Modality vs Multi-Modality screening of breast cancer diagnosis with 31 clinicians and 566 images; and 3) The visualization of the two main types of breast lesions in the following image modalities: (i) MammoGraphy (MG) in both Craniocaudal (CC) and Mediolateral oblique (MLO) views; (ii) UltraSound (US); and (iii) Magnetic Resonance Imaging (MRI). We summarize our work with recommendations from the radiologists for guiding the future design of medical imaging interfaces.
1. Introduction
Breast cancer is the most common cancer in women worldwide (Henriksen et al., 2018). Screening plays a fundamental role in the reduction of patient mortality rate. The most widely employed image modality for breast screening is MammoGraphy (MG). However, high-risk or dense breast patients require UltraSound (US) or Magnetic Resonance Imaging111This is the common/current practice in the radiologist services applied in the Hospital Fernando Fonseca (HFF), Portugal. (MRI) for proper examination (Maicas et al., 2019). Therefore, it is quite rare to conduct screening using a Single-Modality.
In this paper, we describe the design and comparative testing of BreastScreening integrating information from several and different image modalities. We tested the design of BreastScreening with 31 clinicians noting that the time spent per each image on a Multi-Modality strategy is reduced when compared with the Single-Modality scenario. In addition, the lesion classification (e.g., Breast Imaging Reporting and Data System - BIRADS (Spak et al., 2017)) is also reduced from our Multi-Modality proposed approach.
1.1. BreastScreening Challenges
Overall the system involves the following functionalities: (1) an interface for identifying (and annotating ground truth) of two types of lesions (i.e., masses and calcifications) across image modalities; (2) support for categorization of the breast tissues (dense vs non-dense); (3) a classification (and recommendation) schema for lesion severity using BIRADS (Aghaei et al., 2018; Spak et al., 2017); (4) prompt access to clinical co-variables, such as personal and familiar records; and (5) proper visualizations for a follow-up diagnosis of the patients.
1.2. Design Process
The following topics summarize the process we conducted: (1) findings from a formative study with 31 clinicians, comprising Radiology Room (RR) observations and interviews, which are relevant for both Health Informatics (HI) and Human-Computer Interaction (HCI) fields of research. This leads us to explore the design goals (see Section 3); (2) findings from an evaluation study (Calisto, 2019) of BreastScreening, a prototype we developed for the generation of a breast dataset with expert annotations (see Section 4); and (3) design recommendations for the use of visualizations to support medical imaging diagnosis (see Sections 4 and 5).
1.3. Contributions
In BreastScreening we provide several new insights, following novel interaction and visualization paradigms (Paulo et al., 2019) in the context of breast cancer screening: multimodal interaction; indistinct visualization of cluttered lesions; big data management platform; and clinicians’ multi-screen, multi-environment interaction.
2. Related Work
This section addresses related work in the HCI field, describing several medical imaging applications. Our approach covers the limitations of the works following described. More specifically, we are able to deal with non-homogeneous data. Comprising multimodal images (Zhang et al., 2018), classification (i.e., BIRADS scores) and annotations (i.e., delineation of the lesion contours).
2.1. Data Visualization
To our knowledge, few papers (Porta, 2006; Koutsabasis and Domouzis, 2016; Lee et al., 2018) have focused purely on supporting the image search user experience through novel UIs. These authors described several techniques for presenting all images within a collection in a short time. Moreover, authors asked users to think and perform browsing an image gallery and selecting an image from the gallery. These studies, showed us refinement techniques as complements in image systems with relevant user feedback. However, the presented works are limited to non-clinical users, making it impossible to do a generalization to our research.
2.2. Clinical Workflow
In medical imaging, diagnostic tools enable clinicians to manage patient data, better attend to ongoing tasks and view critical information. For the diagnostic, understanding the clinical workflow is of chief importance while introducing novel tools and interaction techniques. Other authors (Srinivas, 2015; Gonzales et al., 2015) present many considerations for collaborative healthcare technology design and discuss the implications of their findings on the current clinical workflow for the development of more effective care interventions. Supported by the above literature, our goal is to introduce a new tool with several novel interaction techniques, which will improve the final medical imaging diagnosis.
2.3. Medical Imaging
From current medical imaging technologies, several issues were identified in the HCI design (Calisto et al., 2017; Calisto, 2017; Igarashi et al., 2016). Some works (Balducci and Buono, 2018; Rosado et al., 2015) show the current medical imaging identification techniques for other clinical domains, where most of available systems fail to address the visual nature of the task. In these two works (Balducci and Buono, 2018; Rosado et al., 2015), the authors create a visual approach to support the Mental Model development of the user. Medical imaging technologies are used to support physicians on the examination, diagnosis, and (in some cases) report (Woundefinedniak et al., 2014). Others (Gallo et al., 2008; van Schooten et al., 2010; Sousa et al., 2017), study the effectiveness and performance of medical imaging systems, demonstrating how to design a user study for medical imaging experts. Further, van Schooten et al. (van Schooten et al., 2010) measured user performance in terms of time taken and error rate, while interacting with the provided system. Executing it with several medical users, in this work, the authors show an experiment where their users have similar characteristics as ours.
2.4. Diagnostic Systems
Medical imaging has also been extensively studied under the topic of Computer-Aided Diagnosis (CADx), which refers to systems that assist radiologists in image interpretation (Oram et al., 2014; Cai et al., 2019). Wilcox et al. (Wilcox et al., 2010) propose a design for in-room, patient-centric information displays, based on iterative design with clinicians. However, these systems are not contemplating the design of an advanced visual interface for multimodal diagnosis on breast cancer disease. In the above works, we still lack on empirical studies regarding how clinicians can contribute with information contextualization about their clinical workflow, and general medical imaging diagnosis. Having said that, we also want to add contribution with a study of how medical imaging technologies can play a role in this contextualization.
3. Design of BreastScreening
The design of BreastScreening started with a qualitative study to understand radiology practices and workflow in the context of breast screening. Our study involved 31 clinicians, recruited on a volunteer basis from a large range of clinical scenarios (distinct health institutions in Portugal): 8 clinicians from Hospital Fernando Fonseca; 12 clinicians from IPO-Lisboa; 1 clinician from Hospital de Santa Maria; 8 clinicians from IPO-Coimbra; 1 clinician from Madeira Medical Center; and 1 clinician from SAMS. Clinicians’ experience ranged from 5 - 30 years of medical practice. The recruited specialists are in advanced career positions and were observed and interviewed in a semi-structured fashion. Each session took approximately 30 minutes.
3.1. Standard Clinical Environments
BreastScreening works with the standard formats supported by medical imaging (Ng et al., 2017), including the MG, US and MRI modalities. These modalities are available in a standard Digital Imaging and Communications in Medicine (DICOM) format and supported in Single-Modality by existing systems (Henriksen et al., 2018). Moreover, most systems are general purpose and do not adapt to specific clinical domains (e.g., breast screening). Therefore they do not provide adequate support to the different clinical workflows (Calisto et al., 2017).
3.2. Design Goals
Combining the clinical context and the technical design challenges lead to a set of design issues, including: medical imaging structure trade-offs, RR temporal awareness, image segmentation (Nascimento and Carneiro, 2019), and radiologists system trust. Based on these, we define five design goals:
- Design around and for Medical Imaging (DMI)::
-
by taking into account the heterogeneous nature of medical imaging to leverage its contextual richness;
- Temporal Awareness Support (TAS)::
-
by observing how the radiology workflow events, treatments, and problems progressed over time;
- Image Segmentation Support (ISS)::
-
the overview of image details allowing a more accurate diagnostic. Namely, reducing the number of false-positives classification (BIRADS) of the lesion, as well as improving the number of clicks (Section 5) when performing the lesion delineation, i.e., segmentation;
- Several Modalities Support (SMS)::
-
to enable the view and the process of diagnostic imaging studies, including MG, US and MRI medical imaging modalities;
- Growing Trust Overview (GTO)::
-
by allowing an efficient triangulation via visualizations, image processing between medical images and available features, i.e., annotations of masses and calcifications;
4. BreastScreening
To validate the proposed design goals, we created BreastScreening, as a Medical Imaging visualization proof-of-concept to be evaluated in a realistic clinical scenario. In our design explorations, we sought to integrate several image modalities and visualization to support insight.
4.1. User Interface
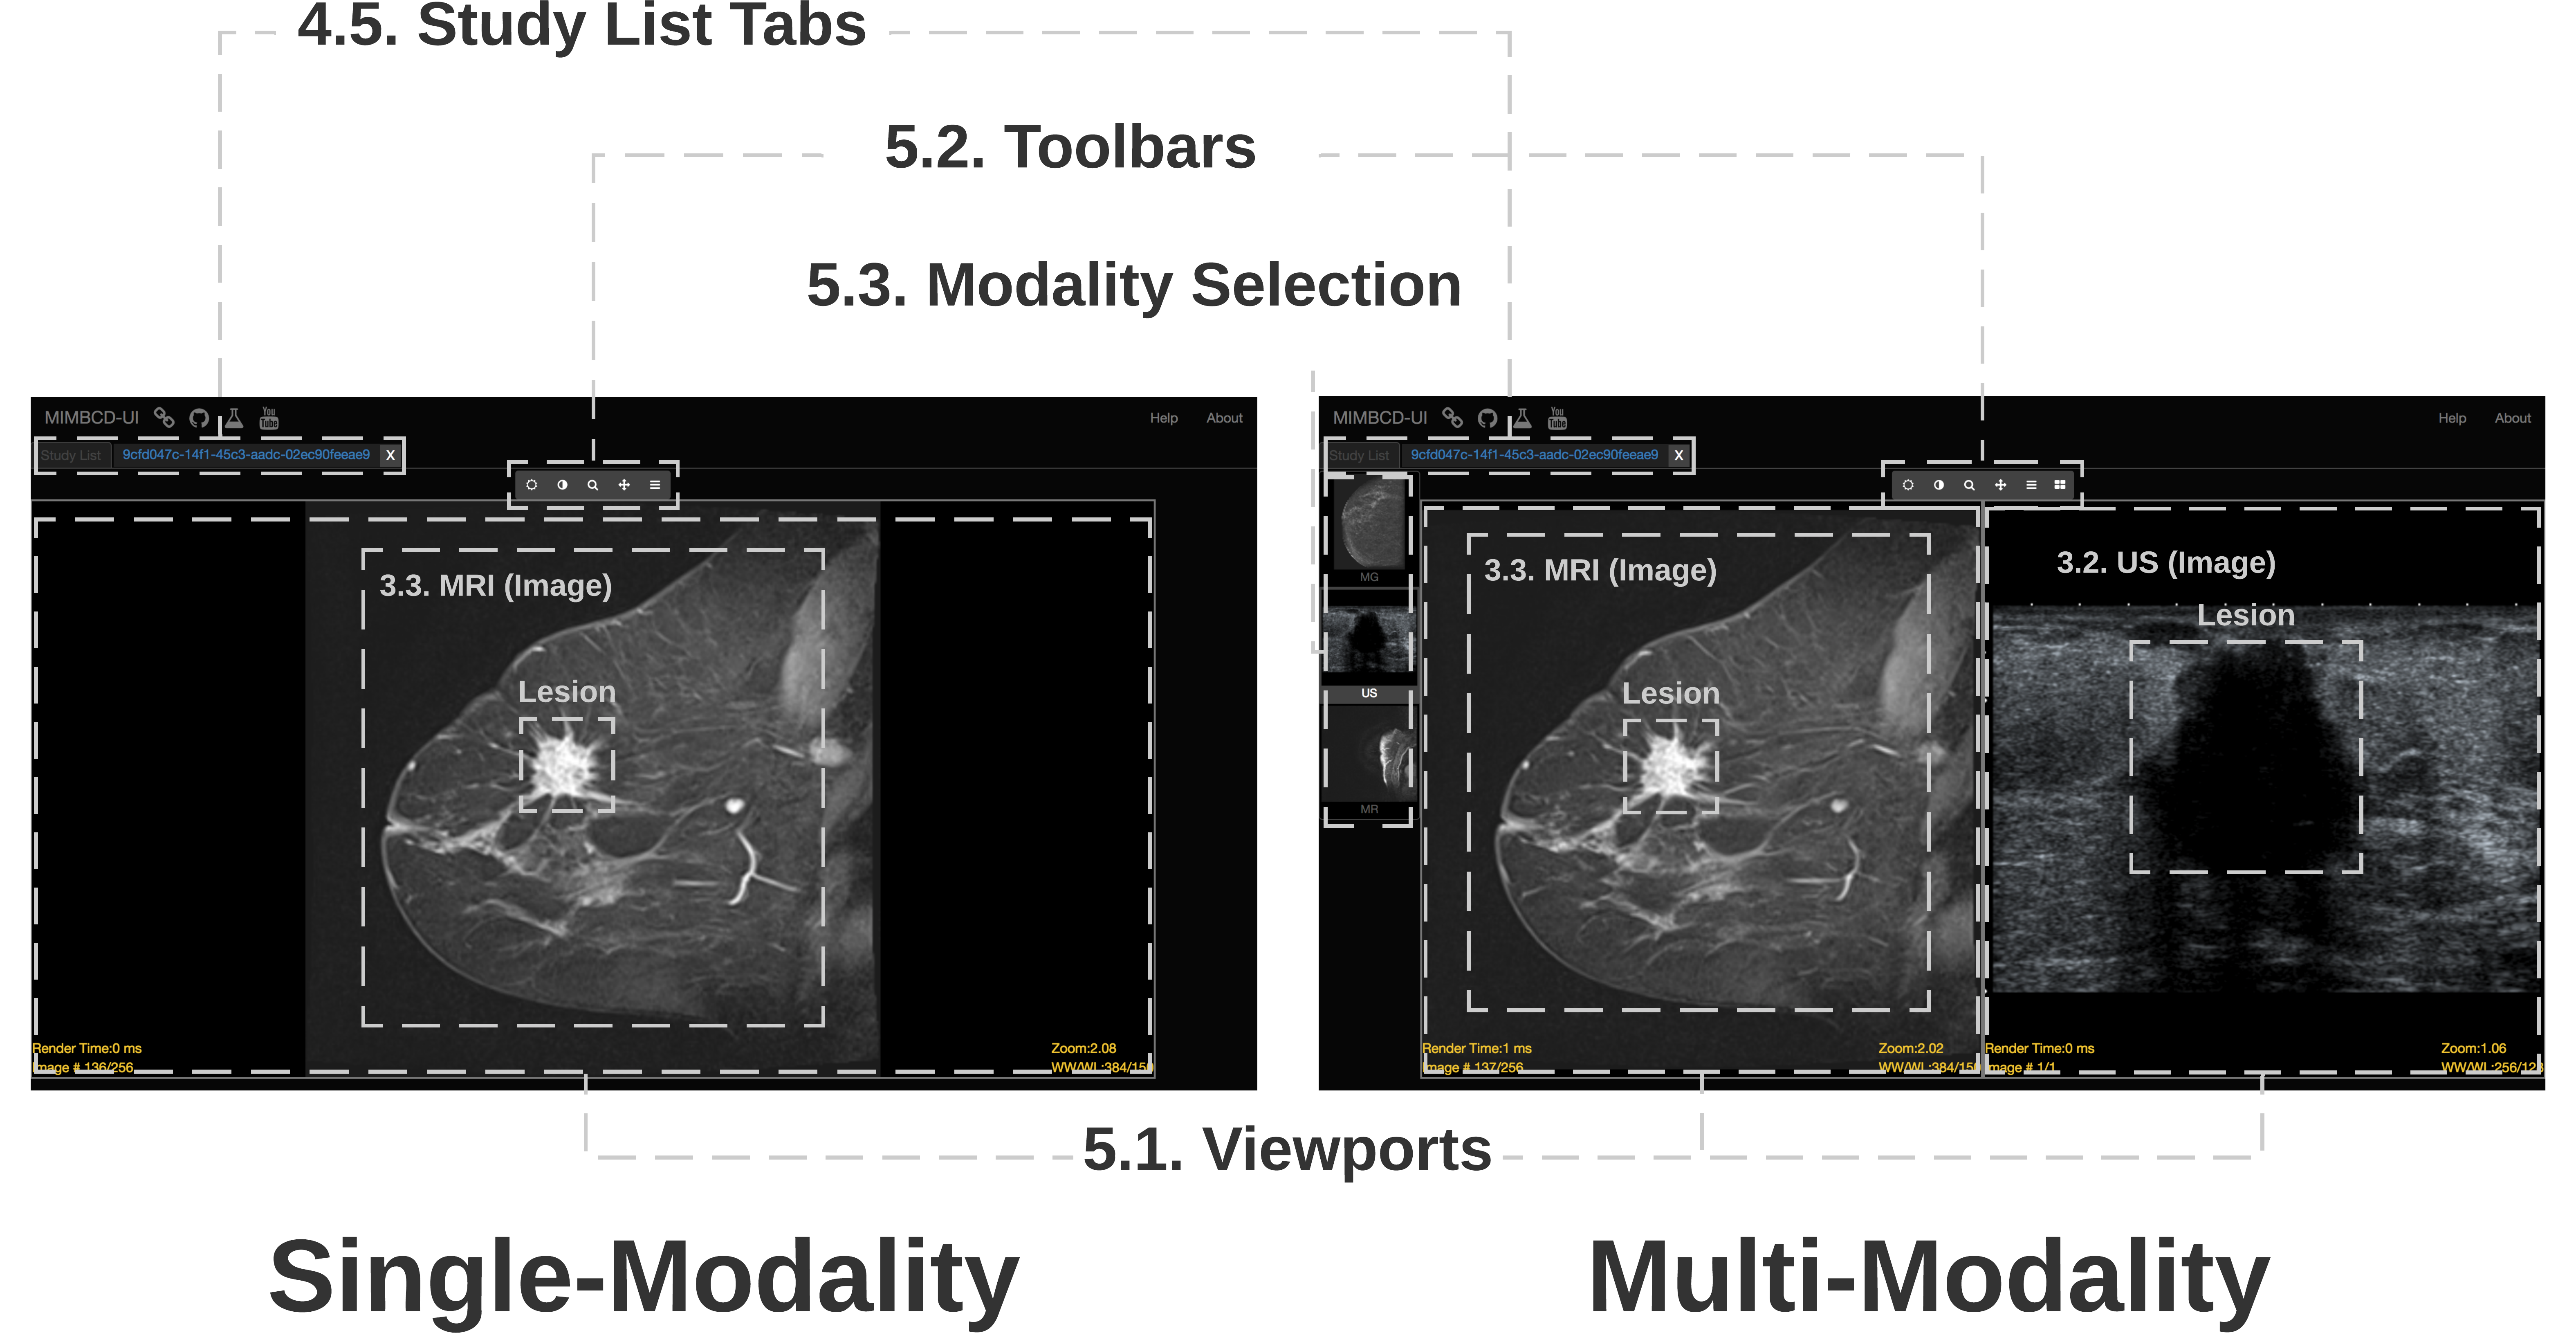
The User Interface (UI) consists of two main components: 4. List of Patient Views; and 5. Medical Imaging Diagnosis Views. These two main components (Figure 1) are also divided into several sections: 4.5. Study List Tabs; 5.1. Viewports; 5.2. Toolbars; and 5.3. Modality Selection. Concerning 5. Medical Imaging Diagnosis Views (Viewports, Toolbars and Modality Selection) this contributes for the temporal awareness (TAS). More specifically, the clinician can probe for lesion patterns (Maicas et al., 2018) via the 5.1. Viewports, processing the image by using the 5.2. Toolbars features (GTO). The system 5.2. Toolbars are supporting our image segmentation (ISS). The 5.1. Viewports are displayed right after the 5.2. Toolbars, designing around and for medical images (DMI) what also improves the temporal awareness (TAS) of the task. On the same time, this design is supporting the way how to interact with several modalities (SMS). Regarding 5.3. Modality Selection, this allows to the clinician to find more different views (SMS) of the same lesion, allowing to perform a better severity classification (Section 5). Finally, the clinician may look for the lesion shape and contour irregularities (Figure 1) to focus on the segments of the image (ISS). After interacting with the system at the first time, the clinician is able to efficiently process (ISS) several images at a same time and use the various given modalities (SMS).
4.2. Implementation
BreastScreening was implemented using CornerstoneJS (Urban et al., 2017) with a NodeJS server. To populate the system, we selected image sets from HFF patients and upload them into an Orthanc server (Jodogne, 2018). Each patient has three modalities (MG, US and MRI).
The images were pre-processed and anonymized on the Orthanc server and then consumed by the BreastScreening system. The BreastScreening core is developed in JavaScript with jQuery for HTML document manipulation, event handling and dicomParser for parsing DICOM files. The DICOM files can be loaded by drag-and-drop files into the browser window on the Orthanc view.
5. Results
We conducted an evaluation of BreastScreening in real-world conditions. Our goal was to quantitatively and qualitatively assess the proposed design principles and to understand how these principles will play in practice (Brumby et al., 2017). We are particularly interested in understanding how the design goals and challenges (Section 3) are addressed (Veeraraghavan et al., 2018). Ultimately, we are focused on clinicians’ opinions how to improve diagnostic reliability. To accomplish this, the clinicians will have first to deal with: i) new mechanisms of multi-modal data visualization; ii) identification and delineation of lesions; and iii) classification of severity (i.e. BIRADS). The experimental setup aimed at testing two conditions: Cond. C1 - Single-Modality, and Cond. C2 - Multi-Modality. For each condition (i.e., Single-Modality or Multi-Modality) we collected complete imaging exams for three patients (P1, P2 and P3) on all possible modalities (MG, US and MRI). The MG and US comprise a single 2D image (i.e., static modality), whilst the MRI (Medley et al., 2019; Santiago et al., 2018) comprises a volume with N slices (i.e., dynamic modality (Santiago et al., 2017)). The exams were previously annotated and classified with a BIRADS severity from an expert doctor who leads the HFF radiology department.
5.1. Participants
Our study involved 31 clinicians, recruited on a volunteer basis from a broad range of clinical scenarios, including six different health institutions (two public hospitals, two cancer institutes and two private clinics). From the demographic questionnaires: 16.10% of the clinicians have between 31 and 40 years of practical experience (Seniors), 45.20% have between 11 and 30 years of experience (Middles), 9.70% have between 6 and 10 years of experience (Juniors), and 29% have limited experience (Interns). Interviews were conducted in a semi-structured fashion taking about 30 minutes. Overall, 17 days were spent on the clinical institutions for the observation process and six months for the classification.
5.2. Quantitative Analysis
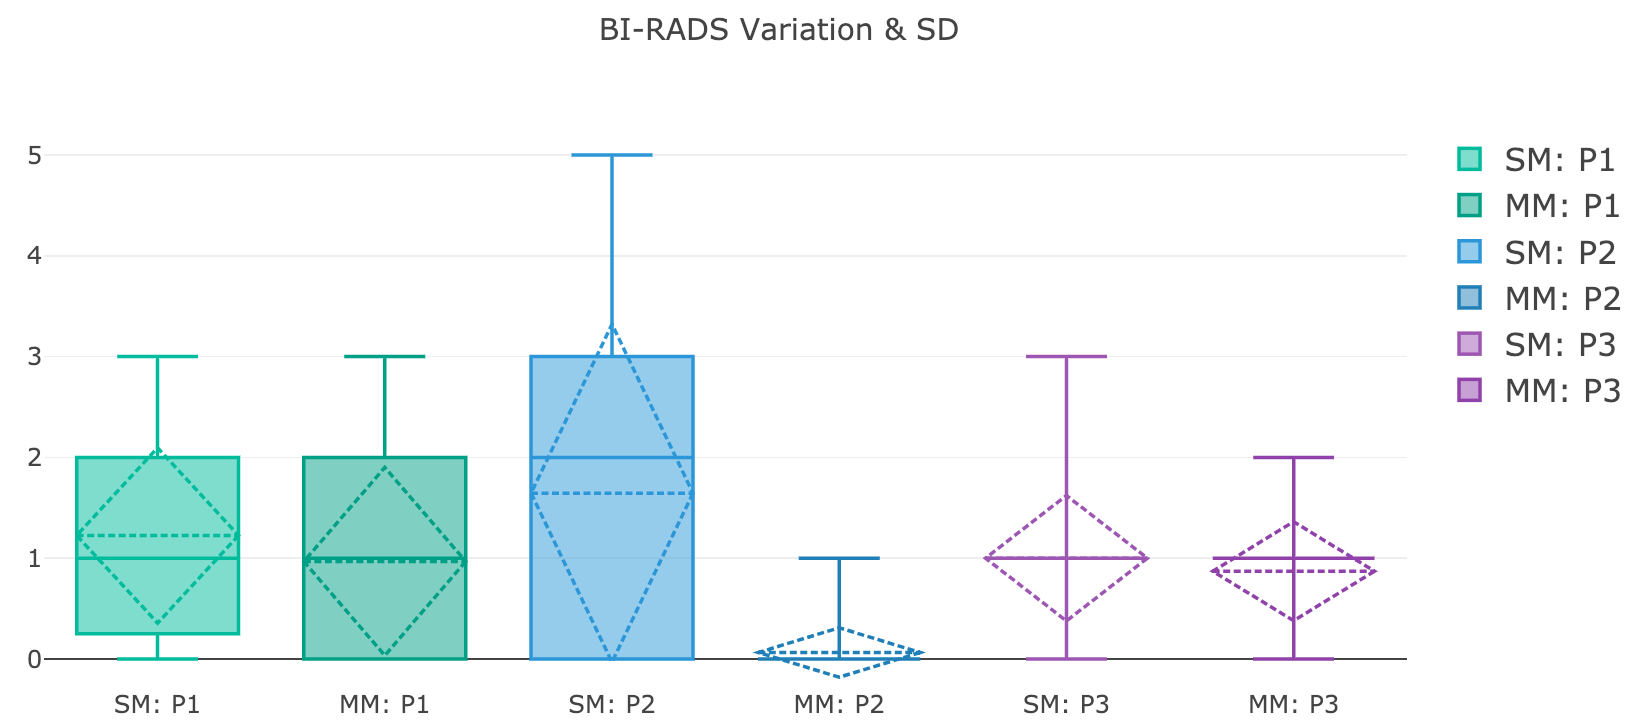
Four relations222Available datasets: usability (mimbcd-ui.github.io/dataset-uta4-sus), workload (mimbcd-ui.github.io/dataset-uta4-nasa-tlx), time (mimbcd-ui.github.io/dataset-uta4-time), severity rates (mimbcd-ui.github.io/dataset-uta4-rates), and images (mimbcd-ui.github.io/dataset-uta4-dicom). emerged from our analysis: a) differences between SUS Scores and SUS Questions (Tyllinen et al., 2016) among clinical experience (i.e., Intern, Junior, Middle, and Senior); b) the workload measurements of both Single-Modality and Multi-Modality views; c) the relation between Time and Number of Clicks, clustering by Patient (i.e., P1, P2 and P3). The expert classification for the patients used in this study are , and respectively, for both Single-Modality and Multi-Modality views; and, d) the distributions of the BIRADS variation (Figure 2).
5.2.1. SUS Scores vs SUS Questions
The ANOVA test333N: the number of users (Clinicians); : the F-test used for comparing the factors of the total deviation per each variable (var) categorized by clinical experience; : Mean value of the variable (var); : the Standard Deviation (SD) per each variable (var). (Wobbrock et al., 2011) yields a significant difference in both Single-Modality (FSM = 11.79, pSM = 0.001 0.05) and Multi-Modality (FMM = 23.31, pMM = 0.001 0.05) conditions among the various clinical experience of Clinicians. Participants adopting the Multi-Modality (MMM = 2.9, SDMM = 0.90) condition obtained higher SUS scores than those using the Single-Modality (MSM = 2.7, SDSM = 1.01) condition.
5.2.2. Workload
The results generated from the NASA-TLX (Cockburn and Gutwin, 2019) yields a significant main effect for the Physical Demand (FSM = 5.81, pSM = 0.003 0.05) and Temporal Demand (FSM = 4.86, pSM = 0.009 0.05). On the other hand, the Multi-Modality condition indicates that there exists a significant difference among Mental Demand (FMM = 3.13, pMM = 0.04 0.05), Physical Demand (FMM = 4.61, pMM = 0.009 0.05), and Temporal Demand (FMM = 9.17, pMM = 0.001 0.05). The NASA-TLX yields significant difference among groups for both Effort (FMM = 3.74, pMM = 0.02 0.05) and Frustration (FMM = 3.93, pMM = 0.01 0.05).
5.2.3. Time vs Number of Clicks
Results showing the amount of Time and Number of Clicks in each of the 566 images among the three patients are following described. The ANOVA test shows a non-significant interaction effect over the total Time from both Single-Modality (FSM = 0.68, pSM = 0.56 0.05) and Multi-Modality (FMM = 0.28, pMM = 0.83 0.05) regarding the clinical experience groups. In addition, our results show a non-significant interaction effect for the total amount of Number of Clicks from both Single-Modality (FSM = 1.76, pSM = 0.17 0.05) and Multi-Modality (FMM = 0.57, pMM = 0.63 0.05).
5.2.4. BIRADS Classification
The first and second order statistics of the BIRADS classification is shown in Figure 2. The mean values are referenced to the patient BIRADS (previously performed by the expert), that is, we have (from left to right) the patients P1, P2 and P3, with BIRADSreal = 2, BIRADSreal = 5 and BIRADSreal = 3, respectively. From this figure, it is clear that the Multi-Modality performs better, since the most severe BIRADS exhibits the smaller mean and variance (BIRADSreal - BIRADSprovided) in the most of the cases. Also note that for the most problematic patient (in this case P2 scored with ) the multi-modal largely outperforms the Single-Modality setting.
5.3. Qualitative Analysis
Clinicians were invited to give some feedback about the UI during the open interviews. We received several positive comments regarding our BreastScreening system. At the end, several clinicians (19/31) answered that the assistant will be an asset of an immense importance for the current RR situation: “The system will be a great asset for us” (C6). Another positive answer was the one related to the frequency of use (28/31) for this new assistant regarding the current system used by the clinicians on the daily practice: “I would like to frequently use your system on my daily practice” (C1).
6. Conclusion
Medical imaging systems provide a promising but challenging problem for HCI research. In this paper, we presented field research, design and comparative deployment of a multimodal user interface for breast screening, BreastScreening is a proof-of-concept prototype developed to embody the emerging design goals from the underlying clinical context. Our work and contributions included: a) identifying the main clinical workflow issues, the interaction cognitive load challenges (Castner et al., 2016) and the opportunities; b) establishing a set of design goals for medical imaging design; c) the design, reflections and in-situ evaluation of BreastScreening supporting the clinical translation; and d) the impact evidence of Multi-Modality in diagnosing and severity classification of breast lesions with 31 radiologists in six different clinical institutions. Our results444We provide our statistical analysis (mimbcd-ui.github.io/statistical-analysis) supporting this study with evidence. Several charts are plotted to help on the visualization of our results. show that the system can lead to more efficient and accurate clinical diagnosis.
References
- (1)
- Aghaei et al. (2018) Faranak Aghaei, Seyedehnafiseh Mirniaharikandehei, Alan B Hollingsworth, Rebecca G Stoug, Melanie Pearce, Hong Liu, and Bin Zheng. 2018. Association between background parenchymal enhancement of breast MRI and BIRADS rating change in the subsequent screening. In Medical Imaging 2018: Imaging Informatics for Healthcare, Research, and Applications, Vol. 10579. International Society for Optics and Photonics, SPIE, Houston, Texas, United States, 105790R.
- Balducci and Buono (2018) Fabrizio Balducci and Paolo Buono. 2018. Building a Qualified Annotation Dataset for Skin Lesion Analysis Trough Gamification (AVI ’18). ACM, New York, NY, USA, Article 36, 5 pages. https://doi.org/10.1145/3206505.3206555
- Brumby et al. (2017) Duncan P. Brumby, Ann Blandford, Anna L. Cox, Sandy J. J. Gould, and Paul Marshall. 2017. Understanding People: A Course on Qualitative and Quantitative HCI Research Methods (CHI EA ’17). Association for Computing Machinery, New York, NY, USA, 1170–1173. https://doi.org/10.1145/3027063.3027103
- Cai et al. (2019) Carrie J. Cai, Samantha Winter, David Steiner, Lauren Wilcox, and Michael Terry. 2019. “Hello AI”: Uncovering the Onboarding Needs of Medical Practitioners for Human-AI Collaborative Decision-Making. Proc. ACM Hum.-Comput. Interact. 3, CSCW, Article Article 104 (Nov. 2019), 24 pages. https://doi.org/10.1145/3359206
- Calisto (2017) Francisco Maria Calisto. 2017. Medical Imaging Multimodality Breast Cancer Diagnosis User Interface. Master’s thesis. Instituto Superior Técnico, Avenida Rovisco Pais 1, 1049-001 Lisboa - Portugal (EU). A Medical Imaging study for Multimodality of Breast Cancer Diagnosis on a novel User Interface.
- Calisto (2019) Francisco Maria Calisto. 2019. Assistant Introduction: User Testing Guide For A Comparison Between Multi-Modality and AI-Assisted Systems. Technical Report. Madeira Interactive Technologies Institute. https://doi.org/10.13140/RG.2.2.16566.14403/1
- Calisto et al. (2017) Francisco M. Calisto, Alfredo Ferreira, Jacinto C. Nascimento, and Daniel Gonçalves. 2017. Towards Touch-Based Medical Image Diagnosis Annotation (ISS ’17). ACM, New York, NY, USA, 390–395. https://doi.org/10.1145/3132272.3134111
- Castner et al. (2016) Nora Castner, Solveig Klepper, Lena Kopnarski, Fabian Hüttig, Constanze Keutel, Katharina Scheiter, Juliane Richter, Thérése Eder, and Enkelejda Kasneci. 2016. Overlooking: The Nature of Gaze Behavior and Anomaly Detection in Expert Dentists (MCPMD ’18). ACM, New York, NY, USA, Article 8, 6 pages. https://doi.org/10.1145/3279810.3279845
- Cockburn and Gutwin (2019) Andy Cockburn and Carl Gutwin. 2019. Anchoring Effects and Troublesome Asymmetric Transfer in Subjective Ratings (CHI ’19). Association for Computing Machinery, New York, NY, USA, Article Paper 362, 12 pages. https://doi.org/10.1145/3290605.3300592
- Gallo et al. (2008) Luigi Gallo, Giuseppe De Pietro, Antonio Coronato, and Ivana Marra. 2008. Toward a Natural Interface to Virtual Medical Imaging Environments (AVI ’08). Association for Computing Machinery, New York, NY, USA, 429–432. https://doi.org/10.1145/1385569.1385651
- Gonzales et al. (2015) Michael J. Gonzales, Vanice C. Cheung, and Laurel D. Riek. 2015. Designing Collaborative Healthcare Technology for the Acute Care Workflow (PervasiveHealth ’15). ICST (Institute for Computer Sciences, Social-Informatics and Telecommunications Engineering), Brussels, BEL, 145–152.
- Henriksen et al. (2018) Emilie L Henriksen, Jonathan F Carlsen, Ilse MM Vejborg, Michael B Nielsen, and Carsten A Lauridsen. 2018. The efficacy of using computer-aided detection (CAD) for detection of breast cancer in mammography screening: a systematic review. Acta Radiologica 60, 13–18 (2018), 0284185118770917.
- Igarashi et al. (2016) Takeo Igarashi, Naoyuki Shono, Taichi Kin, and Toki Saito. 2016. Interactive Volume Segmentation with Threshold Field Painting (UIST ’16). ACM, New York, NY, USA, 403–413. https://doi.org/10.1145/2984511.2984537
- Jodogne (2018) Sébastien Jodogne. 2018. The Orthanc Ecosystem for Medical Imaging. Journal of Digital Imaging 31, 3 (01 Jun 2018), 341–352. https://doi.org/10.1007/s10278-018-0082-y
- Koutsabasis and Domouzis (2016) Panayiotis Koutsabasis and Chris K. Domouzis. 2016. Mid-Air Browsing and Selection in Image Collections (AVI ’16). Association for Computing Machinery, New York, NY, USA, 21–27. https://doi.org/10.1145/2909132.2909248
- Lee et al. (2018) Bongshin Lee, Arjun Srinivasan, John Stasko, Melanie Tory, and Vidya Setlur. 2018. Multimodal Interaction for Data Visualization (AVI ’18). Association for Computing Machinery, New York, NY, USA, Article Article 11, 3 pages. https://doi.org/10.1145/3206505.3206602
- Maicas et al. (2018) Gabriel Maicas, Andrew P. Bradley, Jacinto C. Nascimento, Ian Reid, and Gustavo Carneiro. 2018. Training Medical Image Analysis Systems like Radiologists. In Medical Image Computing and Computer Assisted Intervention – MICCAI 2018, Alejandro F. Frangi, Julia A. Schnabel, Christos Davatzikos, Carlos Alberola-López, and Gabor Fichtinger (Eds.). Springer Intern. Publishing, Cham, 546–554.
- Maicas et al. (2019) Gabriel Maicas, Andrew P. Bradley, Jacinto C. Nascimento, Ian Reid, and Gustavo Carneiro. 2019. Deep Reinforcement Learning for Detecting Breast Lesions from DCE-MRI. Springer Intern. Publishing, Cham, 163–178. https://doi.org/10.1007/978-3-030-13969-8_8
- Medley et al. (2019) D. O. Medley, C. Santiago, and J. C. Nascimento. 2019. Segmenting The Left Ventricle In Cardiac In Cardiac MRI: From Handcrafted To Deep Region Based Descriptors. In 2019 IEEE 16th International Symposium on Biomedical Imaging (ISBI 2019). IEEE, Venice, Italy, 644–648.
- Nascimento and Carneiro (2019) J. C. Nascimento and G. Carneiro. 2019. One shot segmentation: unifying rigid detection and non-rigid segmentation using elastic regularization. IEEE Transactions on Pattern Analysis and Machine Intelligence 1, 2922959 (2019), 1–1.
- Ng et al. (2017) Kwan Hoong Ng, Jeannie Hsiu Ding Wong, and Sock Keow Tan. 2017. Technical Specifications of Medical Imaging Equipment. In Defining the Medical Imaging Requirements for a Rural Health Center. Springer, Singapore, 49–74.
- Oram et al. (2014) Louise Oram, Karon MacLean, Philippe Kruchten, and Bruce Forster. 2014. Crafting Diversity in Radiology Image Stack Scrolling: Control and Annotations (DIS ’14). ACM, New York, NY, USA, 567–576. https://doi.org/10.1145/2598510.2598585
- Paulo et al. (2019) Soraia Figueiredo Paulo, Filipe Relvas, Hugo Nicolau, Yosra Rekik, Vanessa Machado, João Botelho, José João Mendes, Laurent Grisoni, Joaquim Jorge, and Daniel Simões Lopes. 2019. Touchless interaction with medical images based on 3D hand cursors supported by single-foot input: A case study in dentistry. Journal of Biomedical Informatics 100 (2019), 103316. https://doi.org/10.1016/j.jbi.2019.103316
- Porta (2006) Marco Porta. 2006. Browsing Large Collections of Images through Unconventional Visualization Techniques (AVI ’06). Association for Computing Machinery, New York, NY, USA, 440–444. https://doi.org/10.1145/1133265.1133354
- Rosado et al. (2015) Luís Rosado, Maria João M. Vasconcelos, Fernando Correia, and Nuno Costa. 2015. A Novel Framework for Supervised Mobile Assessment and Risk Triage of Skin Lesions (PervasiveHealth ’15). ICST (Institute for Computer Sciences, Social-Informatics and Telecommunications Engineering), ICST, Brussels, Belgium, Belgium, 266–267. http://dl.acm.org/citation.cfm?id=2826165.2826213
- Santiago et al. (2017) C. Santiago, J. C. Nascimento, and J. S. Marques. 2017. Fast and accurate segmentation of the LV in MR volumes using a deformable model with dynamic programming. In 2017 IEEE International Conference on Image Processing (ICIP). IEEE, Beijing, China, 1747–1751.
- Santiago et al. (2018) Carlos Santiago, Jacinto C. Nascimento, and Jorge S. Marques. 2018. Fast segmentation of the left ventricle in cardiac MRI using dynamic programming. Computer Methods and Programs in Biomedicine 154 (2018), 9 – 23. https://doi.org/10.1016/j.cmpb.2017.10.028
- Sousa et al. (2017) Maurício Sousa, Daniel Mendes, Soraia Paulo, Nuno Matela, Joaquim Jorge, and Daniel Simões Lopes. 2017. VRRRRoom: Virtual Reality for Radiologists in the Reading Room (CHI ’17). ACM, New York, NY, USA, 4057–4062. https://doi.org/10.1145/3025453.3025566
- Spak et al. (2017) D.A. Spak, J.S. Plaxco, L. Santiago, M.J. Dryden, and B.E. Dogan. 2017. BI-RADS® fifth edition: A summary of changes. Diagnostic and Interventional Imaging 98, 3 (2017), 179 – 190. https://doi.org/10.1016/j.diii.2017.01.001
- Srinivas (2015) preethi Srinivas. 2015. Modeling Clinical Workflow in Daily ICU Rounds to Support Task-Based Patient Monitoring and Care (CSCW’15 Companion). Association for Computing Machinery, New York, NY, USA, 105–108. https://doi.org/10.1145/2685553.2699332
- Tyllinen et al. (2016) Mari Tyllinen, Johanna Kaipio, Tinja Lääveri, and Marko H.T. Nieminen. 2016. We Need Numbers!: Heuristic Evaluation During Demonstrations (HED) for Measuring Usability in IT System Procurement (CHI ’16). ACM, New York, NY, USA, 4129–4141. https://doi.org/10.1145/2858036.2858570
- Urban et al. (2017) Trinity Urban, Erik Ziegler, Rob Lewis, Chris Hafey, Cheryl Sadow, Annick D Van den Abbeele, and Gordon J Harris. 2017. LesionTracker: Extensible open-source zero-footprint web viewer for cancer imaging research and clinical trials. Cancer research 77, 21 (2017), e119–e122.
- van Schooten et al. (2010) Boris W. van Schooten, Elisabeth M. A. G. van Dijk, Elena Zudilova-Seinstra, Avan Suinesiaputra, and Johan H. C. Reiber. 2010. The Effect of Stereoscopy and Motion Cues on 3D Interpretation Task Performance (AVI ’10). Association for Computing Machinery, New York, NY, USA, 167–170. https://doi.org/10.1145/1842993.1843023
- Veeraraghavan et al. (2018) Harini Veeraraghavan, Brittany Z. Dashevsky, Natsuko Onishi, Meredith Sadinski, Elizabeth Morris, Joseph O. Deasy, and Elizabeth J. Sutton. 2018. Appearance Constrained Semi-Automatic Segmentation from DCE-MRI is Reproducible and Feasible for Breast Cancer Radiomics: A Feasibility Study. Scientific Reports 8, 1 (2018), 4838. https://doi.org/10.1038/s41598-018-22980-9
- Wilcox et al. (2010) Lauren Wilcox, Dan Morris, Desney Tan, and Justin Gatewood. 2010. Designing Patient-centric Information Displays for Hospitals (CHI ’10). ACM, New York, NY, USA, 2123–2132. https://doi.org/10.1145/1753326.1753650
- Wobbrock et al. (2011) Jacob O. Wobbrock, Leah Findlater, Darren Gergle, and James J. Higgins. 2011. The Aligned Rank Transform for Nonparametric Factorial Analyses Using Only Anova Procedures (CHI ’11). ACM, New York, NY, USA, 143–146. https://doi.org/10.1145/1978942.1978963
- Woundefinedniak et al. (2014) Paweł Woundefinedniak, Andrzej Romanowski, Asim Evren Yantaç, and Morten Fjeld. 2014. Notes from the Front Lines: Lessons Learnt from Designing for Improving Medical Imaging Data Sharing (NordiCHI ’14). Association for Computing Machinery, New York, NY, USA, 381–390. https://doi.org/10.1145/2639189.2639256
- Zhang et al. (2018) Zizhao Zhang, Lin Yang, and Yefeng Zheng. 2018. Translating and Segmenting Multimodal Medical Volumes With Cycle- and Shape-Consistency Generative Adversarial Network. In The IEEE Conference on Computer Vision and Pattern Recognition (CVPR). IEEE, Salt Lake City, Utah, USA, 9242–9251.