Very high energy -ray emission from two blazars of unknown redshift and upper limits on their distance
Abstract
We report on the detection of very-high-energy (VHE; GeV) -ray emission from the BL Lac objects KUV 003111938 and PKS 1440389 with the High Energy Stereoscopic System (H.E.S.S.). H.E.S.S. observations were accompanied or preceded by multi-wavelength observations with Fermi/LAT, XRT and UVOT on board the Swift satellite, and ATOM. Based on an extrapolation of the Fermi/LAT spectrum towards the VHE -ray regime, we deduce a 95% confidence level upper limit on the unknown redshift of KUV 003111938 of , and of PKS 1440389 of . When combined with previous spectroscopy results the redshift of KUV 003111938 is constrained to and for PKS 1440389 to .
keywords:
Blazars – Relativistic Jets – Gamma-Ray Astronomy – Multiwavelength Observations1Centre for Space Research, North-West University, Potchefstroom 2520, South Africa
2Universität Hamburg, Institut für Experimentalphysik, Luruper Chaussee 149, D 22761 Hamburg, Germany
3Max-Planck-Institut für Kernphysik, P.O. Box 103980, D 69029 Heidelberg, Germany
4Dublin Institute for Advanced Studies, 31 Fitzwilliam Place, Dublin 2, Ireland
5High Energy Astrophysics Laboratory, RAU, 123 Hovsep Emin St Yerevan 0051, Armenia
6Yerevan Physics Institute, 2 Alikhanian Brothers St., 375036 Yerevan, Armenia
7Institut für Physik, Humboldt-Universität zu Berlin, Newtonstr. 15, D 12489 Berlin, Germany
8University of Namibia, Department of Physics, Private Bag 13301, Windhoek, Namibia, 12010
9GRAPPA, Anton Pannekoek Institute for Astronomy, University of Amsterdam, Science Park 904, 1098 XH Amsterdam, The Netherlands
10Department of Physics and Electrical Engineering, Linnaeus University, 351 95 Växjö, Sweden
11Institut für Theoretische Physik, Lehrstuhl IV: Weltraum und Astrophysik, Ruhr-Universität Bochum, D 44780 Bochum, Germany
12Institut für Astro- und Teilchenphysik, Leopold-Franzens-Universität Innsbruck, A-6020 Innsbruck, Austria
13School of Physical Sciences, University of Adelaide, Adelaide 5005, Australia
14LUTH, Observatoire de Paris, PSL Research University, CNRS, Université Paris Diderot, 5 Place Jules Janssen, 92190 Meudon, France
15Sorbonne Université, Université Paris Diderot, Sorbonne Paris Cité, CNRS/IN2P3, Laboratoire de Physique Nucléaire et de Hautes Energies, LPNHE, 4 Place Jussieu, F-75252 Paris, France
16Laboratoire Univers et Particules de Montpellier, Université Montpellier, CNRS/IN2P3, CC 72, Place Eugène Bataillon, F-34095 Montpellier Cedex 5, France
17IRFU, CEA, Université Paris-Saclay, F-91191 Gif-sur-Yvette, France
18Astronomical Observatory, The University of Warsaw, Al. Ujazdowskie 4, 00-478 Warsaw, Poland
19Aix Marseille Université, CNRS/IN2P3, CPPM, Marseille, France
20Instytut Fizyki Ja̧drowej PAN, ul. Radzikowskiego 152, 31-342 Kraków, Poland
21School of Physics, University of the Witwatersrand, 1 Jan Smuts Avenue, Braamfontein, Johannesburg, 2050 South Africa
22Laboratoire d’Annecy de Physique des Particules, Univ. Grenoble Alpes, Univ. Savoie Mont Blanc, CNRS, LAPP, 74000 Annecy, France
23Landessternwarte, Universität Heidelberg, Königstuhl, D 69117 Heidelberg, Germany
24Université Bordeaux, CNRS/IN2P3, Centre d’Études Nucléaires de Bordeaux Gradignan, 33175 Gradignan, France
25Institut für Astronomie und Astrophysik, Universität Tübingen, Sand 1, D 72076 Tübingen, Germany
26Laboratoire Leprince-Ringuet, École Polytechnique, CNRS, Institut Polytechnique de Paris, F-91128 Palaiseau, France
27Université de Paris, CNRS, Astroparticule et Cosmologie, F-75013 Paris, France
28Department of Physics and Astronomy, The University of Leicester, University Road, Leicester, LE1 7RH, United Kingdom
29Nicolaus Copernicus Astronomical Center, Polish Academy of Sciences, ul. Bartycka 18, 00-716 Warsaw, Poland
30Institut für Physik und Astronomie, Universität Potsdam, Karl-Liebknecht-Strasse 24/25, D 14476 Potsdam, Germany
31Friedrich-Alexander-Universität Erlangen-Nürnberg, Erlangen Centre for Astroparticle Physics, Erwin-Rommel-Str. 1, D 91058 Erlangen, Germany
32DESY, D-15738 Zeuthen, Germany
33Obserwatorium Astronomiczne, Uniwersytet Jagielloński, ul. Orla 171, 30-244 Kraków, Poland
34Institute of Astronomy, Faculty of Physics, Astronomy and Informatics, Nicolaus Copernicus University, Grudziadzka 5, 87-100 Torun, Poland
35Department of Physics, University of the Free State, PO Box 339, Bloemfontein 9300, South Africa
36Department of Physics, Rikkyo University, 3-34-1 Nishi-Ikebukuro, Toshima-ku, Tokyo 171-8501, Japan
37Kavli Institute for the Physics and Mathematics of the Universe (WPI), The University of Tokyo Institutes for Advanced Study (UTIAS), The University of Tokyo, 5-1-5 Kashiwa-no-Ha, Kashiwa, Chiba, 277-8583, Japan
38Department of Physics, The University of Tokyo, 7-3-1 Hongo, Bunkyo-ku, Tokyo 113-0033, Japan
39RIKEN, 2-1 Hirosawa, Wako, Saitama 351-0198, Japan
40University of Oxford, Department of Physics, Denys Wilkinson Building, Keble Road, Oxford OX1 3RH, UK
41Institut de Ciències del Cosmos (ICC UB), Universitat de Barcelona (IEEC-UB), Martí Franquès 1, E08028 Barcelona, Spain
1 Introduction
The extragalactic -ray sky is strongly dominated by blazars, a class of radio-loud, jet-dominated active galactic nuclei (AGN) in which the relativistic jet is oriented at a small angle with respect to the line of sight. This alignment leads to strong Doppler enhancement of the observed flux across the entire electromagnetic spectrum as well as a shortening of the apparent variability, which has been observed to be as short as a few minutes (e.g., Gaidos et al., 1996; Albert et al., 2007; Aharonian et al., 2007; Arlen et al., 2013). The radio to rays spectral energy distribution (SED) of blazars is dominated by two distinct, non-thermal radiation components, where the low-energy emission (from radio through UV or X-rays) is generally ascribed to synchrotron radiation from relativistic electrons/positrons in the jet. For the high-energy emission, both a Compton-scattering-based leptonic scenario and a hadronic scenario, where -ray emission results from proton synchrotron radiation and photo-pion-induced processes, are plausible (see, e.g., Böttcher et al., 2013, for a comparative study of both types of models).
The multi-wavelength variability of blazars exhibits complex patterns on all time scales, from years down to minutes, with variability at different frequencies sometimes being correlated, but sometimes also showing uncorrelated behaviour, such as “orphan” -ray flares without significant counterparts at lower frequencies (e.g., Krawczynski et al., 2004). The fast (intra-day) variability time scales indicate that the broadband emission, at least from optical to -ray frequencies, must originate in small, localised regions along the jet, with a radius no larger than cm, where is the observed variability time-scale, is the Doppler factor of the emitting region, and is the redshift of the source. Measurements of blazar SEDs and their variability thus provide a unique laboratory for probing the microphysical processes of particle acceleration and radiative cooling in AGN jets.
Based on the location of the peak of the low-energy (synchrotron) spectral component, , blazars are sub-divided into low-synchrotron-peaked (LSP, with Hz), intermediate-synchrotron-peaked (ISP, with Hz), and high-synchrotron-peaked (HSP) blazars (with Hz; Abdo et al., 2010). Blazars are also divided into BL Lacertae objects (BL Lacs) and Flat-Spectrum Radio-Quasars (FSRQs) on the basis of their optical/UV spectrum, which is almost featureless in BL Lacs, and shows broad emission lines in FSRQs. While FSRQs are all LSPs, BL Lacs are characterised by a variety of peak frequencies. The vast majority of blazars detected by ground-based Imaging Atmospheric Cherenkov telescope (IACT) facilities in very high energy (VHE; GeV) rays are BL Lacs belonging to the HSP class.
As VHE rays are subject to absorption due to pair production on IR – optical photons, the extragalactic background light (EBL) limits the cosmic horizon out to which VHE -ray sources are detectable (e.g., Nikishov, 1962; Gould & Schréder, 1967; Stecker et al., 1992; Aharonian et al., 2006a; Finke et al., 2010). In agreement with this expectation, no VHE -ray source has so far been detected at a redshift , the current record holder being the gravitationally-lensed blazar S3 0218+35 at a redshift of (Ahnen et al., 2016).
While the EBL absorption represents an intrinsic limit for VHE astrophysics, it is possible to probe the EBL itself through its absorption imprint on VHE spectra of blazars (e.g., H.E.S.S. Collaboration et al., 2017; Fermi-LAT Collaboration et al., 2018; Abeysekara et al., 2019; Acciari et al., 2019).
For such studies, as large a sample of VHE blazars as possible, over as large a redshift range as possible, is necessary in order to disentangle source-intrinsic high-energy cut-offs from the effect of absorption on the EBL, improve the statistical uncertainty on the measurement, and study the evolution of the EBL with the redshift. A high redshift by itself does not necessarily mean that a blazar is interesting for propagation studies, given that both the intrinsic brightness of the source and the hardness of its spectrum play a key role. This motivates continued programmes by all currently operating IACT arrays to detect new VHE blazars and characterise their spectral properties in the VHE band. The selection of targets for such searches is most commonly based on an extrapolation of the High Energy (HE; MeV) -ray spectra as measured by the Fermi Large Area Telescope (LAT, Nolan et al., 2012; Acero et al., 2015a), taking into account the expected attenuation due to EBL absorption: bright and hard LAT sources are prime candidates for pointed observations with IACTs.
A major problem when studying blazars is that the measurement of a BL Lac’s redshift is not trivial, due to the weakness of the emission lines (if any) in the optical spectrum. It is possible to constrain the redshift via the identification of absorption lines from the host-galaxy, or to provide a lower limit on it via the detection of absorption lines from inter-galactic absorbers. If the redshift is unknown, it is possible to use the current knowledge of the EBL together with the information from Fermi/LAT to compute an upper limit on the redshift of the source.
In this paper we present the detection with H.E.S.S. in the VHE regime of two blazars, selected for their hard Fermi/LAT spectra and large upper limits on their redshift, KUV 003111938 and PKS 1440389. We present new constraining upper limits on their distance using Fermi/LAT and H.E.S.S. spectral information. We describe the details of the H.E.S.S. observations and data analysis in Section 2, and results from multi-wavelength observations in Section 3. Then in Section 4.1 we present the SEDs, and in Section 4.2 we discuss our redshift constraint. We conclude with a summary of our results in Section 5. Throughout this text, the results for KUV 003111938 and PKS 1440389 are presented in separate subsections.
1.1 KUV 00311-1938
KUV 003111938 has been classified as a BL Lac firstly by a spectroscopic identification in the sample of bright, soft, high-Galactic-latitude X-ray sources from the ROSAT All-Sky Survey (Voges et al., 1999; Thomas et al., 1998). Later, Bauer et al. (2000) associated this bright () ROSAT source with a strong radio emitter (Condon et al., 1998, ). Its extreme value of the X-ray to radio flux ratio and its high X-ray flux, led to its inclusion in the Sedentary Multi-Frequency Survey catalogue (Piranomonte et al., 2007), which primarily selected HSPs.
A first evaluation of the redshift of KUV 003111938 was performed by Piranomonte et al. (2007), where a value of 0.61 was quoted although flagged as “tentative”. Later, Pita et al. (2014) detected the MgII doubled with the X-Shooter spectrograph operating on the VLT to estimate a secure lower limit on the redshift of the source to 0.506, and used non-detection of the host galaxy to place an upper redshift limit of 1.54. Recently, Fernandez Alonso et al. (2019) attempted to constrain the redshift of KUV 003111938, by estimating the range of EBL absorption allowed by the preliminary H.E.S.S. observations presented in Becherini et al. (2012) and matching this to existing EBL models. They conclude that a redshift around 0.5-0.6 is the most plausible.
KUV 003111938 has been imaged multiple times with VLBI by Piner & Edwards (2018), who observed superluminal apparent motions of a secondary jet component with relative to a fixed radio core at , (Piner & Edwards, 2014). We take the position of the radio core as our nominal location for KUV 003111938.
The Fermi/LAT (Atwood et al., 2009a) reported the detection of a very bright HE -ray source consistent with KUV 003111938 in all the catalogues, including the ones compiled with high energy events only (Acero et al., 2015b; Ajello et al., 2017).
In the most-recent 4FGL (The Fermi-LAT collaboration, 2019) catalog this source has an integrated flux of in the [1–100] GeV range and a photon power-law spectrum with a hard () spectral index. The spectrum is reported as curved, with both a log-parabola () as well as a power-law with exponential cutoff () being preferred over the simple power-law. The 4FGL reports modest fractional variance on both yearly ( ) and bi-monthly ( ) timescales, with the larger variability seen on the shorter timescale.
H.E.S.S. observations of this source started at the end of 2009 and were pursued until 2014, leading to the detection of VHE -ray emission from this distant BL Lac (see Sec. 2), reported here.
1.2 PKS 1440-389
PKS 1440389 ( ; Jackson et al., 2002) was first detected as a bright radio source in the Parkes survey (Wright & Otrupcek, 1990). The source has been observed repeatedly by the TANAMI (Tracking of AGN with Austral Milliarcsecond Interferometry, Ojha et al., 2010) project between 2010 and 2016. Krauß et al. (2016) present three quasi-simultaneous SEDs of PKS 1440-389, which indicate a synchrotron peak at Hz Hz, consistent with an HSP classification.
In the first data release of the 6dF Galaxy Survey (Jones et al., 2004), the redshift of the source is listed as , but this redshift value is no longer included in the final version of the 6dF catalogue (Jones et al., 2009) due to the poor quality of the optical spectrum. Despite many follow-up observations in different wavelength regimes, the redshift of PKS 1440389 remains uncertain due to its featureless continuum spectrum (e.g., Landoni et al., 2015).
The current constraint from optical spectroscopic observations is (Shaw et al., 2013).
PKS 1440389 stands out as a bright -ray HSP with a hard, well-constrained Fermi/LAT spectrum, with the 4FGL reporting a power-law index of and an integrated flux (over [1–100] GeV) of . Similar to KUV 003111938 here too the spectrum shows evidence of being curved, with both a log-parabola () as well as a power-law with exponential cutoff () being preferred over the simple power-law. The 4FGL also reports modest variability on both yearly () and bi-monthly ( ) timescales.
Assuming a redshift near the lower limit of the allowed range, the EBL-corrected extrapolation of the Fermi/LAT spectrum into the VHE regime appeared promising for detection, and H.E.S.S. observations in 2012 yielded the discovery of the source at VHE (Prokoph et al., 2015). Using that preliminary H.E.S.S. spectrum, Sahu et al. (2019) computed a model-dependent limit on the distance of PKS 1440389, , assuming a hadronic origin of the emission.
2 H.E.S.S. data analysis and results
H.E.S.S. is an array of five IACTs located in the Khomas Highland in Namibia (S , E ) at an altitude of about 1800 m above sea level. From January 2004 to October 2012, the array was a four-telescope instrument, with telescopes CT1-4. Each of the telescopes, located at the corners of a square with a side length of 120 m, has a mirror surface area of 107 and a camera composed of photomultipliers covering a large field of view (FoV) of diameter. The stereoscopic system works in a coincidence mode, requiring at least two of the four telescopes to trigger the detection of an extended air shower. In its initial four-telescope configuration used here, H.E.S.S. is sensitive to -ray energies from 100 GeV to about 100 TeV (Aharonian et al., 2006b).
In October 2012, a fifth telescope (CT5), with a mirror surface area of 600 and an improved camera (Bolmont et al., 2014) was installed at the centre of the original square.
All observations were done in wobble mode, where the source is observed with an offset of with respect to the centre of the instrument’s field of view to allow for simultaneous background measurements (Fomin et al., 1994). The analysis of the -ray emission from the two sources was carried out with the analysis procedure described in Parsons & Hinton (2014), where an enhanced low-energy sensitivity with respect to standard analysis methods (Aharonian et al., 2006b) is achieved. Since these sources are potentially very distant and so likely have very soft spectra, a special analysis configuration with a charge value of photo electrons is used as the minimal required total amplitude for the cleaned and reconstructed image in each telescope.
The statistical significance of the two detections was determined using the Reflected background modelling method (Aharonian et al., 2006b) and Eq. (17) of Li & Ma (1983). In the Reflected background method, is the reciprocal of the number of OFF-source regions considered in a run. If the number of OFF regions vary from run to run, the average for all the runs is used.
The time-averaged differential VHE -ray spectra of the sources was derived using the forward-folding technique described in Piron et al. (2001). The maximum energy for both fits was chosen to be 3 TeV, while the minimum energy was left free and therefore represents the threshold energy.
The systematic uncertainties have been estimated following the procedure described in Aharonian et al. (2006b), with the uncertainty from the selection cuts estimated using the difference between the lead and cross-check analysis. A fit of a log parabola did not significantly improve the fit.
| KUV 003111938 | |
|---|---|
| 170 GeV | |
| 83 GeV | |
| cm-2 s-1 | |
| Crab flux | |
| PKS 1440389 | |
| 274 GeV | |
| 147 GeV | |
| cm-2 s-1 | |
| Crab flux |
2.1 KUV 003111938
H.E.S.S. started observing several high-redshift blazars in the last years of its 4-telescope configuration and continued after the addition of a fifth telescope. Among the blazars observed by H.E.S.S., KUV 003111938 had the largest lower limit on , and preliminary results of the observations were published in Becherini et al. (2012).
Observations of KUV 003111938 were carried out with H.E.S.S. in a campaign between end of 2009 and end of 2014 (MJD 55145–56954), leading to 102.6 hours of good-quality data (after hardware and weather quality selection criteria were applied with a procedure similar to that described in Aharonian et al., 2006b). These observations were taken with an average zenith angle of .
To keep consistency in the analysis of later data and the data taken mostly before the fifth telescope was added to the array, all data are analysed in the four telescope configuration, removing data from CT5.
The source is detected at a level of 5.2 standard deviations, with an excess of 340.8 counts from the ON region of radius centred at the nominal position of the source. The total number of ON- and OFF-source events are and , with a background normalisation factor . A fit to the uncorrelated excess map yields a position for the excess of and , consistent with the position of the radio core seen by the VLA. The systematic uncertainty is estimated as and , smaller than the statistical one.
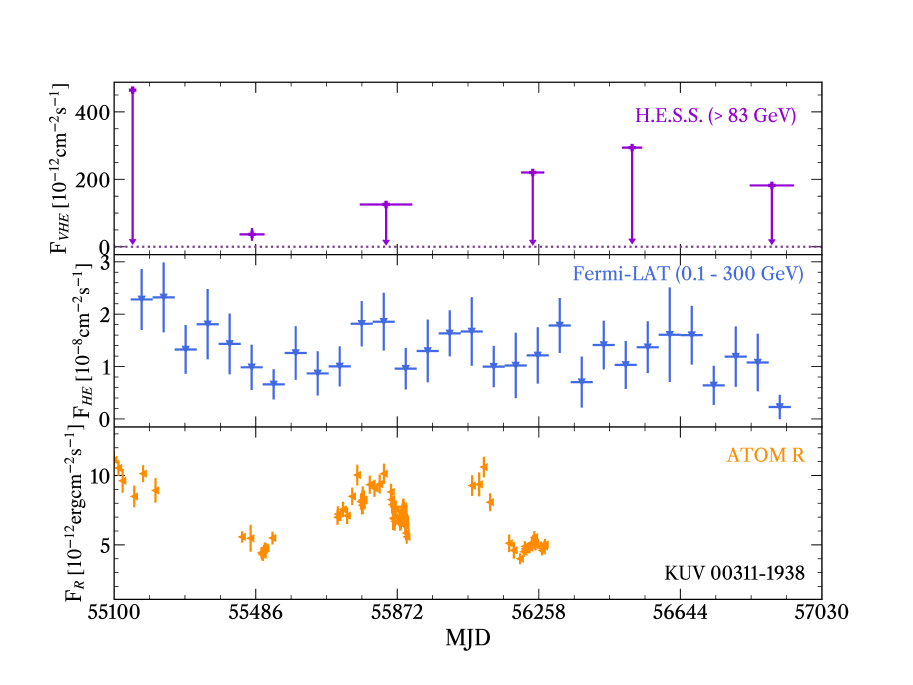
The light curve for KUV 003111938, assuming a fixed index and binned by observation period (between August and December), is shown in Fig. 1. A fit of a constant to these flux points finds no significant deviation from a steady flux (), nor is any variation found at daily timescales.
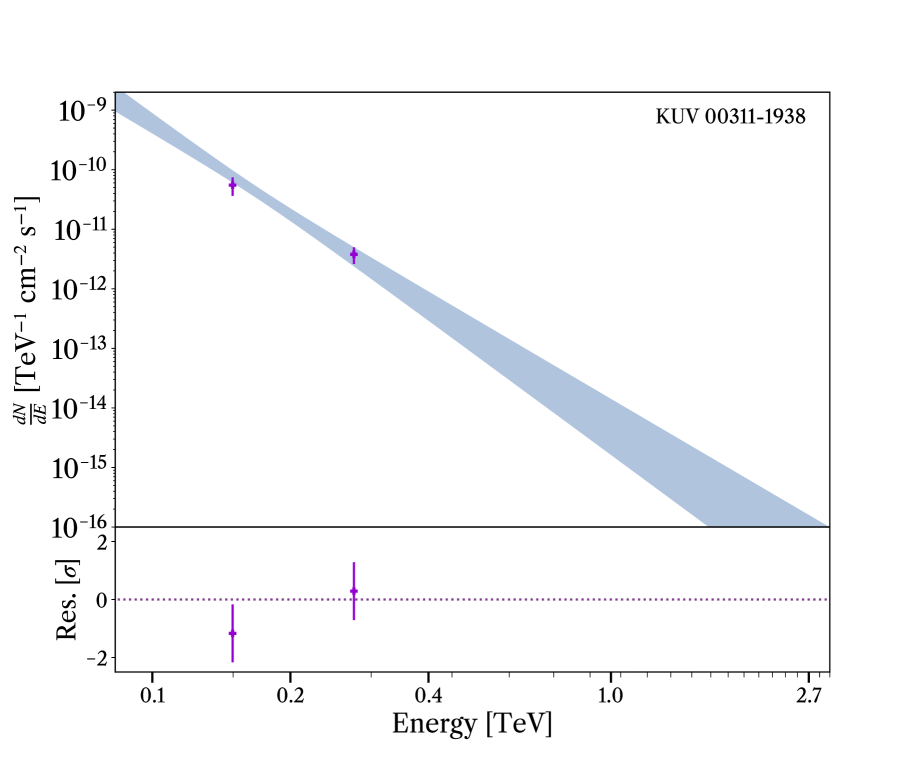
The KUV 003111938 time-averaged spectrum is presented in Fig. 2, and the fit results are presented in Table 1. The spectrum was fitted by a power-law function, see Table 2 for the full expression.
All the results have been cross-checked and confirmed with the analysis method in De Naurois & Rolland (2009).
2.2 PKS 1440389
H.E.S.S. observations of PKS 1440389 were conducted during the 3-month period between February 28 and May 27, 2012 (MJD ) at a mean zenith angle of . After quality selection and dead time correction, the data sum up to a total observation time of 11.9 hours.
The source is detected at a level of 11.7 standard deviations, with an excess of 342 counts from the ON region of radius centred at the nominal position of the source. The total number of ON- and OFF-source events being and , respectively, with a background normalisation factor .
A fit to the uncorrelated excess map yields a position for the excess of and , which is spatially consistent with the radio position of the BL Lac object PKS 1440389 (Jackson et al., 2002).
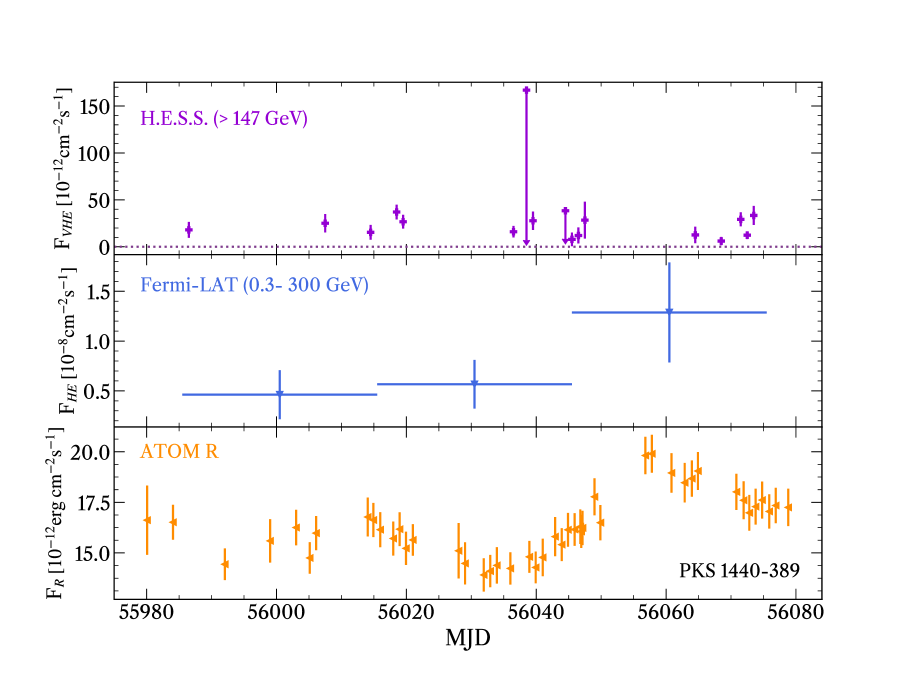
A daily binned light curve was derived for energies above the energy threshold (147 GeV), assuming a fixed spectral index, and is shown in the top right panel of Figure 1. A fit with a constant to the flux points showed no significant deviation from a steady flux (), nor was any variation detected on monthly time scales.
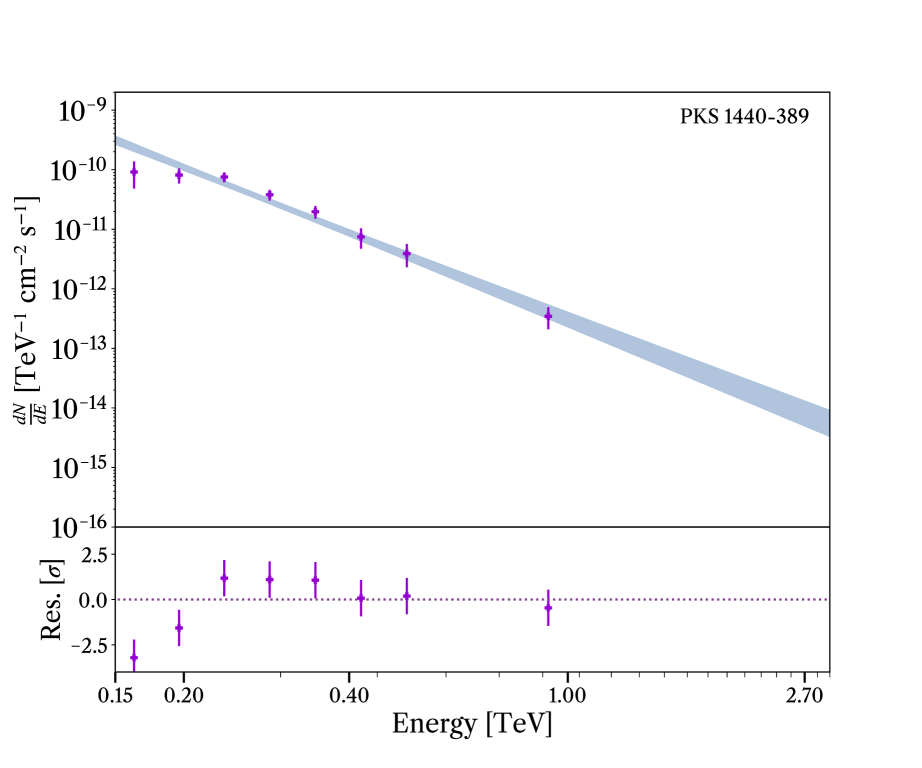
The photon spectrum in the energy range above 147 GeV (shown in Fig. 2), and the fit results are found in Table 1. The systematics were estimated in the same way as for the analysis of KUV 003111938.
All the results have been cross-checked and confirmed with the analysis method in Becherini et al. (2011).
3 Data analysis and results of multi-wavelength instruments
Complementary to the H.E.S.S. observations, multi-wavelength data from observations with Fermi/LAT (20 MeV–300 GeV), Swift/XRT (0.2–10 keV), Swift/UVOT (170–650 nm) and ATOM (optical R filter) are presented in this section. Only for PKS 1440389 are all data contemporaneous. Unfortunately, for KUV 003111938 no contemporaneous Swift observations are available.
3.1 Fermi/LAT
The Large Area Telescope (LAT) on board the Fermi satellite is a pair-conversion -ray detector, sensitive in the energy range from 20 MeV to above 300 GeV (Atwood et al., 2009b).
Data contemporaneous to the H.E.S.S. observations were analysed with the LAT ScienceTools, version v11r5p3 for both sources. Source-class events in a circular region of interest of radius centred at the positions of the sources are considered and the P8R2_SOURCE_V6 instrumental response functions were used. To remove rays produced by cosmic-ray interactions in the Earth’s limb, events with zenith angles greater than 90∘ were rejected. The isotropic background, containing both the extragalactic diffuse -ray and residual instrumental background, is estimated through the iso_p8v2_SOURCE_V6_v06 model, while the Galactic diffuse emission is modelled with the spatial template gll_iem_v06. Spectral parameters were extracted by fitting a model containing the diffuse background and point sources from the 3FGL catalogue (Acero et al., 2015a). The spectral parameters of sources within the inner 3∘ of the region of interest were left free during the fit, all others were fixed to their 3FGL values.
The spectral analysis was performed between different values of and assuming three different spectral models, a power-law (PWL), a power-law with exponential cutoff (EC) or a LogParabola (LP), see Tab 2 for full expressions.
| Spectral shape | Formula | Parameter explanation |
|---|---|---|
| Power-law (PWL) | = normalisation at , photon index. and free in the minimisation | |
| Power-law with exponential cutoff (EC) | cut-off energy, and as above. , , free in the minimisation | |
| Log-parabola (LP) | scale parameter, photon index at , and curvature parameter. , and free in the minimisation |
The three spectral models were used to assess the best spectral fit for a given analysis using the log likelihood ratio test. Results of the preferred spectral fits are summarised in Table 3. The event analysis presented here uses the binned likelihood method (Atwood et al., 2009a) with Pass8 (version 2) data and the user contributed python tools Enrico (Sanchez & Deil, 2015). The estimated systematic uncertainty on the flux in these analyses is 10% at 0.1 GeV, 5% at 0.5 GeV and 10% at 10 GeV and above (Ackermann et al., 2011). The test positions of the sources were taken from the 3FGL and are consistent with the nominal positions given previously.
For each source, we present the analysis up to and the analysis up to . The former analysis is used to understand the agreement with the H.E.S.S. spectrum in the SED shown in Section 4.1. The latter is used to assess the shape of the spectrum up at the energies where EBL absorption effects are negligible, so that the upper limit on the redshift can be evaluated, see Section 4.2.
| Source | Model | Energy range | TS | Spectral parameters | Integrated flux |
|---|---|---|---|---|---|
| [GeV] | [] | ||||
| KUV 003111938 | EC | , | |||
| , | |||||
| KUV 003111938 | PWL | 1465 | |||
| , | |||||
| PKS 1440389 | PWL | 88.4 | |||
| , | |||||
| PKS 1440389 | PWL | 57.5 | |||
| , | |||||
3.1.1 KUV 003111938
Fermi/LAT data contemporaneous to the H.E.S.S. observations, i.e. in the period from 2009-11-10 (MJD 55145) to 2014-08-25 (MJD 56894) were analysed in the [100 MeV–300 GeV] energy range and in the [100 MeV–10 GeV] energy range.
As the source has modest variability in the 4FGL catalogue (Section 1.1), a 2-month binning Fermi/LAT light curve was computed assuming a PWL shape, leaving the index free to vary (see Fig. 1).
[100 MeV–300 GeV]. No variability is detected during the H.E.S.S. observation period, as an excess variance calculation yields a value compatible with zero. The -ray emission from KUV 003111938 is therefore well described as constant in the Fermi/LAT energy range, implying that it is safe to combine the data from the full H.E.S.S. observation period into a single spectrum. All spectral models result in an excess with a significance of about . A likelihood ratio test shows that the EC ( GeV) is preferred to the simple PWL shape at the -level using five years of data, in line with the for the whole 8-years Fermi/LAT 4FGL analysis. The reconstructed Fermi/LAT spectrum is shown alongside the H.E.S.S. spectrum in Fig. 3. The significance of the Fermi/LAT binned spectral points shown is at least . If the significance of the bin is less than , a 95 % upper limit on the flux in the bin is computed.
[100 MeV–10 GeV]. All spectral models result in an excess with a significance of about . A likelihood ratio test shows that the PWL is the preferred shape in this energy range using the five years of data.
3.1.2 PKS 1440389
Fermi/LAT data analysis has been performed for the 3-month data set contemporaneous with the H.E.S.S. observations (MJD ) in the energy range [300 MeV–300 GeV] and [300 MeV–10 GeV]. The low energy bound of 300 MeV was applied to avoid contamination from the bright, nearby quasar PKS B1424418 due to the larger point spread function at low energies (Ackermann et al., 2013).
Since PKS 1440389 has modest variability in the 4FGL catalogue (Section 1.2), a monthly binning Fermi/LAT light curve was computed assuming a PWL shape, leaving the index free to vary (see Fig. 1). The excess variance calculation over the Fermi/LAT lightcurve gives a value of . Therefore data from the whole 3-month dataset were combined into a single spectrum.
[300 MeV–300 GeV]. All spectral models in this energy range result in an excess with a significance of about and the favoured shape is the PWL. The reconstructed Fermi/LAT spectrum in this range is shown alongside the H.E.S.S. spectrum in Fig. 3.
[300 MeV–10 GeV]. Spectral models in this energy range result in an excess with a significance of about and the preferred spectral shape is the PWL.
3.2 Swift/XRT and UVOT
The X-ray telescope (XRT) on board the Swift satellite is designed to measure X-rays in the 0.2–10 keV energy range (Burrows et al., 2005). Images in six filters (V and B in optical and U, UVW1, UVM2 and UVW2, in the ultra-violet, in order of increasing frequency) can be obtained simultaneously to XRT with the Swift/UVOT telescope (Roming et al., 2005).
Target of opportunity observations were obtained on 2012 April 29 (MJD 56046), following the H.E.S.S. detection of PKS 1440389. Unfortunately that was not the case for KUV 003111938 and only a few observations exist, with none of these archival observations being within the time span of the overall H.E.S.S. observing campaign.
The X-ray observations were performed with the XRT detector in photon counting (PC) mode in the 0.3–10 keV energy range. The analysis was performed using the standard HEASoft (v6.16) and Xspec (v12.8.2) tools. Source counts were extracted using the xselect task from a circular region with a radius of 20 pixels ( arcsec). Background counts were extracted from a 60-pixel circular region with no known X-ray sources. The data were grouped, requiring a minimum of 20 counts per bin and then fitted with a power-law model including photo-electric absorption with a fixed value for the Galactic column density
Sky-corrected images for all available Swift/UVOT filters were taken from the Swift archive, and aperture photometry was performed using the UVOT tasks included within the HEASoft package. Source counts were extracted using a radius for all single exposures and all filters, while the background was estimated from different positions more than away from the source. Count rates were then converted to fluxes using the standard photometric zero-points (Poole et al., 2008). The reported fluxes are de-reddened for Galactic extinction following the procedure in Roming et al. (2009), with E(B-V) estimate from the IRSA111https://irsa.ipac.caltech.edu/applications/DUST/.
3.2.1 KUV 003111938
| ID | Start | Exposure | Normalisation at 1 keV | ||
| [s] | [ cm-2 s-1 keV-1] | ||||
| -- | 8.6/10 | ||||
| -- | 22.1/26 | ||||
| -- | 23.4/23 | ||||
| -- | 41.3/32 | ||||
| -- | 16.2/15 | ||||
| -- | 93.2/82 | ||||
| -- | 124.4/108 |
We analyzed all six Swift snapshot observations of KUV 003111938 that were unfortunately performed prior to the H.E.S.S. campaign, between 2008, November 9 and 2009, May 8, see Table 4.
The XRT spectra were fitted with a single power-law model with Galactic absorption fixed at cm-2 (Willingale et al., 2013). Results are given for each individual observation in Table 4, showing that the source is variable in the X-ray band.
| ID | V | B | U | UVM1 | UVM2 | UVW2 |
|---|---|---|---|---|---|---|
| 5.730.25 | 6.620.18 | 6.150.18 | 6.070.17 | 7.0 0.19 | 6.760.14 | |
| 5.960.19 | 6.840.14 | 6.350.13 | 6.400.13 | 7.030.16 | 6.710.03 | |
| 6.340.20 | 6.680.14 | 6.170.14 | 6.120.13 | 7.520.17 | 6.700.11 | |
| 5.820.16 | 6.680.10 | 6.220.11 | 6.500.10 | 6.810.14 | 6.980.80 | |
| 6.120.13 | 6.570.76 | 6.120.84 | 6.220.86 | - | 6.560.75 | |
| 6.000.15 | 7.520.10 | 6.730.10 | 7.600.10 | 8.530.13 | 8.320.76 | |
| 17.340.56 | 18.070.42 | 18.110.42 | 14.790.17 | 19.770.27 | 17.300.36 |
During each XRT pointing, multiple exposures were taken with the Swift/UVOT instrument using all its filters. All available filters in each observation were searched for variability with the uvotmaghist tool. Since no variability was observed in any filter, the multiple images within each filter were stacked prior to performing aperture photometry. The reported fluxes in Table 5 are de-reddened for Galactic extinction with mag.
The source exhibits variability between different observations, reaching a maximum flux around 2009 May 8 in both X-rays and ultraviolet. The UVOT photometric points and XRT spectral points are shown in Figure 3.
3.2.2 PKS 1440389
The fit result of the XRT spectrum of the 8 ks exposure obtained on 2012 April 29 (MJD 56046) for a fixed Galactic column density of cm-2 (Willingale et al., 2013), can be found in Table 4.
Results from the analysis of simultaneous Swift/UVOT observations in all six filters are given in Table 5. With UVW1 and UVM2 filter observations having four individual exposures, they were stacked prior to aperture photometry as the uvotmaghist task showed no variability between the individual exposures. The reported fluxes are de-reddened for Galactic absorption, mag.
3.3 ATOM
The Automatic Telescope for Optical Monitoring222See https://www.lsw.uni-heidelberg.de/projects/hess/ATOM/ (ATOM) is a optical support telescope for H.E.S.S., located at the H.E.S.S. site. Operating since 2005, it provides optical monitoring of -ray sources. KUV 003111938 was regularly monitored from April 2008 to December 2012 in the R band (), while PKS 1440389 was observed with high cadence during the whole 2012 H.E.S.S. campaign on the source.
The ATOM data were analysed using aperture photometry with custom calibrators in the field of view. We were able to use up to four calibrators in the case of KUV 003111938 and five for PKS 1440389. The resulting magnitudes were de-reddened in the same manner as done for the UVOT data. The uncertainty on the absolute calibration is propagated into the evaluation of the flux errors.
The resulting R-band light curves, corrected for Galactic extinction, are presented in the bottom panel of Figure 1 showing clear variability in the optical regime contemporaneous with the H.E.S.S. observations, for both KUV 003111938 and PKS 1440389.
4 Discussion
In this section, we present a brief discussion of the implications of our observational results. Specifically, considering the unknown redshift of the sources, we will derive an upper limit on the redshift based on the extrapolation of the Fermi/LAT spectrum into the VHE (H.E.S.S.) regime (Section 4.2).
4.1 Spectral Energy Distribution
Here we present the broad band SED of the two sources, using both the observations presented above complemented by archival data at longer wavelengths and discuss them.
4.1.1 KUV 003111938
To find archival data to complement the observations mentioned in the previous section, the SSDC SEDBuilder tool333Available at https://tools.ssdc.asi.it/SED/ was used to retrieve AllWISE (Wright et al., 2010) data from the time period from the start of the first Swift observations to the end of the H.E.S.S. observations, a time period spanning from November 2008 to November 2014. The optical light curve for KUV 003111938 is summarised as the average flux. In addition, radio fluxes of the central object as measured by the VLA (Piner & Edwards, 2014) during the extended H.E.S.S. period are also included.
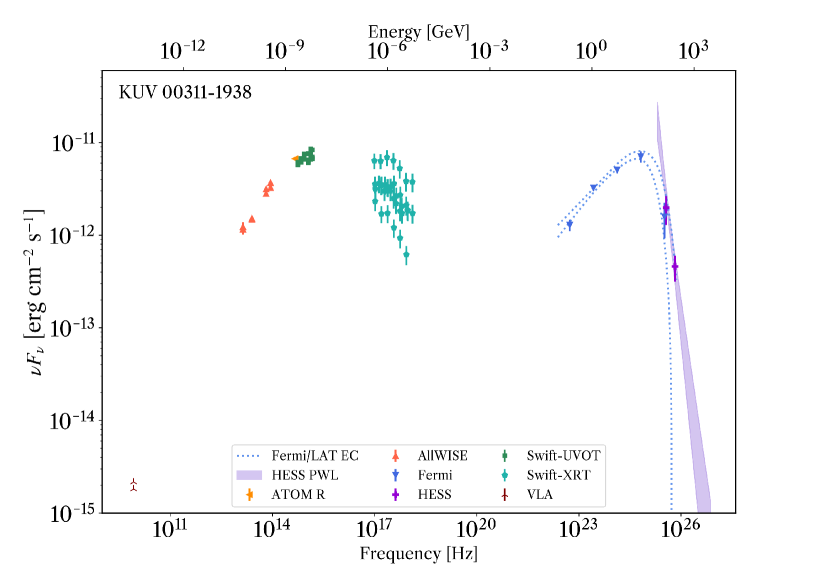
The resulting broadband SED of KUV 003111938 is shown in Fig. 3, displaying the standard synchrotron and inverse Compton peaks of similar luminosity.
Grouping the Swift/XRT observation by date defines three flux states, and fitting the synchrotron peak at each of these three states with a third order polynomial gives a peak frequency and a peak flux. The low flux state results in a peak flux of erg at Hz, the intermediate flux state results in erg at Hz and erg at Hz for the high flux state.
Despite the variability in the X-rays, it is clear that the synchrotron peak is wider than the inverse Compton peak, a strong indication that the high energy bump has suffered some form of absorption at the higher energies. This is attributed to the effect of - pair-production on the EBL in the line of sight. This type of absorption becomes more important with increasing distance, and in the next section we use -ray observations and a model for the EBL to constrain the redshift range compatible with our observations. It is also possible to get a similar break in the inverse Compton part of the spectrum if Klein-Nishina effects are important (Kusunose & Takahara, 2005).
4.1.2 PKS 1440389
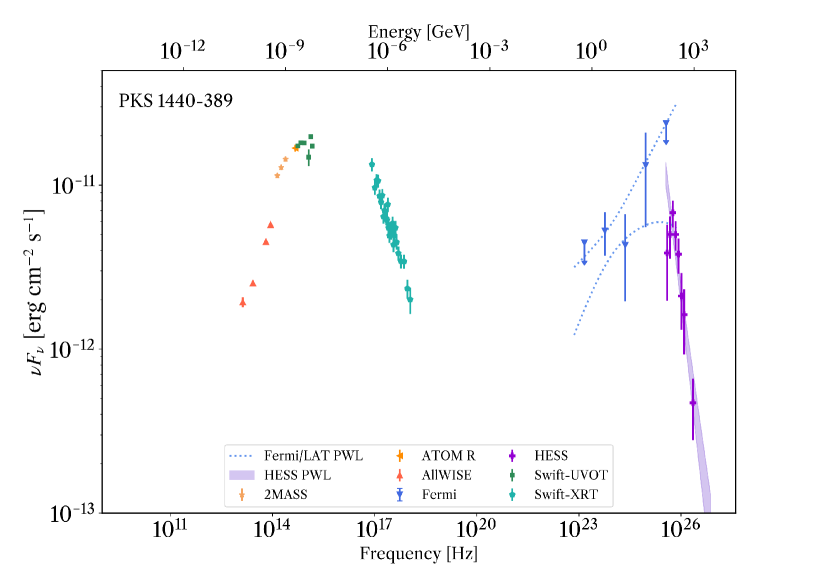
Using the multi-wavelength data sets described in detail in the previous sections, a SED of PKS 1440389 was constructed and is shown in Figure 3. In addition to the data described in the previous sections, archival data from the 2MASS (Skrutskie et al., 2006; Mao, 2011) and WISE catalogues (Wright et al., 2010) were used to complete the low-energy part of the SED, bearing in mind that those data are not contemporaneous with the rest of the SED.
Fitting the synchrotron peak with a third order polynomial gives a peak frequency of Hz with a corresponding peak flux of erg .
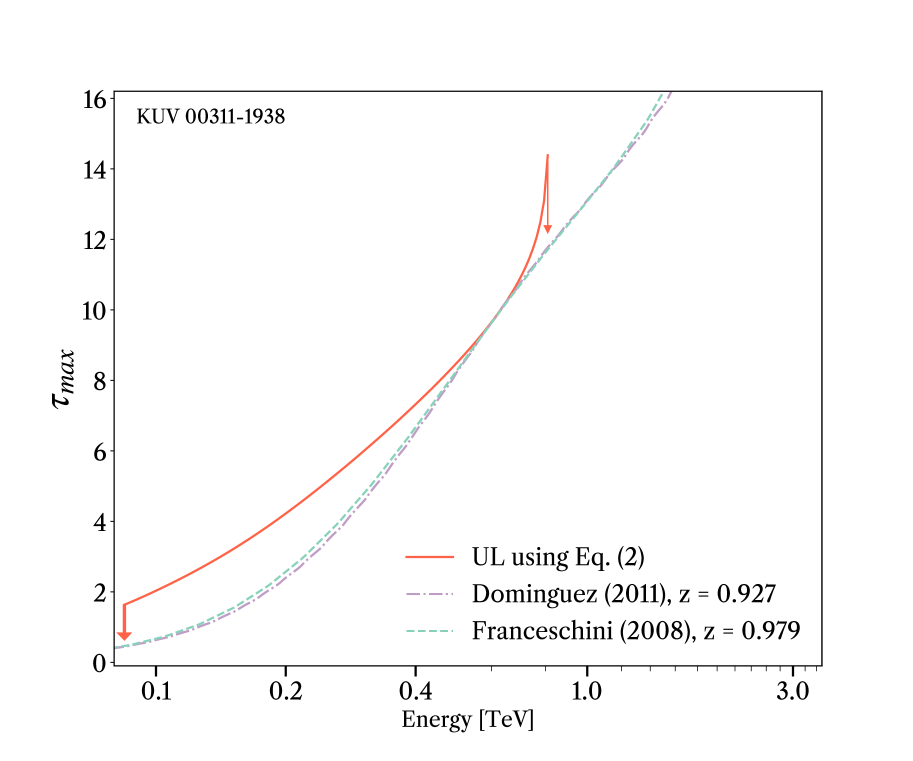

Right panel: Optical depth as a function of energy for PKS 1440389. The red line represents the upper limit at the 95% CL as derived from the combined Fermi/LAT and H.E.S.S. data using Eq. (2). Additionally shown by dashed and dot-dashed lines are the EBL model predictions for the two upper limits on the redshift.
4.2 Redshift constraints
The combined Fermi/LAT and H.E.S.S. data set can be used to derive an upper limit on the redshift of the source, assuming that there is no upturn in the source-intrinsic -ray spectrum beyond the Fermi/LAT energy range. Under this assumption, the extrapolation of the HE -ray spectrum can be seen as an upper limit on the un-absorbed flux in the VHE regime. It therefore provides a conservative upper limit on the EBL absorption effect, which will be over-estimated if there is any downward curvature in the intrinsic -ray spectrum.
To obtain the intrinsic source spectrum, the energy range for the Fermi/LAT analysis was restricted to energies for which EBL absorption is negligible and then extrapolated to VHEs. The ratio between this extrapolated flux, , and the observed VHE flux, , then provides an upper limit on the optical depth , as .
Despite the small fraction of strictly overlapping HE and VHE observations, the Fermi/LAT spectra used for this calculation are a reasonable description of the intrinsic behaviour, because the lightcurves of both sources show only modest variability in the HESS observing periods, see 3.1.1 and 3.1.2.
Following Eq. (1) from H.E.S.S. Collaboration et al. (2013), the upper limit on the optical depth at the (one sided) 95 % confidence level (CL) can be written as
| (1) |
where denotes the statistical uncertainty of the VHE flux measurement and the term accounts for its systematic uncertainty. This is taken into account in a conservative way in the sense that is the maximum factor by which the VHE flux could be overestimated. For the presented H.E.S.S. analyses, the factor is for KUV 003111938 and for PKS 1440389, corresponding to the and systematic errors on the flux for KUV 003111938 and PKS 1440389 respectively. Apart from the approximate treatment of the systematic error, Eq. (1) provides an exact expression for the 95% CL upper limit on the optical depth if the intrinsic source spectrum is known precisely.
Including the statistical uncertainty of the Fermi/LAT spectrum in the evaluation of the confidence leads to the following modified version of Eq. (1)
| (2) |
with , , the uncertainty in the extrapolated flux, and . The systematic uncertainty on the Fermi/LAT flux () has been added in a conservative way similar to the treatment of the H.E.S.S. systematics () described above. We consider for , see also Section 3.1. For full derivation of Eq. (2) see H.E.S.S. Collaboration et al. (2013, Appendix A).
Once an upper limit on the optical depth is calculated, using either Eq. (1) or Eq. (2), the distance to a given blazar can be constrained by comparing it to the predictions of a specific EBL model. This is done by assuming a redshift, and then varying the assumed redshift until the difference between the predicted absorption and the observational upper limit is minimised. The EBL models considered in this study are: the model of Franceschini et al. (2008) and the model of Domínguez et al. (2011).
For the calculation of below, we use Eq. (2). We then compare the obtained with the predictions coming from the two models. We finally estimate a redshift by trying different source redshifts and then requiring that the EBL absorption by the models should be below the maximum permissible across the energy range.
4.2.1 KUV 003111938
A power-law fitted to the Fermi/LAT data below 10 GeV (see Table 3) and extrapolated to the 83 GeV to 3.0 TeV energy band was used as the intrinsic model, . This was then compared to the H.E.S.S. observations via the measured and .
We derive an upper limit of using Domínguez et al. (2011). In comparison, using the Franceschini model we get a limit of .
The derived upper limit on the optical depth as a function of energy is shown on the left in Figure 4, calculated with Eq. (2). The H.E.S.S. constraint together with the lower-limit from optical spectroscopy, limits the the redshift of KUV 003111938 to at the 95% CL, improving on the previous upper limit of .
4.2.2 PKS 1440389
To obtain the intrinsic source spectrum for PKS 1440389, the energy range for the Fermi/LAT analysis was restricted to energies below 10 GeV. This was then extrapolated and used to estimate absorption in the energy range TeV.
An upper limit of can be put on the redshift at the 95% CL when using the EBL model of Domínguez et al. (2011). Applying the Franceschini model yields a compatible redshift constraint. This result significantly reduces the redshift constraint of obtained through optical spectroscopy by Shaw et al. (2013).
Combining our constraint with the lower limit from the non-detection of the host galaxy by Shaw et al. (2013), the redshift of PKS 1440389 is found to be in the range of at the 95% CL.
5 Summary and Conclusions
In this paper, we present the final H.E.S.S. results on the detection of the two blazars KUV 003111938 and PKS 1440389 and their multi-wavelength analysis. With the shape of the inverse Compton bump we also constrain the redshift of the sources.
The blazar KUV 003111938 has been observed by H.E.S.S. between 2009 and 2014, leading to the detection of its VHE emission with a significance of 5.2 standard deviations. The time-averaged VHE spectrum of this blazar is soft, with a photon index of and a flux of that of the Crab nebula above 147 GeV.
Observations at other wavelengths have been analysed in order to have a multi-band view of the SED of this AGN detected in the VHE range. In particular, an analysis of the HE emission in Fermi/LAT data reveals a detection of this AGN at a significance level of about standard deviations.
We reported also the detection of VHE -ray emission from the HSP PKS 1440389 by H.E.S.S., accompanied by multi-wavelength observations with Fermi/LAT, Swift/XRT and UVOT, and ATOM. The H.E.S.S. spectrum has a spectral index of and a flux of of that of the Crab nebula above 147 GeV. No evidence for short-term (day-scale or intra-day) variability has been found in the -ray regime (neither with Fermi/LAT nor with H.E.S.S.), but moderate variability on weekly timescales is found in the optical light curve measured by ATOM.
By comparing the EBL absorption derived from models of intrinsic emission fitted to data, we constrain the redshift of KUV 003111938 to below , which combines with known spectroscopical constraints to give . While VHE blazars have been detected up to , the most distant ones have been seen only during flaring states. The current most distant and, within the limited duty cycle of IACTs, that are monitoring the VHE sky at the current sensitivity level only for the last two decades, persistent (since observations began and within observational constraints), VHE blazar is PKS 1424+240 (Acciari et al., 2010) at . KUV 003111938 can thus potentially be the most distant persistent emitter of VHE photons. The determination of its redshift via optical spectroscopy is thus of paramount importance for VHE astrophysics: once its distance is constrained, it will be one of the best sources to study the propagation of VHE photons in the Universe.
For the blazar PKS 1440389 based on an extrapolation of the Fermi/LAT spectrum towards the measured H.E.S.S. VHE -ray spectrum, accounting for EBL absorption, we deduce an upper limit on the redshift of the source of . Combined with previous results, this constrains the redshift to the range . PKS 1440389 is found to be a standard source within the VHE HSPs, fitting reasonably well into the current population.
Acknowledgements
The support of the Namibian authorities and of the University of Namibia in facilitating the construction and operation of H.E.S.S. is gratefully acknowledged, as is the support by the German Ministry for Education and Research (BMBF), the Max Planck Society, the German Research Foundation (DFG), the Helmholtz Association, the Alexander von Humboldt Foundation, the French Ministry of Higher Education, Research and Innovation, the Centre National de la Recherche Scientifique (CNRS/IN2P3 and CNRS/INSU), the Commissariat à l’énergie atomique et aux énergies alternatives (CEA), the U.K. Science and Technology Facilities Council (STFC), the Knut and Alice Wallenberg Foundation, the National Science Centre, Poland grant no. 2016/22/M/ST9/00382, the South African Department of Science and Technology and National Research Foundation, the University of Namibia, the National Commission on Research, Science and Technology of Namibia (NCRST), the Austrian Federal Ministry of Education, Science and Research and the Austrian Science Fund (FWF), the Australian Research Council (ARC), the Japan Society for the Promotion of Science and by the University of Amsterdam. We appreciate the excellent work of the technical support staff in Berlin, Zeuthen, Heidelberg, Palaiseau, Paris, Saclay, Tübingen and in Namibia in the construction and operation of the equipment.
This work benefited from services provided by the H.E.S.S. Virtual Organisation, supported by the national resource providers of the EGI Federation.
The H.E.S.S. and Fermi/LAT analysis computations were performed on resources provided by the Swedish National Infrastructure for Computing (SNIC) at Lunarc. Tomas Bylund and Yvonne Becherini wish to acknowledge the support of the Data Intensive Sciences and Applications (DISA) centre at Linnaeus University.
Matteo Cerruti has received financial support through the Postdoctoral Junior Leader Fellowship Programme from la Caixa Banking Foundation (LCF/BQ/PI18/11630012).
This research made use of the NASA/IPAC Extragalactic Database (NED) and of the SIMBAD Astronomical Database, of data products from the Wide-field Infrared Survey Explorer, which is a joint project of the University of California, Los Angeles, and the Jet Propulsion Laboratory/California Institute of Technology, funded by the National Aeronautics and Space Administration.
We acknowledge the use of public data from the Swift data archive.
This research made use of Gammapy, a community-developed core Python package for gamma-ray astronomy (Deil et al., 2017).
This research has made use of data and software provided by the Fermi Science Support Center, managed by the HEASARC at the Goddard Space Flight Center.
Part of this work is based on archival data, software or online services provided by the Space Science Data Center - ASI.
This research has made use of the VizieR catalogue access tool, CDS, Strasbourg, France (DOI: 10.26093/cds/vizier). The original description of the VizieR service was published in A&AS 143, 23.
References
- Abdo et al. (2010) Abdo A. A., et al., 2010, ApJ, 716, 30
- Abeysekara et al. (2019) Abeysekara A. U., et al., 2019, ApJ, 885, 150
- Acciari et al. (2010) Acciari V. A., et al., 2010, ApJ, 708, L100
- Acciari et al. (2019) Acciari V. A., et al., 2019, MNRAS, 486, 4233
- Acero et al. (2015a) Acero F., et al., 2015a, ApJS, 218, 23
- Acero et al. (2015b) Acero F., et al., 2015b, The Astrophysical Journal Supplement Series, 218, 23
- Ackermann et al. (2011) Ackermann M., et al., 2011, ApJ, 743, 171
- Ackermann et al. (2013) Ackermann M., et al., 2013, ApJ, 765, 54
- Aharonian et al. (2006a) Aharonian F., et al., 2006a, Nature, 440, 1018
- Aharonian et al. (2006b) Aharonian F., et al., 2006b, A&A, 457, 899
- Aharonian et al. (2007) Aharonian F., et al., 2007, ApJ, 664, L71
- Ahnen et al. (2016) Ahnen M. L., et al., 2016, A&A, 595, A98
- Ajello et al. (2017) Ajello M., et al., 2017, ApJS, 232, 18
- Albert et al. (2007) Albert J., et al., 2007, ApJ, 669, 862
- Arlen et al. (2013) Arlen T., et al., 2013, ApJ, 762, 92
- Atwood et al. (2009a) Atwood W. B., et al., 2009a, ApJ, 697, 1071
- Atwood et al. (2009b) Atwood W. B., et al., 2009b, ApJ, 697, 1071
- Bauer et al. (2000) Bauer F. E., Condon J. J., Thuan T. X., Broderick J. J., 2000, The Astrophysical Journal Supplement Series, 129, 547
- Becherini et al. (2011) Becherini Y., Djannati-Ataï A., Marandon V., Punch M., Pita S., 2011, Astroparticle Physics, 34, 858
- Becherini et al. (2012) Becherini Y., Boisson C., Cerruti M., H. E. S. S. Collaboration 2012, in Aharonian F. A., Hofmann W., Rieger F. M., eds, American Institute of Physics Conference Series Vol. 1505, American Institute of Physics Conference Series. pp 490–493, doi:10.1063/1.4772304
- Bolmont et al. (2014) Bolmont J., et al., 2014, Nuclear Instruments and Methods in Physics Research A, 761, 46
- Böttcher et al. (2013) Böttcher M., Reimer A., Sweeney K., Prakash A., 2013, ApJ, 768, 54
- Burrows et al. (2005) Burrows D. N., et al., 2005, Space Sci. Rev., 120, 165
- Condon et al. (1998) Condon J. J., Cotton W. D., Greisen E. W., Yin Q. F., Perley R. A., Taylor G. B., Broderick J. J., 1998, AJ, 115, 1693
- De Naurois & Rolland (2009) De Naurois M., Rolland L., 2009, Astroparticle Physics, 32, 231
- Deil et al. (2017) Deil C., et al., 2017, in 35th International Cosmic Ray Conference (ICRC2017). p. 766 (arXiv:1709.01751)
- Domínguez et al. (2011) Domínguez A., et al., 2011, MNRAS, 410, 2556
- Fermi-LAT Collaboration et al. (2018) Fermi-LAT Collaboration et al., 2018, Science, 362, 1031
- Fernandez Alonso et al. (2019) Fernandez Alonso M., Pichel A., Rovero A., 2019, in Proceedings of Sciece.
- Finke et al. (2010) Finke J. D., Razzaque S., Dermer C. D., 2010, ApJ, 712, 238
- Fomin et al. (1994) Fomin V. P., Stepanian A. A., Lamb R. C., Lewis D. A., Punch M., Weekes T. C., 1994, Astroparticle Physics, 2, 137
- Franceschini et al. (2008) Franceschini A., Rodighiero G., Vaccari M., 2008, A&A, 487, 837
- Gaidos et al. (1996) Gaidos J. A., et al., 1996, Nature, 383, 319
- Gould & Schréder (1967) Gould R. J., Schréder G. P., 1967, Phys. Rev., 155, 1408
- H.E.S.S. Collaboration et al. (2013) H.E.S.S. Collaboration et al., 2013, A&A, 552, A118
- H.E.S.S. Collaboration et al. (2017) H.E.S.S. Collaboration et al., 2017, A&A, 606, A59
- Jackson et al. (2002) Jackson C. A., Wall J. V., Shaver P. A., Kellermann K. I., Hook I. M., Hawkins M. R. S., 2002, A&A, 386, 97
- Jones et al. (2004) Jones D. H., et al., 2004, MNRAS, 355, 747
- Jones et al. (2009) Jones D. H., et al., 2009, MNRAS, 399, 683
- Krauß et al. (2016) Krauß F., et al., 2016, A&A, 591, A130
- Krawczynski et al. (2004) Krawczynski H., et al., 2004, ApJ, 601, 151
- Kusunose & Takahara (2005) Kusunose M., Takahara F., 2005, ApJ, 621, 285
- Landoni et al. (2015) Landoni M., et al., 2015, AJ, 149, 163
- Li & Ma (1983) Li T. P., Ma Y. Q., 1983, ApJ, 272, 317
- Mao (2011) Mao L. S., 2011, New Astron., 16, 503
- Nikishov (1962) Nikishov A. I., 1962, Sov. Phys. JETP, 14, 393
- Nolan et al. (2012) Nolan P. L., et al., 2012, The Astrophysical Journal Supplement Series, 199, 31
- Ojha et al. (2010) Ojha R., et al., 2010, A&A, 519, A45
- Parsons & Hinton (2014) Parsons R. D., Hinton J. A., 2014, Astroparticle Physics, 56, 26
- Piner & Edwards (2014) Piner B. G., Edwards P. G., 2014, ApJ, 797, 25
- Piner & Edwards (2018) Piner B. G., Edwards P. G., 2018, ApJ, 853, 68
- Piranomonte et al. (2007) Piranomonte S., Perri M., Giommi P., Landt H., Padovani P., 2007, A&A, 470, 787
- Piron et al. (2001) Piron F., et al., 2001, A&A, 374, 895
- Pita et al. (2014) Pita S., et al., 2014, A&A, 565, A12
- Poole et al. (2008) Poole T. S., et al., 2008, MNRAS, 383, 627
- Prokoph et al. (2015) Prokoph H., Becherini Y., Böttcher M., Boisson C., Lenain J. P., Sushch I., 2015, in 34th International Cosmic Ray Conference (ICRC2015). p. 862 (arXiv:1509.03972)
- Roming et al. (2005) Roming P. W. A., et al., 2005, Space Sci. Rev., 120, 95
- Roming et al. (2009) Roming P. W. A., et al., 2009, ApJ, 690, 163
- Sahu et al. (2019) Sahu S., López Fortín C. E., Nagataki S., 2019, ApJ, 884, L17
- Sanchez & Deil (2015) Sanchez D., Deil C., 2015, Enrico: Python package to simplify Fermi-LAT analysis, Astrophysics Source Code Library (ascl:1501.008)
- Shaw et al. (2013) Shaw M. S., et al., 2013, ApJ, 764, 135
- Skrutskie et al. (2006) Skrutskie M. F., et al., 2006, AJ, 131, 1163
- Stecker et al. (1992) Stecker F. W., de Jager O. C., Salamon M. H., 1992, ApJ, 390, L49
- The Fermi-LAT collaboration (2019) The Fermi-LAT collaboration 2019, arXiv e-prints, p. arXiv:1902.10045
- Thomas et al. (1998) Thomas H. C., Beuermann K., Reinsch K., Schwope A. D., Truemper J., Voges W., 1998, A&A, 335, 467
- Voges et al. (1999) Voges W., et al., 1999, VizieR Online Data Catalog, p. IX/10A
- Willingale et al. (2013) Willingale R., Starling R. L. C., Beardmore A. P., Tanvir N. R., O’Brien P. T., 2013, MNRAS, 431, 394
- Wright & Otrupcek (1990) Wright A., Otrupcek R., 1990, in PKS Catalog (1990).
- Wright et al. (2010) Wright E. L., et al., 2010, AJ, 140, 1868