Collimated synchrotron threads linking the radio lobes of ESO 137-006
We present MeerKAT 1000 MHz and 1400 MHz observations of a bright radio galaxy in the southern hemisphere, ESO 137-006. The galaxy lies at the centre of the massive and merging Norma galaxy cluster. The MeerKAT continuum images (rms 0.02 mJy/beam at 10′′resolution) reveal new features that have never been seen in a radio galaxy before: collimated synchrotron threads of yet unknown origin, which link the extended and bent radio lobes of ESO 137-006. The most prominent of these threads stretches in projection for about 80 kpc and is about 1 kpc in width. The radio spectrum of the threads is steep, with a spectral index of up to between 1000 and 1400 MHz.
Key Words.:
radio continuum: galaxies1 Introduction
Radio galaxies residing in galaxy clusters exhibit a wide range of distorted morphologies (see Garon et al., 2019 for an overview). Some of these distortions are seen in the form of head tails, which are elongated radio sources with the galaxy at one end (Ryle & Windram, 1968, Sebastian et al., 2017), and wide-angle tails, where the jets form a ‘C’ shape (Owen & Rudnick, 1976, Leahy, 1993, Missaglia et al., 2019). Such radio morphologies are due to the interaction between the radio lobes and/or jets and the intra-cluster medium (ICM; Pinkney, 1995, Sakelliou & Merrifield, 2000). This makes radio galaxies important probes of the distribution of pressure, turbulence, and shocks within the magneto-ionic ICM (Owen et al., 2014, Feretti et al., 2012), and also means that their detection is an efficient way to identify high-z clusters independent of dust extinction.
In this letter we discuss the case of ESO 137-006, a radio galaxy in the Norma galaxy cluster (Abell 3627; Abell et al., 1989). Norma is located at a distance of Mpc ( = 0.0162; Woudt et al., 2008) at the crossing between several filaments in the Great Attractor region (Dressler et al., 1987). With a dynamical mass of , Norma is characterised by numerous substructures and exhibits an elongated X-ray morphology, implying that it is not yet in dynamical equilibrium (Boehringer et al., 1996, Woudt et al., 2008).
ESO 137-006 (RAJ2000 = 16:15:03.8, DecJ2000 = 60:54:26) is one of the most luminous galaxies in the Norma cluster and lies near the peak of the X-ray emission. It is one of the brightest radio galaxies in the southern sky (L W Hz-1; Sun 2009). Observations at 408 MHz (Schilizzi & McAdam, 1975), 843 MHz (Mauch et al., 2003), and 1400 MHz (Christiansen et al., 1977; Jones & McAdam, 1996) show that it has a wide-angle tail morphology. The bending of its radio lobes is thought to be caused by the galaxy infall towards the main cluster (Jones & McAdam, 1996; Sakelliou & Merrifield, 2000). In this letter we present new radio continuum images of ESO 137-006 at 1000 MHz and 1400 MHz based on MeerKAT observations, which reveal hitherto unseen collimated synchrotron threads (CSTs) between its radio lobes.
Throughout this paper we assume a cold dark matter cosmology with and and a Hubble constant of H0 = 70 km s-1 Mpc-1 . At the distance of ESO 137-006, 1′′ corresponds to 0.33 kpc.
2 MeerKAT observations and data reduction
We observed the Norma cluster at radio frequencies with MeerKAT (Jonas & MeerKAT Team, 2016; Mauch et al., 2019) in May 2019 (project ID SCI-20190418-SM-01). The observations were conducted with all 64 MeerKAT antennas in L-band (856 – 1712 MHz) using the 4k mode of the SKARAB correlator, which samples the observed band with 4096 channels, each of 209 kHz in width, in full polarisation. The total integration time is 14 hours on target.
We reduced the data in two frequency intervals largely free of radio-frequency interference: 980-1080 MHz and 1356-1440 MHz (hereafter referred to as 1030 MHz and 1398 MHz, respectively). The data reduction was conducted independently in the two intervals using the caracal pipeline currently under development111https://caracal.readthedocs.io. The pipeline is built using stimela222https://github.com/SpheMakh/Stimela (Makhathini, 2018), a radio interferometry scripting framework based on Python and container technologies. stimela allows users to run several open-source radio interferometry software packages in the same script. Using this pipeline, we flagged the calibrator data based on the Stokes Q visibilities with AOFlagger (Offringa et al., 2010). We determined the complex flux, bandpass, and gains using the casa (McMullin et al., 2007) tasks bandpass and gaincal, and applied the calibration to the visibilities of the target with the casa task mstransform. The calibrated target visibilities were flagged with AOFlagger, again based on Stokes Q. We then iteratively imaged the radio continuum emission with WSclean (Offringa et al., 2014) in Stokes I using multi-scale cleaning (Offringa & Smirnov, 2017), and self-calibrated the gain phase with cubical (Kenyon et al., 2018) with a solution interval of 128 seconds. The imaging was done using Briggs robust value 0 and cleaning down to 0.5 within a clean mask made with sofia (Serra et al., 2015). Finally, we generated MeerKAT primary beam images at the mean frequency of the two processed bands using eidos (Asad et al., 2019), and created primary beam-corrected continuum images of the target.
The resulting 1030 MHz image has a restoring beam of FWHM with PA = , and rms noise level 30.8 Jy beam-1. The 1398 MHz image has a restoring beam of FWHM with PA = , and rms noise level 20.8 Jy beam-1.
3 ESO 137-006 as seen by MeerKAT
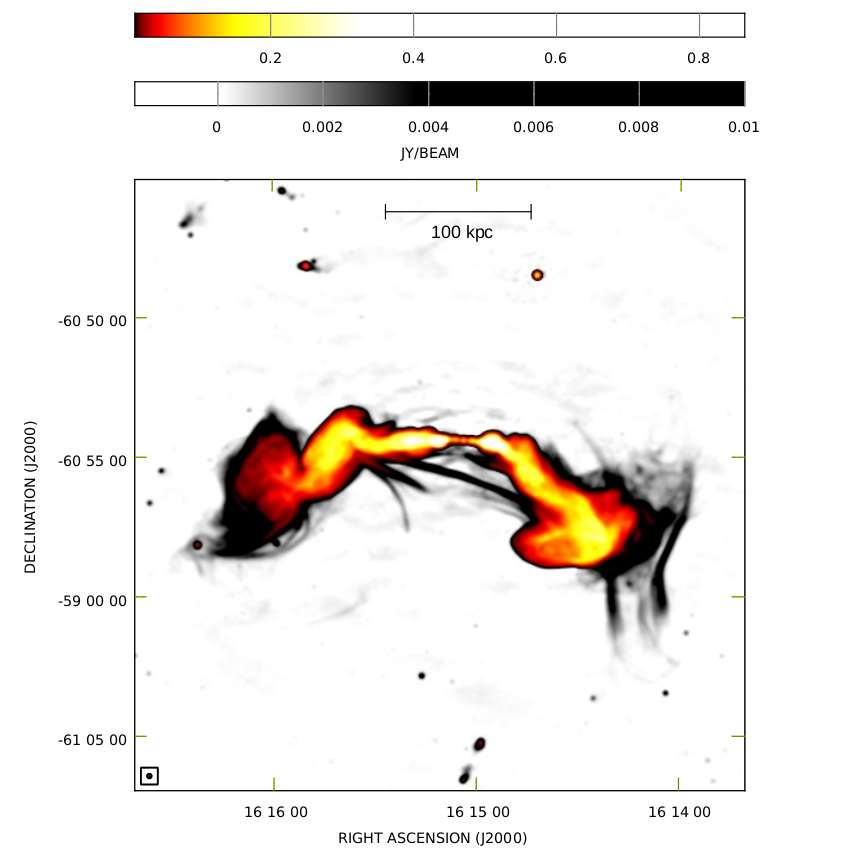
Figure 1 shows the 1030 MHz MeerKAT image of ESO 137-006. Emission shown in red to yellow is known from previous, shallower observations obtained with other telescopes (see Sec. 1). Emission shown in grey scale is revealed here for the first time due to the increased sensitivity and resolution of the MeerKAT data. A number of new features are now apparent.
Similar to earlier observations, we detect a point source corresponding to the galaxy ESO 137-006 (Jones & McAdam, 1996). At the resolution of our images this source has a flux density of 140 mJy at 1030 MHz and 167 mJy at 1398 MHz. The source is also seen in X-rays (see Fig. 3) and is thought to be the core of ESO 137-006 (e.g., Jones & McAdam 1996). Narrow jets start from the core along an east–west axis and form two broad, bright spots ′ from it. Their peak flux densities are on average 8 Jy beam-1 at 1030 MHz and 18 Jy beam-1 at 1398 MHz. Jones & McAdam (1996) suggested that the brightening and expansion of the jets into these bright spots is due to the decreased ISM pressure. The general structure of these bright spots (see also Fig. 2) is similar to that seen in the hydrodynamical simulations of jets in the FR I radio galaxy 3C 31, where the jets recollimated at 1.5 kpc from the galaxy core due to the decreased pressure relative to the ISM after their initial expansion (Perucho & Martí, 2007).
Further out, the jets flare into the lobes and then fade into diffuse emission. On both sides, the radio emission bends southwards; in the western lobe the bending occurs right after the bright spot while in the eastern lobe it occurs further out.
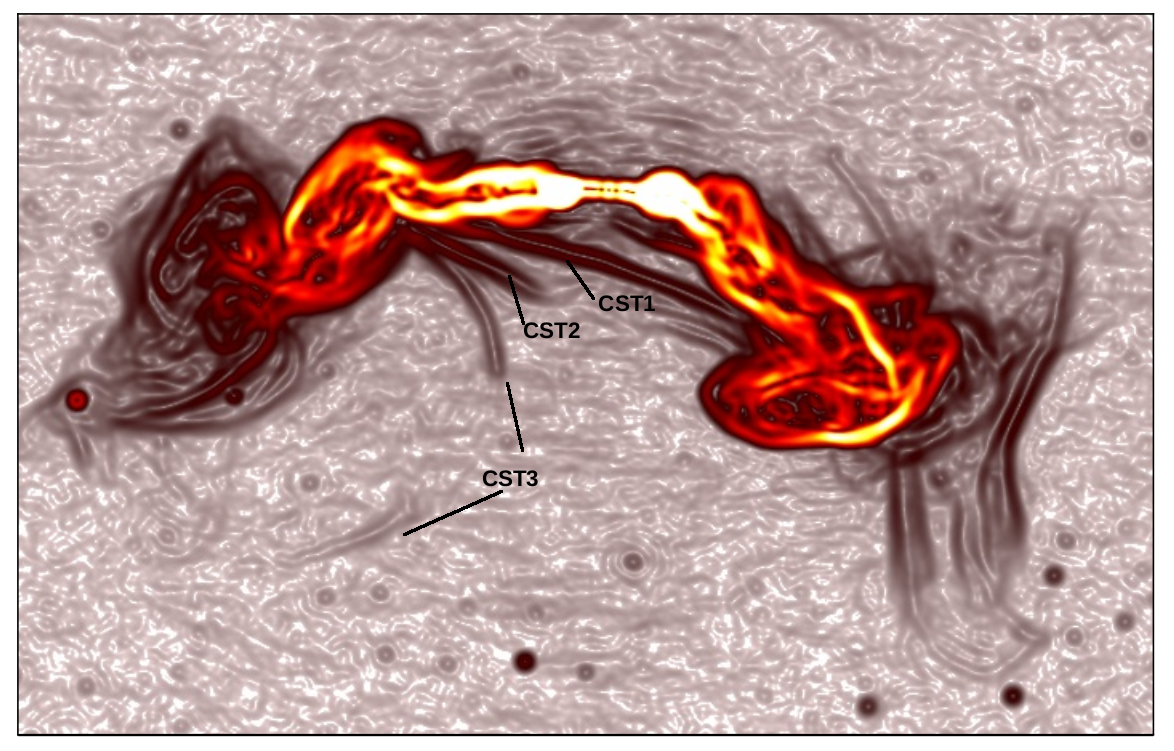
Besides the previously known features described immediately above, Fig. 1 shows additional, low-surface-brightness radio emission at the edge of both lobes and, most strikingly, a number of CSTs in the region south of the core. These extend from the lobes southward of the core. Figure 2 shows the gradient image obtained with a Sobel convolution kernel that highlights the presence of three threads: CST1, CST2, and CST3. These threads are reminiscent of twin jets originating from two nuclei associated with radio source 3C 75 (Owen et al., 1985), except for the fact that in the case of ESO 137-006 only one nucleus is seen. Figure 1 also shows a diffuse loop of emission which starts at the base of CST3, extends around the eastern lobe on the south side, and connects back to the lobe on its easternmost side where it fades into diffuse emission. The origin of these features is not known. It is possible that these loops and CSTs are the result of some electromagnetic effect like parallel magnetic field lines within the ICM dragging particles between the lobes as the galaxy moves north, perhaps similar to the description by Heyvaerts & Norman (1989).
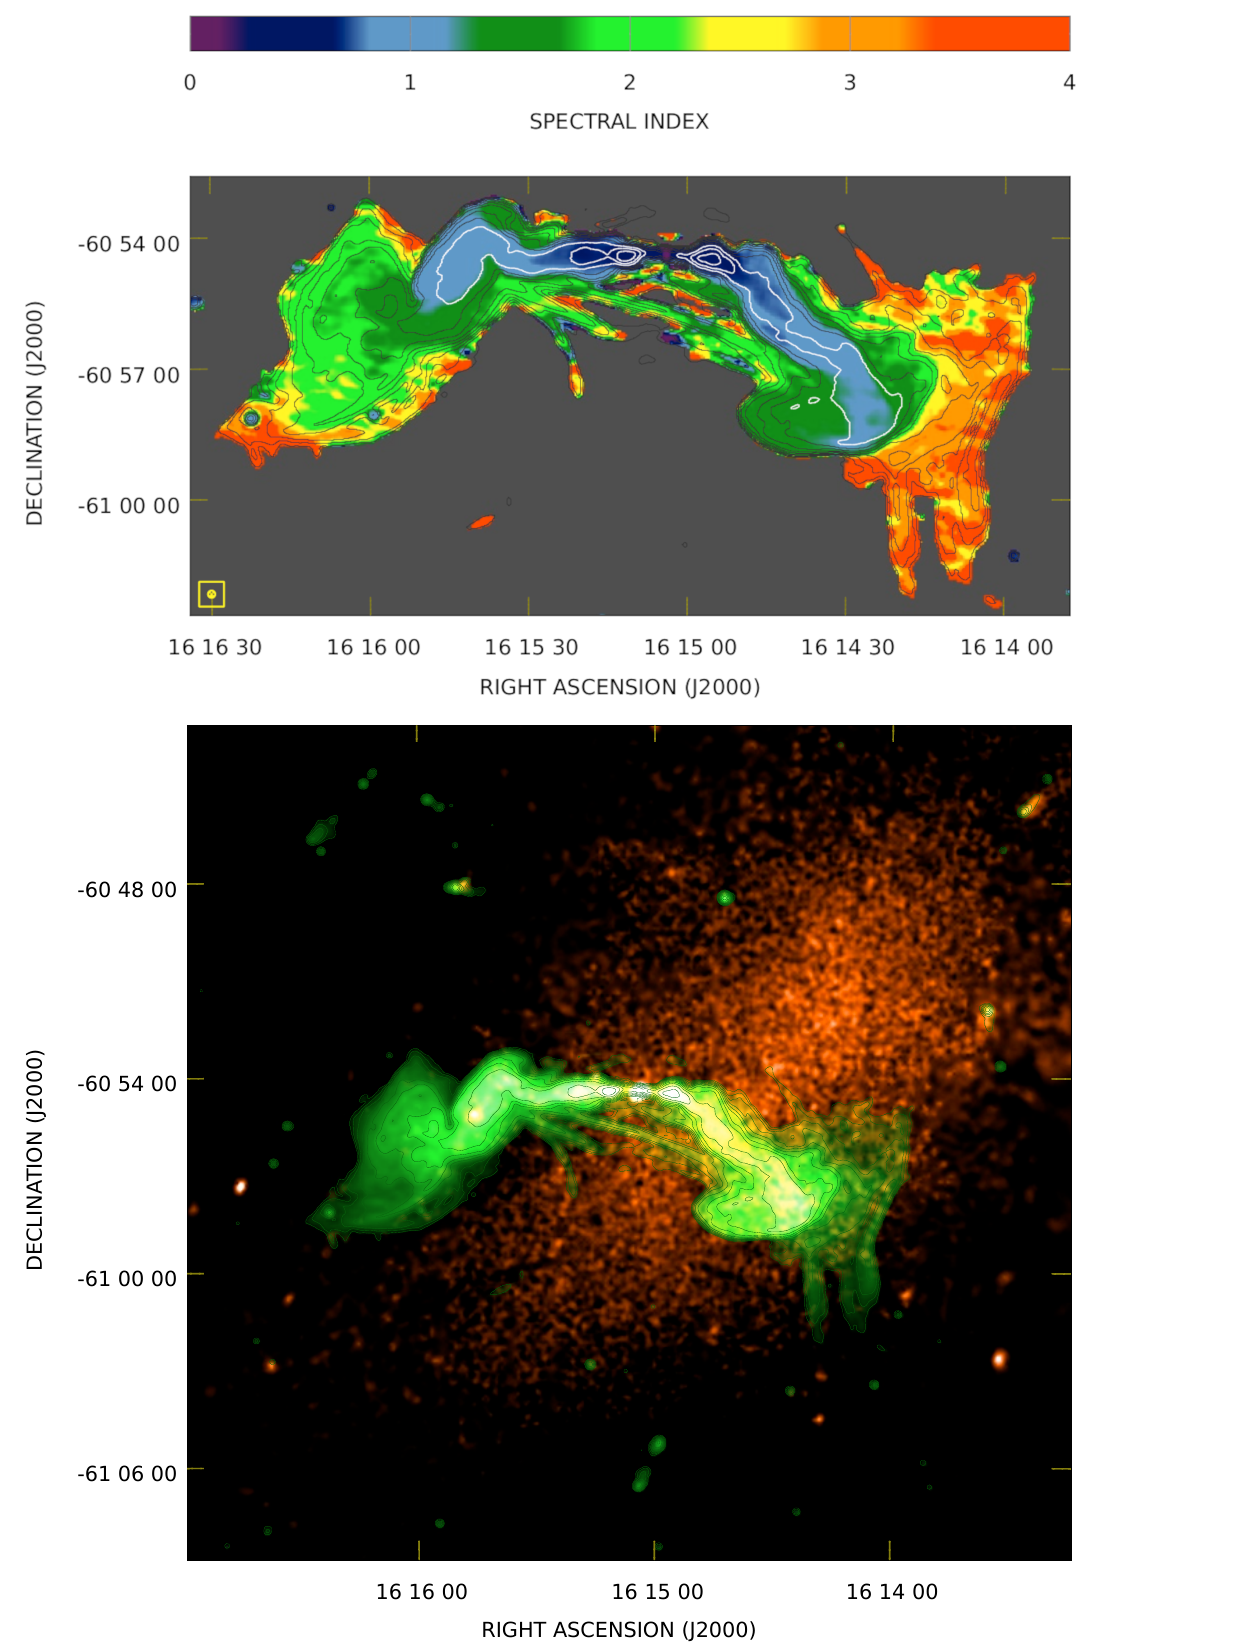
The spectral index image () of ESO 137-006 between 1030 and 1398 MHz is presented in the top panel of Fig. 3. We find a spectral index distribution typical of an active wide-angle tail radio source. The radio core has a flat spectral index while the inner and brighter parts of the jets have . There is a steepening in the radio spectrum going from the radio lobes down to the tails where we measure a spectral index as high as . The spatial variation of the spectral index in the eastern lobe is more gradual than in the western lobe, where a sharp transition, likely due to projection effects, is observed between the edge of the lobe and the underlying tail emission. The newly discovered CSTs are characterised by a steep radio spectrum with .
In the bottom panel of Fig. 3 we present the MeerKAT image at 1030 MHz superimposed on the X-ray emission map from XMM-Newton at 0.5 - 2 keV. The most relevant feature seen in the X-ray image is a point-like source associated with the radio core and a hint of cavities corresponding to the radio lobes, although no evidence for cavities associated with this source is present in the literature (Shin et al., 2016). At the sensitivity limit of the XMM image, there are no X-ray features that we can associate with these CSTs.
4 Basic properties of CST1
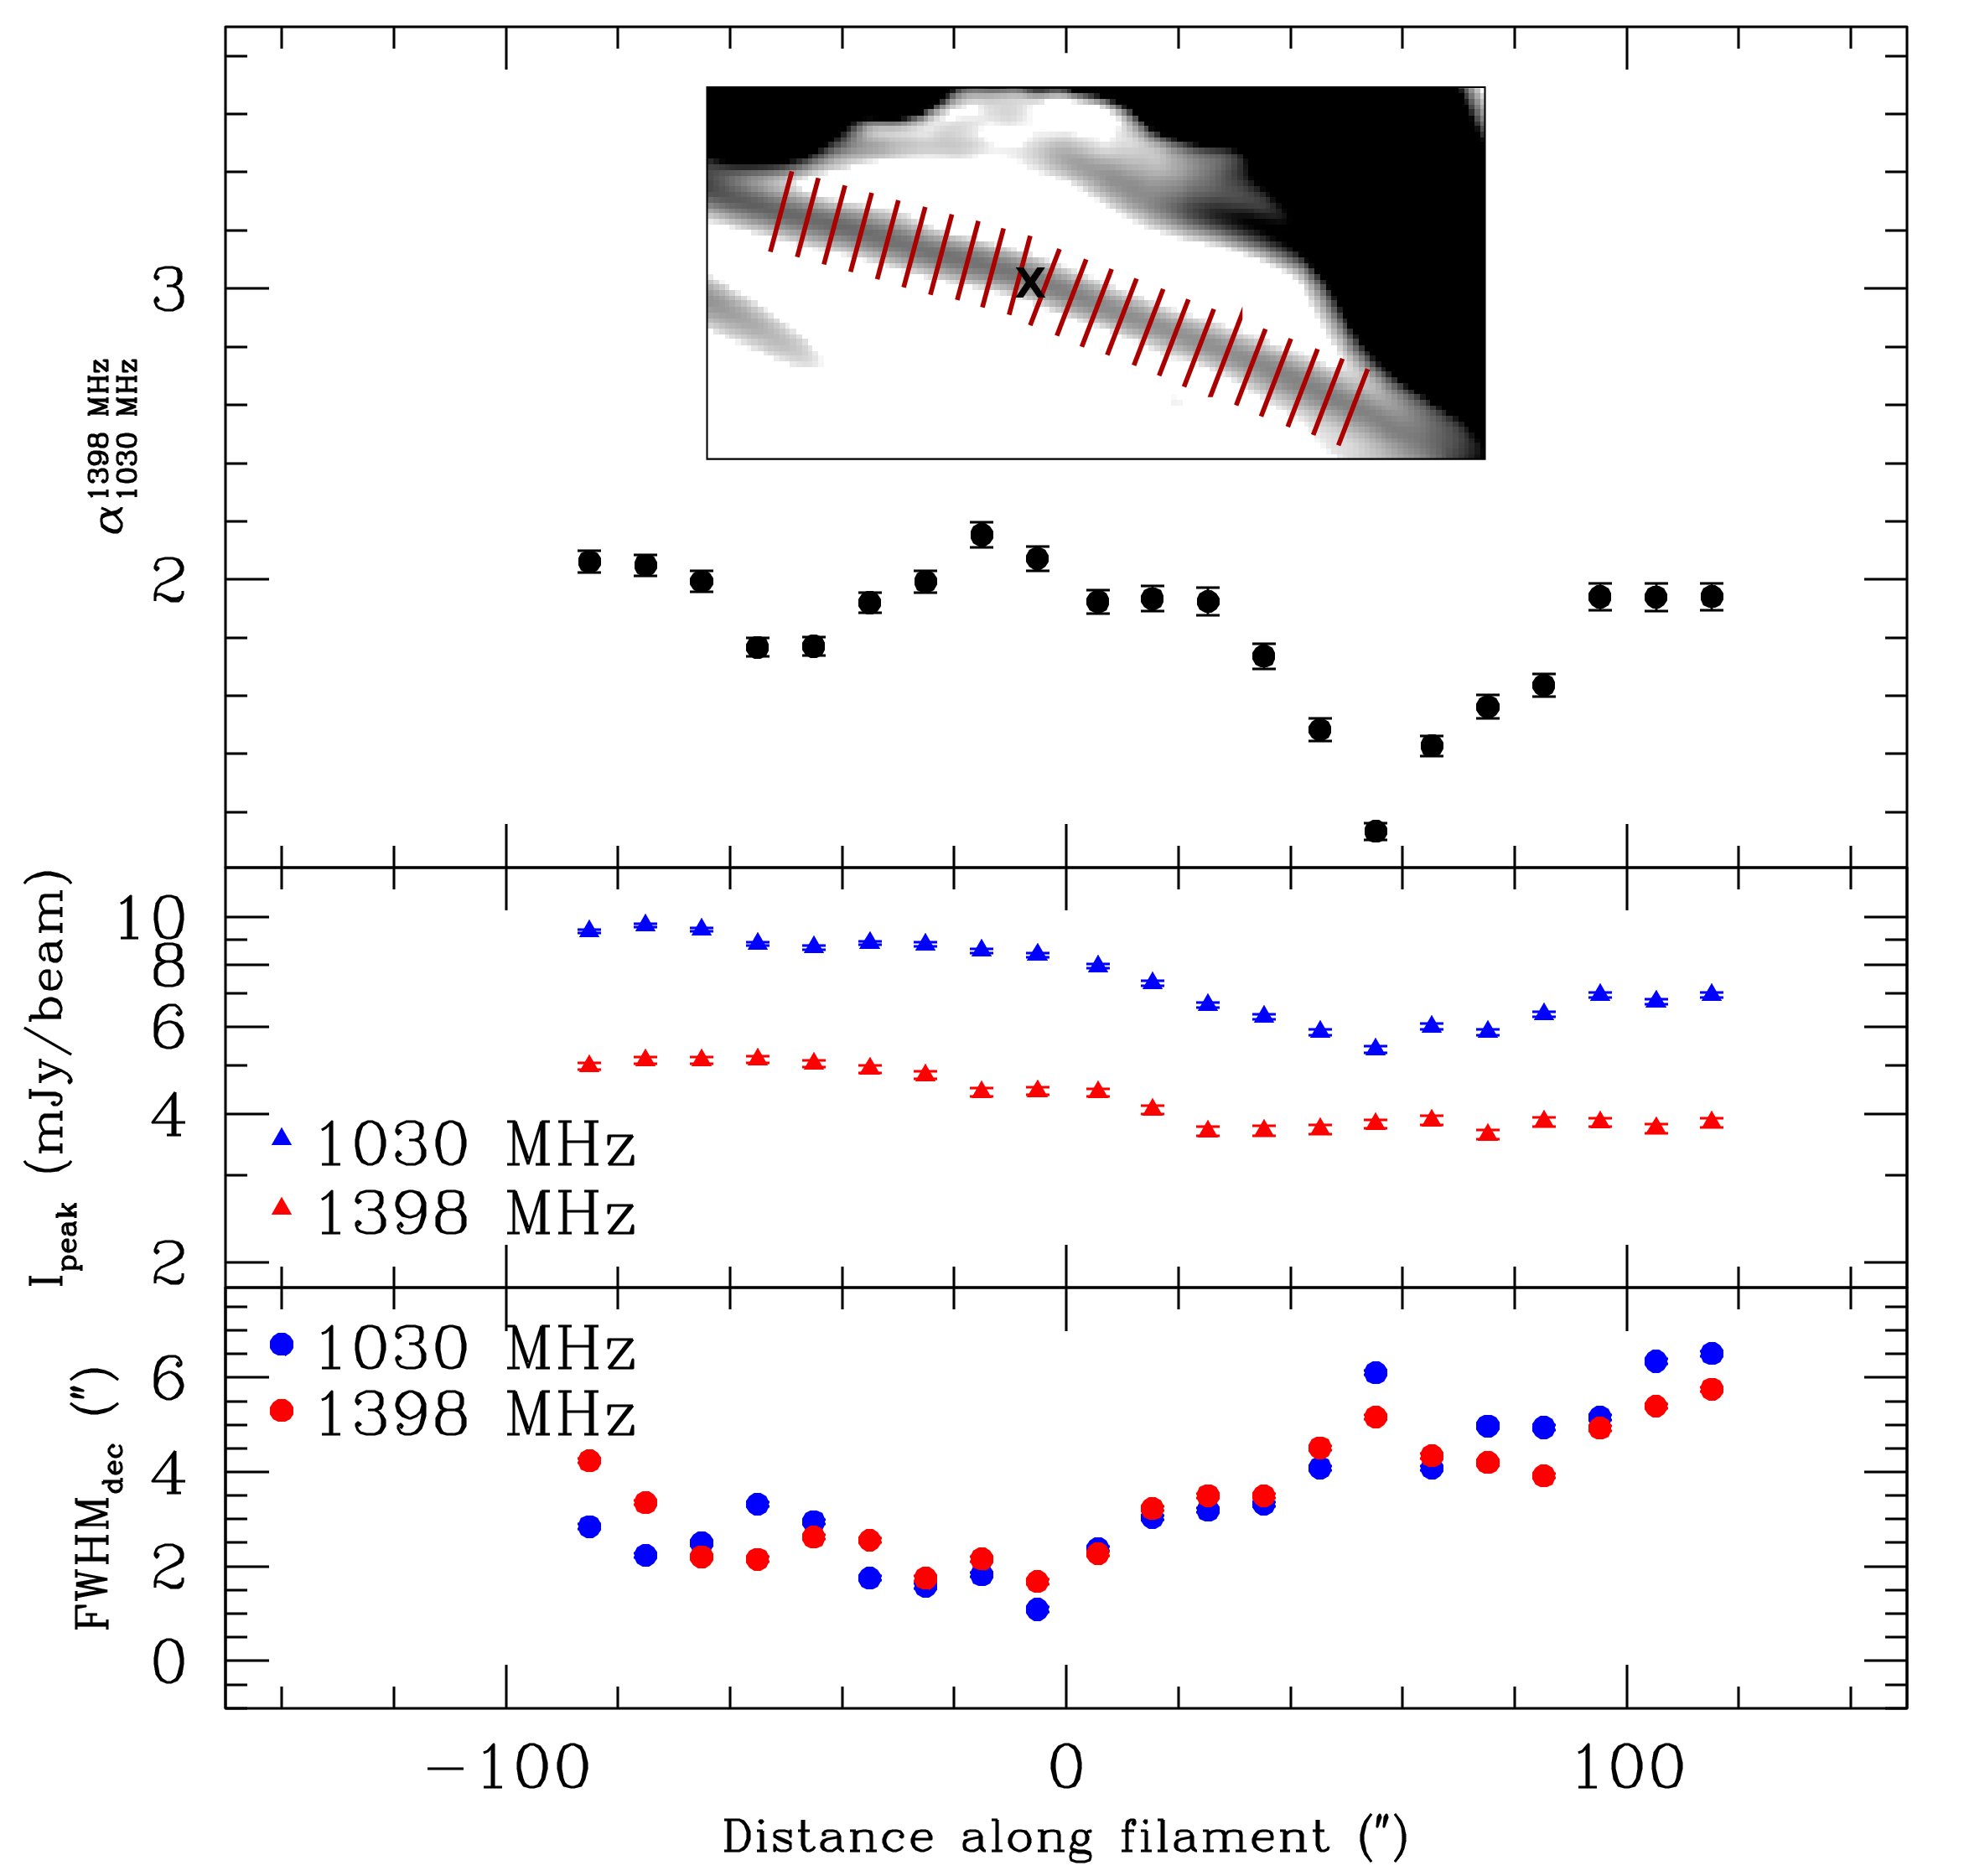
Figure 4 shows the deconvolved full width half maximum () and the peak brightness () as a function of position along CST1 at 1030 and 1398 MHz, as well as the spectral index (). We measure these quantities at the positions shown by the red bars in the inset. The cross in the inset corresponds to the origin of the plot’s horizontal axis. Errors were computed using a Monte Carlo simulation with input parameters sampled and noised in the same way as for the real data. The errors represent the scatter of the input versus output best-fit parameters. The mean values of the peak brightness are respectively and , and the average spectral index , consistent with the values shown in Fig. 3.
The peak brightness shows a similar profile at both frequencies, with a valley at at 1030 MHz only, which corresponds to a depression in the spectral index profile. At the same location, a rapid local increase of the deconvolved FWHM can be observed at both frequencies. The mean width of CST1 is and . The two profiles do not show any dependence on frequency but are rather characterised by a similar average trend along the full extension of the filament, consistent within the scatter. This projected width translates into kpc, or % of its 80 kpc length.
5 Discussion and summary
In this letter we present new MeerKAT images of the radio source ESO 137-006 at 1000 and 1400 MHz. The galaxy lies at the centre of the merging Norma cluster near the Great Attractor. Here we summarise our main findings:
-
•
With these sensitive MeerKAT observations, new features have been revealed in the form of multiple collimated synchrotron threads (CSTs) connecting the lobes of the radio galaxy. It is worth noting that examples of filamentary structures associated with radio galaxies are well known in the literature. However, these filaments are usually observed inside the radio lobes (see e.g. the notable cases of Fornax A and Cygnus A; Maccagni et al., 2020, Perley et al., 1984) and the tails of radio galaxies (e.g., NGC 1265, 3C 129, and NGC 326; Sijbring & de Bruyn, 1998, Lane et al., 2002, Hardcastle et al., 2019). The CSTs detected in ESO 137-006 are different in that they are observed outside the main body of the radio galaxy and connecting (at least in projection) the two radio lobes. The radio galaxy 3C 338 (Burns et al., 1983) at the centre of Abell 2199 presents a single filament that is reminiscent of one of the CSTs observed in ESO 137-006. However, while the filament in 3C 338 could be a relic jet from a past epoch of activity, this same interpretation does not hold for ESO 137-006 where we observe multiple close-by threads formed at the same time (as suggested by their similar spectral-index distributions).
-
•
The most prominent and straight of the CST in ESO 137-006 (CST 1) has a characteristic width of kpc (deconvolved FWHM), roughly 2% of its length, and has a relatively smooth brightness profile with a peak intensity of a few mJy/beam at the 10′′ resolution of our images. The other two CSTs originate from the same point in the eastern lobe. CST 2 starts straight and then fades rapidly after kpc from the lobe. CST 3 seems to follow a faint, closed loop with a radius of kpc, which reconnects with the lobe at its far end. The nature of these unusual features is unclear. We speculate that they could be due to the interaction of the magnetic fields of the radio lobes with the magneto-ionic ICM, or caused by some sort of re-connection of filaments associated with the tails back into the radio lobes. Further observations and theoretical efforts are required to clarify the nature of these newly discovered features.
-
•
The spectral index distribution observed across the jets, lobes, and tails is typical of an active radio source. The radio spectrum of the CST is steep with . Due to this steep spectrum, deep low-frequency observations at high resolution with instruments such as the LOw Frequency ARray could play a role in the study of CSTs.
-
•
Whatever their origin, our findings pose the following questions: How common are these features? Are CSTs specific to the case of ESO 137-006 and its environment, perhaps due to the kinematics and pressure gradient of this ICM and relative motion of the galaxy in the cluster? Or, on the contrary, are CSTs common in radio galaxies but have so far not been detected due to sensitivity and resolution limits? If future observations confirm the latter hypothesis, understanding the nature and the physics of these features could open a new science case for the next generation of sensitive radio interferometers like the Square Kilometre Array.
Acknowledgements.
We thank the referee, Manel Perucho for the useful comments and suggestions. The authors also wish to thank Ming Sun for helping with the access to some of the X-ray data. This project has received funding from the European Research Council (ERC) under the European Union’s Horizon 2020 research and innovation programme grant agreement no. 679627 project name FORNAX. MR acknowledges support from the Italian Ministry of Foreign Affairs and International Cooperation (MAECI Grant Number ZA18GR02) and the South African Department of Science and Technology’s National Research Foundation (DST-NRF Grant Number 113121) as part of the ISARP RADIOSKY2020 Joint Research Scheme. This paper makes use of the MeerKAT data (Project ID: SCI-20190418-SM-01). The MeerKAT telescope is operated by the South African Radio Astronomy Observatory, which is a facility of the National Research Foundation, an agency of the Department of Science and Innovation. MR and SM’s research is supported by the SARAO HCD programme via the ”New Scientific Frontiers with Precision Radio Interferometry” research group grant. This work is based upon research supported by the South African Research Chairs Initiative of the Department of Science and Technology and National Research Foundation. (Part of) the data published here have been reduced using the CARAcal pipeline, partially supported by BMBF project 05A17PC2 for D-MeerKAT. Information about CARAcal can be obtained online under the https://caracal.readthedocs.io/en/latest/.References
- Abell et al. (1989) Abell, G. O., Corwin, Jr., H. G., & Olowin, R. P. 1989, ApJS , 70, 1
- Asad et al. (2019) Asad, K. M. B., Girard, J. N., de Villers, M., et al. 2019, arXiv e-prints, arXiv:1904.07155
- Boehringer et al. (1996) Boehringer, H., Neumann, D. M., Schindler, S., & Kraan-Korteweg, R. C. 1996, ApJ , 467, 168
- Burns et al. (1983) Burns, J. O., Schwendeman, E., & White, R. A. 1983, ApJ , 271, 575
- Christiansen et al. (1977) Christiansen, W. N., Frater, R. H., Watkinson, A., et al. 1977, MNRAS , 181, 183
- Dressler et al. (1987) Dressler, A., Faber, S. M., Burstein, D., et al. 1987, ApJL , 313, L37
- Feretti et al. (2012) Feretti, L., Giovannini, G., Govoni, F., & Murgia, M. 2012, A&A Rev., 20, 54
- Garon et al. (2019) Garon, A. F., Rudnick, L., Wong, O. I., et al. 2019, AJ , 157, 126
- Hardcastle et al. (2019) Hardcastle, M. J., Croston, J. H., Shimwell, T. W., et al. 2019, MNRAS , 488, 3416
- Heyvaerts & Norman (1989) Heyvaerts, J. & Norman, C. 1989, ApJ , 347, 1055
- Jonas & MeerKAT Team (2016) Jonas, J. & MeerKAT Team. 2016, in MeerKAT Science: On the Pathway to the SKA, 1
- Jones & McAdam (1996) Jones, P. A. & McAdam, W. B. 1996, MNRAS , 282, 137
- Kenyon et al. (2018) Kenyon, J. S., Smirnov, O. M., Grobler, T. L., & Perkins, S. J. 2018, MNRAS , 478, 2399
- Lane et al. (2002) Lane, W. M., Kassim, N. E., Ensslin, T. A., Harris, D. E., & Perley, R. A. 2002, AJ , 123, 2985
- Leahy (1993) Leahy, J. P. 1993, DRAGNs, ed. H.-J. Röser & K. Meisenheimer, Vol. 421, 1
- Maccagni et al. (2020) Maccagni, F. M., Murgia, M., Serra, P., et al. 2020, A&A, 634, A9
- Makhathini (2018) Makhathini, S. 2018, PhD thesis, Rhodes University, Drosty Rd, Grahamstown, 6139, Eastern Cape, South Africa, available via http://hdl.handle.net/10962/57348
- Mauch et al. (2019) Mauch, T., Cotton, W. D., Condon, J. J., et al. 2019, arXiv e-prints, arXiv:1912.06212
- Mauch et al. (2003) Mauch, T., Murphy, T., Buttery, H. J., et al. 2003, MNRAS , 342, 1117
- McMullin et al. (2007) McMullin, J. P., Waters, B., Schiebel, D., Young, W., & Golap, K. 2007, in Astronomical Society of the Pacific Conference Series, Vol. 376, Astronomical Data Analysis Software and Systems XVI, ed. R. A. Shaw, F. Hill, & D. J. Bell, 127
- Missaglia et al. (2019) Missaglia, V., Massaro, F., Capetti, A., et al. 2019, A&A, 626, A8
- Offringa et al. (2010) Offringa, A. R., de Bruyn, A. G., Biehl, M., et al. 2010, MNRAS , 405, 155
- Offringa et al. (2014) Offringa, A. R., McKinley, B., Hurley-Walker, N., et al. 2014, MNRAS , 444, 606
- Offringa & Smirnov (2017) Offringa, A. R. & Smirnov, O. 2017, MNRAS , 471, 301
- Owen et al. (1985) Owen, F. N., O’Dea, C. P., Inoue, M., & Eilek, J. A. 1985, ApJL , 294, L85
- Owen & Rudnick (1976) Owen, F. N. & Rudnick, L. 1976, ApJL , 205, L1
- Owen et al. (2014) Owen, F. N., Rudnick, L., Eilek, J., et al. 2014, ApJ , 794, 24
- Perley et al. (1984) Perley, R. A., Dreher, J. W., & Cowan, J. J. 1984, ApJL , 285, L35
- Perucho & Martí (2007) Perucho, M. & Martí, J. M. 2007, MNRAS , 382, 526
- Pinkney (1995) Pinkney, J. 1995, PhD thesis, NEW MEXICO STATE UNIVERSITY.
- Ryle & Windram (1968) Ryle, M. & Windram, M. D. 1968, MNRAS , 138, 1
- Sakelliou & Merrifield (2000) Sakelliou, I. & Merrifield, M. R. 2000, MNRAS , 311, 649
- Schilizzi & McAdam (1975) Schilizzi, R. T. & McAdam, W. B. 1975, MmRAS, 79, 1
- Sebastian et al. (2017) Sebastian, B., Lal, D. V., & Pramesh Rao, A. 2017, AJ , 154, 169
- Serra et al. (2015) Serra, P., Westmeier, T., Giese, N., et al. 2015, MNRAS , 448, 1922
- Shin et al. (2016) Shin, J., Woo, J.-H., & Mulchaey, J. S. 2016, ApJS , 227, 31
- Sijbring & de Bruyn (1998) Sijbring, D. & de Bruyn, A. G. 1998, A&A, 331, 901
- Sun (2009) Sun, M. 2009, ApJ , 704, 1586
- Woudt et al. (2008) Woudt, P. A., Kraan-Korteweg, R. C., Lucey, J., Fairall, A. P., & Moore, S. A. W. 2008, MNRAS , 383, 445