Determination of of potential blazar candidates among EGRET unidentified gamma-ray sources
Abstract
Blazars are radio-loud Active Galactic Nuclei (AGN) with relativistic jets oriented towards the observer’s line-of-sight. Based on their optical spectra, blazars may be classified as flat-spectrum radio quasars (FSRQs) or BL Lacs. FSRQs are more luminous blazars with both narrow and broad emission and absorption lines, while BL Lacs are less luminous and featureless. Recent studies show that blazars dominate ( %) the already-identified EGRET sources (142), suggesting that among the unidentified sources (129) there could still be faint blazars. Due to the presence of a strong non-thermal component inside their jets, blazars are found to display a weaker depression at Å (). In this study, we aimed at determining the break for a selected sample among the potential blazar candidates from unidentified EGRET sources to confirm their blazar nature. We used two blazar candidates, 3EG J1800-0146 and 3EG J1709-0817 associated with radio counterparts, J1802-0207 and J1713-0817, respectively. Their optical counterparts were obtained through spectroscopic observations using Robert Stobie spectrograph (RSS) at the Southern African Large Telescope (SALT) in South Africa. The observed Ca II H K lines depression at Å in spectra of these sources show a shallow depression, and , respectively, suggesting that these sources are blazar candidates. Moreover, the redshifts and measured in their spectra confirm the extragalactic nature of these sources.
keywords:
line: identification, – radiation mechanisms: non-thermal, – techniques: spectroscopic, – galaxies: active, – galaxies: jets, – galaxies: BL Lacertae objects.S. H. Negu, & S. B. Tessema, eds.
1 Introduction
Different studies reveal that out of 271 sources detected by the Energetic Gamma-Ray Experiment Telescope (EGRET) during its mission, sources were identified and % of them were associated with blazars (e.g., [Hartman et al. (1999), Hartman et al. 1999]; [Sowards-Emmerd et al. (2003), Sowards-Emmerd et al. 2003]; [NkundabakuraMeintjes12, Nkundabakura & Meintjes 2012]). It is assumed that among 129 ( %) remaining unidentified EGRET sources, there could be still faint blazars in abundance. There have been efforts to try to identify blazars from the unidentified EGRET sources via their variability and spectral energy distribution (SED). This study joined this effort and aimed at determining the extent of non-thermal emissions from two potential blazar candidates selected among the remaining unidentified EGRET sources through the analysis of the strength of their Ca II H K break at 4000 Å (). Blazars are a special class of AGN with a weaker Ca II contrast, i.e., ([Marcha et al. (1996), Marcha et al. 1996]; [Caccianiga et al. (1999), Caccianiga et al. 1999]; [Landt et al. (2002), Landt et al. 2002]), due to the contribution of the nuclear non-thermal component produced inside their jets, i.e., for blazars, this Ca II H K break decreases as the non-thermal emission from jet increases and vice-versa. In fact, observations in optical, radio and X-rays show that the increase in the jet’s luminosity leads to the decrease in the Ca II H K break ([Landt et al. (2002), Landt et al. 2002]).
2 Data source and methods
The study used two blazar candidates (3EG J1800-0146 and 3EG J1709-0817) from a sample of 13 blazar candidates selected from [NkundabakuraMeintjes12, Nkundabakura & Meintjes (2012)] which were selected from the 3EG catalogue. The spectroscopic raw data were obtained at the Southern African Large Telescope (SALT) with RSS spectrograph. The raw data of the two sources were reduced using the Image Reduction and Analysis Facility (IRAF) data reduction pipeline. The presence of nuclear non-thermal component in the host galaxy of each source was confirmed by measuring the in the rest frame. For each spectrum, the contrast was calculated using the relation:
| (1) |
where and are average fluxes within 3750 Å –3950 Å and 4050 Å–4250 Å , respectively, in rest frame ([Caccianiga et al. (1999), Caccianiga et al. 1999]; [Landt et al. (2002), Landt et al. 2002]). The fluxes measured in each spectrum are shown in Table 2.
3 The spectra of 3EG J1800-0146 and 3EG J1709-0817
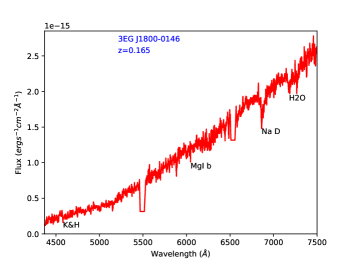
Figure 1 (left panel) represents the optical spectrum of 3EG J1800-0146. The spectrum features some absorption lines at redshift , e.g., Ca II H & K 3969 Å, 3934 Å , Mg I b 5169, 5175, 5184 Å and Na D 5890, 5896 Å in the rest frame. absorption (7168 – 7394 Å) from the Earth’s atmosphere, not redshifted has been detected in this source. The line centre, continuum, flux and the equivalent width () shown in Table 1 were measured using SPLOT command in IRAF.
| Absorption line | Line centre | Continuum | Flux | |
|---|---|---|---|---|
| (Å) | () | (erg ) | (Å) | |
| 3EG J1800-0146 | ||||
| Ca II K | 4580.18 | 2.55 | 4.95 | 1.93 |
| Ca II H | 4625.53 | 2.30 | 8.00 | 0.34 |
| Mg I b | 6046.36 | 1.25 | 8.25 | 0.65 |
| Na D | 6863.19 | 1.81 | 3.25 | 1.79 |
| 3EG J1709-0817 | ||||
| Ca II K | 4973.92 | 3.483 | 6.95 | 1.996 |
| Ca II H | 4997.05 | 3.472 | 6.69 | 1.927 |
| Fe d | 5882.79 | 8.13 | 2.03 | 2.49 |
|
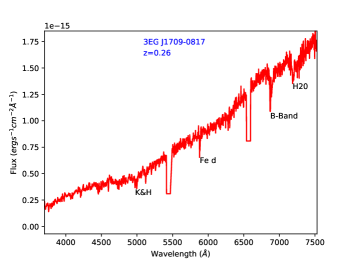
It shows a shallow depression (), suggesting the presence of a strong non-thermal emission in this source, emanating from a jet oriented at a small angle. The spectrum of this source resembles that of a BL Lac ([Marcha et al. (1996), Marcha et al. 1996]; [Landt et al. (2002), Landt et al. 2002]). On the other hand, Figure 1 (right panel) shows the spectrum of 3EG J1709-0817. It features some absorption lines at redshift , e.g., Ca II H & K 3969 Å, 3934 Å and Fe d at 4668 Å in the rest frame (Table 1). The telluric absorption lines resulting from Earth’s atmosphere, not redshifted have been identified in this object, e.g., (7168 – 7394 Å), and B-Band (6867 – 6884 Å). The spectrum displays a shallow depression, . This is within the range of of typical BL Lac candidates ([Marcha et al. (1996), Marcha et al. 1996]). In Table 2, we present the average fluxes, and used for the measurement of in the two spectra.
| Object | Ca band | Ca band | z | Flux | Class by | ||
|---|---|---|---|---|---|---|---|
| (Å, rest frame) | (Å, redshifted) | (erg ) | |||||
| 3EG J1800-0146 | 3750 – 3950 | 4368.75 – 4601.75 | 0.165 | ||||
| 4050 – 4250 | 4718.25 – 4951.25 | 0.3460.02 | BL Lac | ||||
| 3EG J1709-0817 | 3750 – 3950 | 4725 – 4977 | 0.26 | ||||
| 4050 – 4250 | 5103 – 5355 | 0.2420.01 | BL Lac |
4 Conclusions
From our spectroscopic data, we confirmed 3EG J1800-0146 and 3EG J1709-0817 as extragalactic objects with redshift and 0.26, respectively, and as BL Lacs through the strength of their contrast.
References
- [Caccianiga et al. (1999)] Caccianiga, A., Maccacaro, T., Wolter, et al., 1999, ApJ, 513, 51
- [Hartman et al. (1999)] Hartman, C., Bertsch, L., Bloom, et al., 1999, ApJS, 123, 79
- [Landt et al. (2002)] Landt, H., Padovani, P., Giommi, et al., 2002, MNRAS, 336, 945
- [Marcha et al. (1996)] Marcha, M., Browne, A., Impey, et al., 1996, MNRAS, 281, 425
- [Nkundabakura et al. (2012)] Nkundabakura & P., Meintjes., 2012, MNRAS, 427, 859
- [Sowards-Emmerd et al. (2003)] Sowards-Emmerd, D., Romani, R. W., Michelson, et al., 2003, ApJ, 590, 109