Equation of state and strength of diamond in high pressure ramp loading
Abstract
Diamond is used extensively as a component in high energy density experiments, but existing equation of state (EOS) models do not capture its observed response to dynamic loading. In particular, in contrast with first principles theoretical EOS models, no solid-solid phase changes have been detected, and no general-purpose EOS models match the measured ambient isotherm. We have performed density functional theory (DFT) calculations of the diamond phase to 10 TPa, well beyond its predicted range of thermodynamic stability, and used these results as the basis of a Mie-Grüneisen EOS. We also performed DFT calculations of the elastic moduli, and calibrated an algebraic elasticity model for use in simulations. We then estimated the flow stress of diamond by comparison with the stress-density relation measured experimentally in ramp-loading experiments. The resulting constitutive model allows us to place a constraint on the Taylor-Quinney factor (the fraction of plastic work converted to heat) from the observation that diamond does not melt on ramp compression.
I Introduction
Carbon is of course a key element in astrophysics and for terrestrial life, and has been the subject of inumerable experimental and theoretical studies. Its properties are particularly exotic because of the different forms of interatomic bonding it exhibits. Electronic structure studies have predicted multiple solid phases to occur under compression, as discussed further below. Although graphite is the equilibrium structure at STP, the diamond phase is essentially stable for most purposes. Both of these structures are covalently bonded, but diamond has a remarkably high shear modulus and strength; its flow behavior is not understood.
Diamond components are used widely in high energy density (HED) experiments. It is an efficient choice as the fuel capsule and ablator for inertial confinement fusion (ICF) targets, and is a common choice for the tamper and ablator for high pressure studies of material properties, such as in situ x-ray diffraction experiments Rygg2020 . Diamond is also the material of choice for advanced static compression systems intended to reach at least 1 TPa Dubrovinsky2012 ; Dewaele2018 ; Jenei2018 . The plastic flow behavior at high pressures is important in the design of these devices. Extensive studies have been performed of its high pressure properties, including measurements of its response to ramp loading to 5 TPa Bradley2009 ; Smith2014 , and x-ray diffraction to 2 TPa Lazicki2021 .
Theoretical studies of the phase diagram of C have a long history oldcalcs . Calculations of the graphite phase are relatively challenging using density functional theory (DFT) Hohenberg64 ; Kohn65 ; Perdew92 ; White94 because of the difficulty in capturing the van der Waals forces between adjacent graphene sheets, and most EOS models take diamond as the ambient phase. Using electronic structure calculations resembling current techniques, there has been a series of predictions of pressure-induced transitions out of the diamond structure. Diamond was predicted to transform to the R8 structure around 500 GPa Clark1995 . More recently, in a multiphase EOS also including the liquid phase, diamond was predicted to transform to BC8 around 1 TPa Correa2008 . Quantum molecular dynamics (QMD) simulations were performed to TPa, and compared with shock measurements at Sandia National Laboratories’ Z facility Knudson2008 ; these results were used in the construction of a general-purpose EOS model, sesame 7834 ses7834 . A particularly thorough EOS model has been constructed comprising four solid phases and the liquid Martinez2012 ; Benedict2014 , again with a transition to BC8 around 1 TPa. For the elasticity, electronic structure calculations have been used to calibrate an algebraic model for the variation of the shear modulus of polycrystal diamond to 1.7 TPa Orlikowski2007 , and the variation of the elastic moduli with pressure and temperature to 500 GPa Valdez2012 .
Unfortunately, no current EOS and strength model captures the observed behavior adequately. The clearest indication is that no phase changes have been observed or inferred in samples of carbon (initially diamond) up to 5 TPa. We have found no general purpose EOS model that reproduces measurements of the ambient isotherm Occelli2003 .
As C has not been observed to change from the diamond structure under ramp compression to at least 5 TPa, we perform electronic structure calculations and construct an EOS model for this structure to higher pressures, for use in simulations of experiments in this regime. Previous electronic structure calculations for EOS and elasticity have used a variety of numerical prescriptions and computer programs (Table 1). In the present work, we use a prescription consistent with those we employed for our previous studies, e.g. Swift_Si_2001 ; Swift_NiTi_2005 ; Swift_NiAl_2007 ; Swift_RuRh_2019 . DFT has systematic errors that often make it inappropriate to use directly as an EOS. Our approach is to use DFT to obtain algebraic functions that can be adjusted to improve the accuracy, and then use these functions to construct a model of the EOS and elastic moduli.
II Electronic structure calculations
Energies and stresses used to construct the EOS and elastic moduli were obtained from calculations of the ground state of the electrons with respect to fixed ions, for a series of different values of the lattice parameters. These calculations were performed using non-local pseudopotentials to represent the inner electrons on each atom, and a plane wave expansion to represent the outer electrons, solving the Kohn-Sham DFT equations Hohenberg64 ; Kohn65 ; Perdew92 ; White94 with respect to the Schrödinger Hamiltonian. 111For high-pressure EOS studies, we have generally found that the local density approximation (LDA) to the exchange-correlation functional and higher-order functionals such as the generalized gradient approximation (GGA) produce results of similar accuracy, typically with a similar discrepancy in predicting the mass density at STP, but of opposite sign. LDA requires less computational effort, so we used it in this work. Pulay corrections to the ground state energy and stress were included, although they were small. Exchange-correlation interactions with the pseudopotential core were ignored; as was found previously Benedict2014 , the cold curve at high compressions was found to asymptote to the all-electron atom-in-jellium result, suggesting that these core corrections are not significant. The stress tensor on the lattice cell was obtained from the ground state wavefunctions using the Hellmann-Feynman theorem.
The pseudopotentials used were generated by the Troullier-Martins method Troullier91 with the -shell electrons treated as core and the outer four treated explicitly as valence. The wavefunctions were evaluated at regularly-spaced points in reciprocal space, reduced by the symmetry of the crystal lattice Monkhorst76 . The eight-atom diamond cubic lattice cell was used. A plane-wave cutoff of 900 eV was sufficient to converge the ground states to 1 meV/atom or better.
| XC | -points | software | ||
|---|---|---|---|---|
| (eV) | ||||
| Clark et al Clark1995 | GGA | 4 () | 408 | cetep |
| Orlikowski et al Orlikowski2007 | GGA | 950 | abinit | |
| Correa et al Correa2008 | GGA | 950 | abinit | |
| Knudson et al Knudson2008 | GGA | 500 | vasp | |
| Benedict et al Benedict2014 | GGA | 1300 | vasp | |
| Valdez et al Valdez2012 | LDA | 680 | quantum | |
| espresso | ||||
| This work | LDA | 900 | castep |
III Equation of state
The EOS model was constructed from a cold curve fitted to the electronic structure calculations for the isotropically-compressed diamond cell, with ion-thermal energy obtained from a Debye model Debye1912 in which the variation of the Debye temperature with compression was calculated from the Grüneisen parameter obtained from the cold curve and its derivatives. The EOS model is intended primarily for applications around the principal isentrope, so the electron-thermal energy and the high-temperature reduction in ionic heat capacity to were not included. This approach avoids having to calculate the phonon density of states as we have for other materials Swift_Si_2001 ; Swift_NiAl_2007 , and which is computationally much more intensive. This simplification is justified as, in the solid, the ion-thermal contribution is a relatively small correction to the dominant contribution of the cold curve to the EOS, and in the present work we are not concerned with phase boundaries where small corrections may matter.
We used the Burakovsky-Preston form Burakovsky2004 of the relationship between the Grünseisen parameter and the cold curve,
| (1) |
where is the pressure, the bulk modulus, and its pressure derivative. The ion-thermal EOS has been found to be represented most accurately by a value of which increases from 0 to 2 with compression Burakovsky2004 . We constructed EOS models with and , and found that the latter gave better agreement with the principal shock Hugoniot, and so used the Vashchenko-Zubarev relation Vashchenko1963 (corresponding to ) for subsequent work. This choice is reasonable since the ion-thermal contribution to the principal shock Hugoniot is smaller at lower pressure. For comparison, we also show some results for an EOS model constructed with , corresponding to the Dugdale-MacDonald form Dugdale1953 .
The Grüneisen parameter is the logarithmic derivative of the Debye temperature,
| (2) |
and so the Debye temperature can be expressed as
| (3) |
where
| (4) |
and is some reference density.
In order to perform the further differentiation necessary to calculate and , the cold curve was fitted with analytic functions. Several functions were tried, and a modified version of the Vinet form Vinet1987 was found to fit the cold curve over the widest range:
| (5) |
where
| (6) |
and is a polynomial, here quadratic. The fitting parameters (Table 2) are the coefficients of , , , and . The modifications remove the need for material-specific constants such as the atomic weight, used to calculate the Wigner-Seitz radius, and thus give a more convenient relation for describing arbitrary data, given that the scaling parameter is fitted to reproduce the data in any case. By expressing the cold curve in terms of macroscopic quantities such as mass density, rather than atomic-level quantities such as Wigner-Seitz radius, it also becomes simpler to apply the Vinet model to compounds and mixtures, rather than just elements. In the original Vinet form, is a constant; we found it necessary to generalize it to a low-order polynomial in order to fit the cold curve of diamond C to multi-terapascal pressures.
| (g/cm3) | (MJ/kg) | () | () | (MJ/kg) | |
| 3.64504 | 99.7657 | 0.29836 | -1.41913 | -5.42538 | -1149.17 |
In the present work, we took inferred at STP, and Eq. 3 was used to calculate . With the EOS model constructed in this way, the pressure for the observed STP mass density and temperature was 13.8 GPa. It is desirable to apply a correction in order to bring the STP state into as close agreement as possible with observation. In constructing other EOS, we followed previous work Akbarzadeh1993 that argued that, since the origin of the discrepancy is the inaccuracy of the DFT calculation, it makes sense to correct the latter rather than, for example, scaling the mass density, as has been done for other EOS. Accordingly, we have previously applied a pressure correction, implented as an energy correction linear in specific volume. The problem with this approach is that, in DFT, the pressure correctly asymptotes toward zero as mass density does the same; this limit is violated by the simple pressure correction. Instead, we hypothesize a correction of the form
| (7) |
We took , giving to bring the pressure to the desired STP value.
III.1 High pressure performance
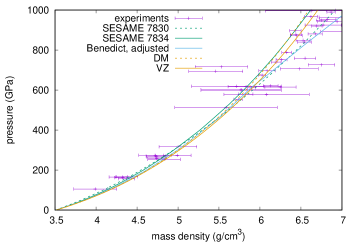
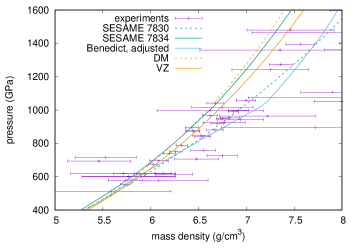
Key thermodynamic loci were constructed from the EOS model, for comparison with experimental data and with other models. We compare with wide-ranging semi-empirical EOS models, and also with the recent, multiphase EOS model Benedict2014 described above. The semi-empirical models were constructed using empirical forms for the cold compression curve and ion-thermal energy, adjusted to reproduce high pressure data as available at the time of construction, blending into Thomas-Fermi theory tf at high temperature and compression. The STP state in the multiphase model had a mass density 3.216 g/cm2, which is significantly lower than the 3.51 g/cm3 observed in diamond. For a more meaningful comparison, this model was adjusted in the same way as described above to give a more accurate STP state; it is referred to below as ‘Benedict, adjusted.’ The empirical EOS were sesame models 7830 ses7830 and 7834 ses7834 .
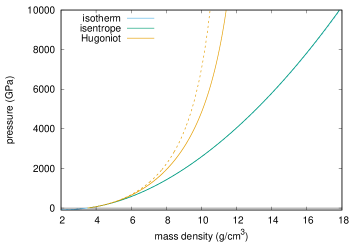
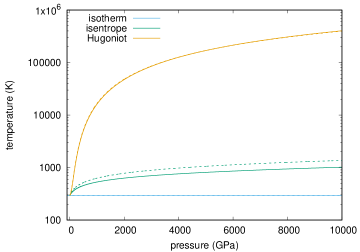
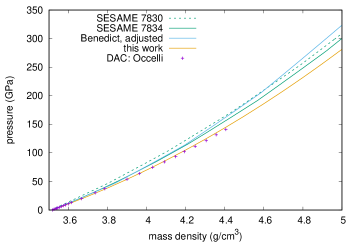
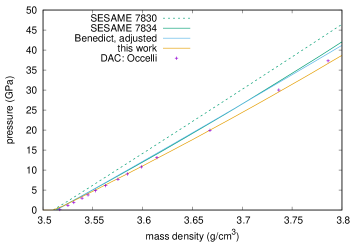
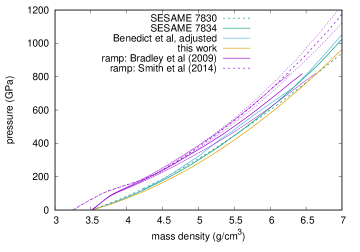
In pressure-density space, the choice of Grüneisen model affected only the principal Hugoniot; in pressure-temperature space it affected only the principal isentrope (Figs 1 and 2). The ambient isotherm lies close to diamond anvil cell (DAC) measurements Occelli2003 , closer than other reported EOS models (Figs 3 and 4). The agreement may be even better than shown, as it has been argued Dorogokupets2007 that the pressure deduced in the DAC data should be raised 10 GPa between 50 and 140 GPa.
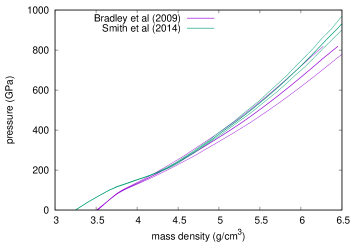
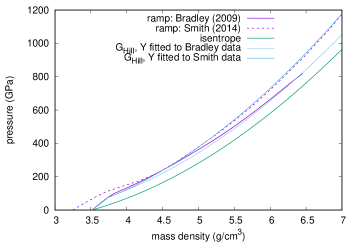
Ramp-loading experiments have been reported on samples of full density to 800 GPa at the omega laser facility Bradley2009 , and on deposited samples of reduced density to 5 TPa at the National Ignition Facility (NIF) Smith2014 . In the absence of material strength, ramp loading should sample states along the principal isentrope of the sample; strength acts to increase the normal stress at a given mass density. The nominal stress-density relation deduced for the reduced-density material lies above that from the full-density material everywhere except around 250 GPa, where they coincided. This observation could be interpreted as a higher thermal pressure from the lower-density samples, or, unexpectedly, a higher strength. However, taking the experimental uncertainties into account, the stress-density relations are consistent with each other once the lower-density samples have been compacted to full density (Fig. 5).
Before we consider the effect of material strength, the only assessment we can make is whether the isentrope lies below the ramp data, plotted as normal stress as a function of mass density, by an amount plausible to account for by the strength. The present EOS model has an isentrope lying in between those of the two empirical models, consistent with (i.e. lying below) the ramp-loading data, and implying a higher strength than would be consistent with sesame 7834. The isentrope from the five-phase model passes through the nominal NIF ramp data around 2.4 TPa, although it always lies below the upper uncertainty bound of the data, implying that the strength would have to decrease significantly as the pressure increased beyond 1 TPa. If the nominal NIF data are correct, this would imply that the five-phase model was inconsistent, as the strength would have to be negative, which is unphysical. (Figs 6 and 7).
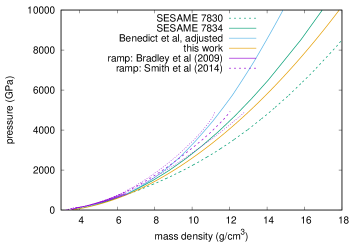
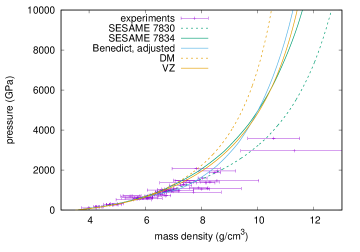
The present EOS model is intended primarily for ramp loading, and did not include a melt curve, high temperature ion-thermal effects, or electron-thermal energy, and thus would not be expected to reproduce the shock Hugoniot at pressures much over 1 TPa. It is nevertheless useful to evaluate its performance at lower pressures, and interesting to check its behavior at higher pressures, where for example a ramp load could steepen into a shock in a less than optimal experiment, as many are. Shock Hugoniot data exhibit more random scatter than ramp measurements, and experimental data up to the onset of shock melting were reasonably consistent with any of the EOS models considered. At higher pressures, the models constructed with Grüneisen parameters or 1 were much stiffer than any other EOS models, which is why we eliminated them from further use. Of the previous EOS models considered, only the five-phase model included an explicit melt transition, clearly evident along the principal Hugoniot between 800 and 1050 GPa. The Hugoniot from the EOS model constructed with the Vashchenko-Zubarev Grüneisen relation, i.e. , lies between those from the more recent empirical model sesame 7834 and the five-phase model, even passing almost exactly where these Hugoniots cross at around 5 TPa to lie between them at even higher pressures. This surprising consistency suggests that the new EOS model should be at least as reasonable a choice when modeling shock formation from a ramp load as either of the other EOS models. It does not reproduce shock data in detail around melting though it seems to be as good a choice as any other EOS for shock states at higher pressures; more work would be needed to develop an adequate model of the melt transition out of the diamond phase where it may be metastable. (Figs 8 to 10.)
IV Constitutive model
In theoretical and computational terms, it is far more feasible to predict the EOS and elastic moduli than the plastic flow behavior, because the length and time scales involved in plasticity are much less tractable to ab initio computation, and the flow mechanisms are poorly understood. Previous work on diamond for dynamic loading applied a time-independent model developed for plastic flow in metals Orlikowski2007 . It is commonly assumed, but not rigorously tested, that the flow stress scales with the shear modulus. Here we use electronic structure calculations to predict the variation with compression of the elastic moduli, and hence the texture-averaged shear modulus. We then consider observations of the normal stress to estimate the variation of flow stress with compression.
In empirical studies of material strength, it is common to express the elastic moduli and flow stress as functions of the pressure and temperature. Electronic structure calculations are more amenable to predicting material properties as a function of mass density rather than pressure. At constant pressure, increasing the temperature usually causes expansion; expansion usually reduces the bulk and shear moduli, and so the effect of temperature becomes conflated with that of compression. Usually, expressing the shear modulus in terms of mass density reduces the variation with temperature, sometimes to the level where it can be ignored. For this reason, we constructed the strength model in terms of mass density, but we also provide a calibration in terms of pressure for use in software implementations which do not allow a compression-based model.
IV.1 Elastic moduli
The variation of elastic moduli with compression was predicted by calculating the ground state stress tensor as the diamond lattice cell was distorted from its equilibrium shape. Uniaxial compression along the direction gives and , and shearing in any plane gives . The stress tensor was calculated for several strains from each isotropic configuration: a uniaxial strain of , and a shear strain of . The diamond lattice was calculated to remain stable with respect to shear induced by uniaxial deformation, i.e. , for g/cm3, i.e. TPa. The calculated variation of was reasonably smooth and monotonic up to 9.5 g/cm3, or 2.2 TPa, at which point the calculated values became scattered. Ignoring widely-scattered and unconverged points, the variation of elastic moduli with compression was fitted by
| (8) |
where GPa, GPa, and GPa; and
| (9) |
where GPa, GPa, and .
The main purpose of this work is to improve models of diamond for use in simulations of HED experiments, performed using multi-physics radiation hydrocodes which typically include a small set of isotropic strength models, i.e. with a scalar shear modulus and flow stress . It is thus a practical advantage if the constitutive behavior of diamond can be represented using an existing such model, even if it is not the most natural or general representation of the behavior. For uniaxial loading, the full, tensorial constitutive model can always be represented by an effective isotropic model of sufficient complexity. The Steinberg-Guinan model SteinGuin is widely used in dynamic loading simulations. However, as normally formulated, the underlying prescription for the variation of with pressure and compression is represented with a single parameter, and is known to be inaccurate at high pressures. Instead, we consider a modification to the Steinberg-Guinan model for large compressions KlepeisBales , which has been used previously for diamond Orlikowski2007 . This model has been implemented with some slight but important differences in different hydrocodes, and for clarity we define below the precise form of the model used in this work:
| (10) | |||||
| (11) | |||||
| (12) | |||||
| (13) | |||||
| (14) |
where is the usual Steinberg-Guinan term for pressure-hardening and the term in similarly for thermal softening, is the high pressure modification with parameters and , and provides a smooth transition between the two with parameter representing the compression at the transition.
Another important subtlety is that, for samples of different microstructural texture, the effective isotropic strength model differs. The previous diamond strength model Orlikowski2007 was constructed for polycrystalline material assuming an isotropic texture. Diffraction experiments on polycrystalline samples typically use single-crystal diamonds as structural components to avoid superimposing diffraction rings from the diamond on the signal from the sample. Measurements of loading waves transmitted through diamond of different microstructure, mm thick, have indicated that plasticity is simpler for crystals than for other orientations, in the sense that less structure is observed around the elastic-plastic transition in surface velocimetry Eggert2012 . More detailed studies of single-crystal plasticity in diamond would be needed to understand this behavior and and reproduce it in simulations. For this reason, we have generally preferred to use crystals for our experiments at NIF and omega.
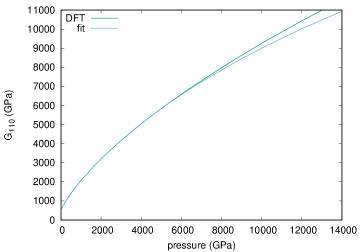
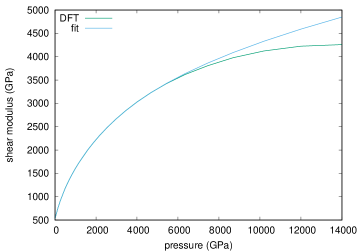
The effective shear modulus for crystals is , where and (Fig. 11). We fitted the parameters in the improved Steinberg-Guinan model above to as calculated from the elastic moduli (Table 3). The parameters of the transition function provide such a broad transition that is sensitive to the high pressure parameters throughout the low pressure region: the parameter . The model reproduced the DFT calculations of almost exactly to 6 TPa, with deviations increasing to a few percent by 10 TPa. (Fig. 12.)
| parameter | polycrystalline | ||
|---|---|---|---|
| Hill average | Orlikowski Orlikowski2007 | ||
| (GPa) | 386.5 | 552.5 | 529.0 |
| (1/GPa) | |||
| -3.75 | -0.520 | -0.596 | |
| 5.41 | 1.368 | 1.588 | |
| 0.67 | 0.574 | 3.47 | |
| 1.64 | 0.420 | 0.88 | |
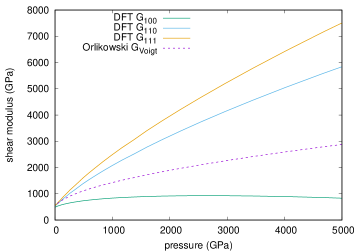
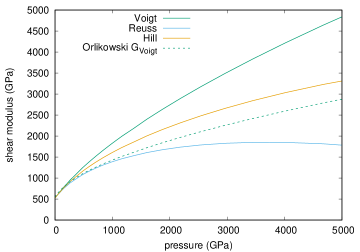
For comparison with the previous strength model Orlikowski2007 , we also calculated the polycrystalline average shear modulus, by the limiting approximations of Reuss (constant stress) and Voigt (constant strain), and also Hill (average of the two). These different approximations diverge by tens of percent above a few hundred gigapascals, indicating that texture and its evolution are likely to be important in polycrystalline diamond in this regime. (Fig. 13.)
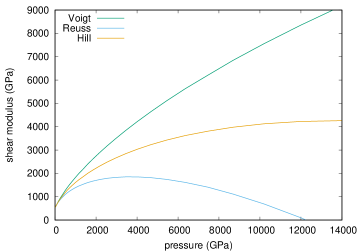
By fitting the parameters in the improved Steinberg-Guinan model (Table 3), it reproduced the Hill average shear modulus closely over the full range considered. The transition function was again broad enough that affected the low pressure region. Interestingly, the previous polycrystalline model, which was described as the Voigt average Orlikowski2007 , lies close to the present Reuss average to the 1.5 TPa covered by the previous study. (Figs 14 and 15.)
IV.2 Flow stress
We deduced the flow stress by comparing the stress-density response of diamond deduced from ramp loading experiments with the isentrope. The ramp experiments used polycrystalline samples, so we used the Hill polycrystalline average shear modulus . As discussed above, the variation of with temperature is usually less for than , so we took the polycrystalline average expressed as and ignored the thermal variation.
The uniaxial compression measurements from the omega and NIF facilities were taken on samples of different initial density, and the nominal data were not consistent in the region over which the densities overlapped, although the uncertainties overlapped. The omega data were taken on samples of close to full density, which is more straightforward to interpret, and ranged up to a normal stress 0.8 TPa Bradley2009 . The nominal stress-density data were reproduced with a constant flow stress GPa. The limits would imply a monotonic increase or decrease of flow stress with strain. The NIF data Smith2014 were taken on nanocrystalline samples relevant for ICF fuel capsules of significantly lower density, 3.25 g/cm3. The nominal stress-density data could be described by a flow stress where is a relatively slowly-varying function, linear from 0.12 at 3.5 g/cm3, to 0.17 at 10 g/cm3. This observation is equivalent to a criterion for plastic flow that there is a maximum elastic strain that diamond can support which varies slowly with compression. Following the lower uncertainty bound in the ramp data, maximum elastic strain at 10 g/cm3 would be around 0.07; following the upper bound, it would be around 0.35, with a variation faster than linear. The omega data are consistent with these relations, within their uncertainty. (Figs 16 and 17.)
V Heating on ramp compression
Diamond is notable for its high yield stress and low heat capacity, so it is particularly interesting to consider the effect of plastic work on heating during ramp loading. The relationship between plastic work and heat generation has not been thoroughly studied, and the assumptions made in hydrocode simulations of plastic flow are rarely even documented. They vary between assuming that 100% of plastic work appears as heat to ignoring it altogether. Some hydrocodes allow a parameter to be set controlling the fraction of plastic work contributing to heating, the Taylor-Quinney factor, . Studies of the heating of bulk metals from plastic working at low rates, such as occur in manufacturing forming processes, have suggested Taylor1934 . More recent studies have suggested that may vary more widely with material and loading conditions Zubelewicz2019 . The underlying process is that plastic deformation occurs through microstructural changes such as dislocation motion and evolution, which have an associated change in energy; heating is that part of the plastic work not accompanied by a change in potential energy of the microstructure.
It is known that deformation at high strain rates can induce a very high dislocation density. The dislocation population evolves to approach the equilibrium distribution for the instantaneous strain rate and temperature, and so dislocations may annihilate over a finite interval after high-rate deformation, even if the net strain rate for the material is zero. Thus the Taylor-Quinney factor is not a general representation of plastic heating, and may even appear to exhibit values outside the range 0 to 1 Zubelewicz2019 . However, a more rigorous representation is not yet available, particularly for strong covalently-bonded substances such as diamond, and so it is useful to consider the sensitivity to for deformation under simplified conditions.
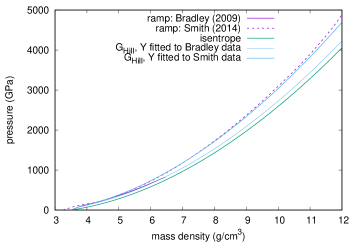
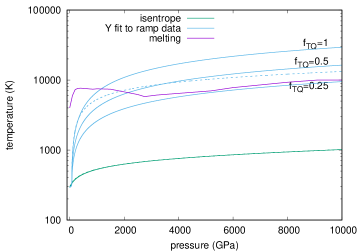
In diamond, with the elasticity and flow stress deduced above, a value leads to melting on ramp loading to pressures exceeding 1.2 TPa, using the melt locus from the five-phase EOS model Benedict2014 (Fig. 18). For C to remain solid as inferred from ramp EOS experiments Smith2014 , . In the five-phase model, melting on this loading path occurs from the BC8 phase. If diamond persists as a metastable phase, melting could potentially occur at a lower temperature if kinetically favored over the transition to BC8; the elastic strain energy in uniaxially-compressed diamond could lower the melting point still further. These contributions to an elevated free energy in dynamically-compressed diamond argue for a still-lower value of . There may be additional constraints from the observation that diamond does not transform into other structures to at least 2 TPa, as this suggests that the heating is insufficient for the kinetics of transition to the BC8 structure, with a barrier 2 eV, on ns time scales.
VI Conclusions
We constructed a DFT-based Mie-Grüneisen EOS model for C in the diamond structure which is consistent with all high-pressure data and slightly different than previous EOS models. We found it necessary to modify the Vinet function used to describe the cold curve in order to represent the DFT results to high pressure. The Vashchenko-Zubarev model for the Grüneisen parameter performed better than the Dugdale-MacDonald or Slater models.
We also used DFT calculations to predict the variation of the elastic moduli of diamond. The predictions were consistent with the previous results of Orlikowski and Valdez, but extended to much higher pressures. The calculations of and were well-behaved, and predict an instability to tetragonal distortions above 20 g/cm3 or 12.5 TPa. Calculations of were noisy above 9 g/cm3 or 2 TPa, which may suggest the onset of a shear distortion.
Effective isotropic shear moduli were deduced as a function of compression or pressure for , , and crystals. The predicted behavior was different than that of Orlikowski’s polycrystalline model, which has been used commonly for simulations of single-crystal diamond in HED experiments. The polycrystalline shear modulus was calculated from the single-crystal moduli. The Voigt, Reuss, and Hill averages matched at low pressure, but deviated significantly at pressures above a hundred gigapascals, by 10% around 0.5 TPa, and reaching 100% by 2.5 TPa. Thus the texture and its evolution are likely to be important in polycrystalline diamond.
Analytic models were developed for the elastic and shear moduli as a function of mass density or pressure. The ‘improved Steinberg-Guinan’ model of shear modulus was found to represent the Hill average polycrystalline shear modulus well over the full range considered.
Given the EOS and shear modulus, the flow stress was deduced from stress-density data obtained in ramp-loading experiments. Its behavior was consistent with a roughly constant maximum elastic strain before the onset of flow, although the uncertainty in the ramp experiments translated to a significant uncertainty in maximum elastic strain. The large flow stress implies a significant amount of heating from plastic work in ramp loading. If all the plastic work appeared as heat, ramp-loaded samples would melt below 1.2 TPa. The observation of solid diffraction at higher pressures may therefore be a novel constraint on the Taylor-Quinney factor.
Acknowledgments
Dr Florent Occelli kindly provided his original diamond anvil cell data.
This work was performed under the auspices of the U.S. Department of Energy under contract DE-AC52-07NA27344.
References
- (1) J.R. Rygg, R.F. Smith, A.E. Lazicki, D.G. Braun, D.E. Fratanduono, R.G. Kraus, J.M. McNaney, D.C. Swift, C.E. Wehrenberg, F. Coppari, M.F. Ahmed, M.A. Barrios, K.J.M. Blobaum, G.W. Collins, A.L. Cook, P. Di Nicola, E.G. Dzenitis, S. Gonzales, B.F. Heidl, M. Hohenberger, A. House, N. Izumi, D.H. Kalantar, S.F. Khan, T.R. Kohut, C. Kumar, N.D. Masters, D.N. Polsin, S.P. Regan, C.A. Smith, R.M. Vignes, M.A. Wall, J. Ward, J.S. Wark, T.L. Zobrist, A. Arsenlis, and J.H. Eggert, Rev. Sci. Instrum. 91, 043902 (2020).
- (2) L. Dubrovinsky, N. Dubrovinskaia, V.B. Prakapenka, and A.M. Abakumov, Nat. Commun. 3, 1163 (2012).
- (3) A. Dewaele, P. Loubeyre, F. Occelli, O. Marie, and M. Mezouar, Nat. Commun. 9, 2913 (2018).
- (4) Zs. Jenei, E.F. O’Bannon, S.T. Weir, H. Cynn, M.J. Lipp, and W.J. Evans, Nat. Commun. 9, 3563 (2018).
- (5) D.K. Bradley, J.H. Eggert, R.F. Smith, S.T. Prisbrey, D.G. Hicks, D.G. Braun, J. Biener, A.V. Hamza, R.E. Rudd, and G.W. Collins, Phys. Rev. Lett 102, 075503 (2009).
- (6) R.F. Smith, J.H. Eggert, R. Jeanloz, T.S. Duffy, D.G. Braun, J.R. Patterson, R.E. Rudd, J. Biener, A.E. Lazicki, A.V. Hamza, J. Wang, T. Braun, L.X. Benedict, P.M. Celliers, and G.W. Collins, Nature 511, 330 (2014).
- (7) A. Lazicki, D. McGonegle, J.R. Rygg, D.G. Braun, D.C. Swift, M.G. Gorman, R.F. Smith, P.G. Heighway, A. Higginbotham, M.J. Suggit, D.E. Fratanduono, F. Coppari, C.E. Wehrenberg, R.G. Kraus, D. Erskine, J.V. Bernier, J.M. McNaney, R.E. Rudd, G.W. Collins, J.H. Eggert, and J.S. Wark, Nature 589, 532–535 (2021).
- (8) For example: R. Biswas, R.M. Martin, R.J. Needs, and O.H. Neilsen, Phys. Rev. B 35, 9559 (1987); S. Fahy and S.G. Louie, Phys. Rev. B 50, 7389 (1987); M.T. Yin and M.L. Cohen, Phys. Rev. B 35, 9559 (1987).
- (9) P. Hohenberg and W. Kohn, Phys. Rev. B 136, 3B (1964).
- (10) W. Kohn and L.J. Sham, Phys. Rev. 140, 4A (1965).
- (11) J.P. Perdew, J.A. Chevary, S.H. Vosko, K.A. Jackson, M.R. Pederson, D.J. Singh, and C. Fiolhais, Phys. Rev. B 46, 6671 (1992).
- (12) J.A. White and D.M. Bird, Phys. Rev. B 50, R4954 (1994).
- (13) S.J. Clark, G.J. Ackland, and J. Crain, Phys. Rev. B 52, 11, 15035 (1995).
- (14) A.A. Correa, L.X. Benedict, D.A. Young, E. Schwegler, and S.A. Bonev. Phys. Rev. B 78, 024101 (2008).
- (15) M.D. Knudson, M.P. Desjarlais, and D. Dolan, Science 322, 1822 (2008).
- (16) S. Crockett (Los Alamos National Laboratory), documentation for sesame 7834 (2006).
- (17) M. Martinez-Canales, C.J. Pickard, and R.J. Needs, Phys. Rev. Lett. 108, 045704 (2012).
- (18) L.X. Benedict, K.P. Driver, S. Hamel, B. Militzer, T. Qi, A.A. Correa, A. Saul, and E. Schwegler, Phys. Rev. B 89, 224109 (2014).
- (19) D. Orlikowski, A.A. Correa, E. Schwegler, and J.E. Klepeis, Am. Inst. Phys. Conf. Proc. 955, pp. 247–250 (2007).
- (20) M.N. Valdez, K. Umemoto, and R.M. Wentzcovitch, Appl. Phys. Lett. 101, 171902 (2012).
- (21) F. Occelli, P. Loubeyre, and R. Letoullec, Nature Materials 2, 151-154 (2003).
- (22) D.C. Swift, G.J. Ackland, A. Hauer, and G.A. Kyrala, Phys. Rev. B 63, 214107 (2001).
- (23) D.C. Swift, R.E. Hackenberg, J.G. Niemczura, G.J. Ackland, J. Cooley, D.L. Paisley, R.P. Johnson, A. Hauer, and D. Thoma, J. Appl. Phys. 98, 093512 (2005).
- (24) D.C. Swift, D.L. Paisley, K.J. McLellan, and G.J. Ackland, Phys. Rev. B 76, 134111 (2007).
- (25) D.C. Swift et al, arXiv:1909.05391 (2019).
- (26) N. Troullier and J.L. Martins, Phys. Rev. B 43, pp 1993-2006 (1991).
- (27) H.J. Monkhorst and J.D. Pack, Phys. Rev. B 13, 5188 (1976).
- (28) P. Debye, Ann. Phys. 39, 4, 789–839 (1912).
- (29) L. Burakovsky and D.L. Preston, J.Phys. Chem. Solids 65, 1581 (2004).
- (30) V.Ya. Vashchenko and V.N. Zubarev, Sov. Phys. Solid State 5, 653 (1963).
- (31) J.S. Dugdale and D.K.C. MacDonald, Phys. Rev. 89, 4, pp 832-834 (1953).
- (32) P. Vinet, J.R. Smith, J. Ferrante, and J.H. Rose, Phys. Rev. B 35, 4, 1945 (1987).
- (33) H. Akbarzadeh, S.J. Clark, and G.J. Ackland, J. Phys: Cond. Matt. 5, 8065 (1993).
- (34) L.H. Thomas, Proc. Cambridge Phil. Soc. 23, 5, 542–548 (1927); E. Fermi, Rend. Accad. Naz. Lincei. 6, 602–607 (1927).
- (35) B.I. Bennett (Los Alamos National Laboratory), documentation for sesame 7830 (1982).
- (36) P.I. Dorogokupets and A.R. Oganov, Phys. Rev. B 75, 024115 (2007).
- (37) M.N. Pavlovskii, Sov. Phys. Solid State 13, 741 (1971).
- (38) K. Kondo and T.J. Ahrens, Geophys. Res. Lett. 10, 4, 281-284 (1983).
- (39) D.K. Bradley, J.H. Eggert, D.G. Hicks, P.M. Celliers, S.J. Moon, R.C.Cauble, and G.W. Collins, Phys. Rev. Lett. 93, 195506 (2004).
- (40) H. Nagao, K.G. Nakamura, and K. Kondo, Phys. Plasmas 13, 052705 (2006).
- (41) S. Brygoo, E. Henry, P. Loubeyre, J. Eggert, M. Koenig, B. Loupias, A. Benuzzi-Mounaix, and M.R. le Gloahec, Nat. Mater. 6, 274 (2007).
- (42) D.G. Hicks, T.R. Boehly, P.M. Celliers, D.K. Bradley, J.H. Eggert, R.S. McWilliams, R. Jeanloz, and G.W. Collins, Phys. Rev. B 78, 174102 (2008).
- (43) R.S. McWilliams, J.H. Eggert, D.G. Hicks, D.K. Bradley, P.M. Celliers, D.K. Spaulding, T.R. Boehly, G.W. Collins, and R. Jeanloz, Phys. Rev. B 81, 014111 (2010).
- (44) D.J. Steinberg, S.G. Cochran, and M.W. Guinan, J. Appl. Phys. 51, 1498 (1980).
- (45) J. Klepeis and S. Bales (Lawrence Livermore National Laboratory), unpublished.
- (46) J.F. Eggert and D.E. Fratanduono (Lawrence Livermore National Laboratory), unpublished.
- (47) G.I. Taylor and H. Quinney, Proc. Roy. Soc. A 143, pp 307–326 (1934).
- (48) A. Zubelewicz, Sci. Rep. 9, 9088 (2019).