Detection of Repeating FRB 180916.J0158+65 Down to Frequencies of 300 MHz
Abstract
We report on the detection of seven bursts from the periodically active, repeating fast radio burst (FRB) source FRB 180916.J0158+65 in the 300–400-MHz frequency range with the Green Bank Telescope (GBT). Emission in multiple bursts is visible down to the bottom of the GBT band, suggesting that the cutoff frequency (if it exists) for FRB emission is lower than 300 MHz. Observations were conducted during predicted periods of activity of the source, and had simultaneous coverage with the Low Frequency Array (LOFAR) and the FRB backend on the Canadian Hydrogen Intensity Mapping Experiment (CHIME) telescope. We find that one of the GBT-detected bursts has potentially associated emission in the CHIME band (400–800 MHz) but we detect no bursts in the LOFAR band (110–190 MHz), placing a limit of on the spectral index of broadband emission from the source. We also find that emission from the source is severely band-limited with burst bandwidths as low as 40 MHz. In addition, we place the strictest constraint on observable scattering of the source, 1.7 ms, at 350 MHz, suggesting that the circumburst environment does not have strong scattering properties. Additionally, knowing that the circumburst environment is optically thin to free-free absorption at 300 MHz, we find evidence against the association of a hyper-compact Hii region or a young supernova remnant (age 50 yr) with the source.
1 Introduction
Fast radio bursts (FRBs) are bright, millisecond-duration radio transients of unknown physical origin (see Petroff et al. 2019 and Cordes & Chatterjee 2019 for reviews). Their measured dispersion measures (DMs) are in excess of those expected from the Milky Way, suggesting that FRBs are located at cosmological distances. Identification of the host galaxy for five of the 110 published FRBs111http://frbcat.org (Petroff et al., 2016) has confirmed their cosmological origin, placing these five sources at redshifts between 0.03 and 0.66 (Tendulkar et al., 2017; Bannister et al., 2019; Ravi et al., 2019; Prochaska et al., 2019; Marcote et al., 2020). Dozens of emission models involving progenitors ranging from compact objects to cosmic strings have been proposed to explain the inferred isotropic energy output of 1040 erg for these sources (see Platts et al. 2019 for a summary of the proposed models222http://frbtheorycat.org).
Over the past decade, most FRBs have been observed at a frequency of 1 GHz, with one of the sources, FRB 121102, also being detected in the 4–8 GHz frequency range (Michilli et al., 2018; Gajjar et al., 2018). However, the recent detection of FRBs by the Canadian Hydrogen Intensity Mapping Experiment telescope (CHIME) in the frequency range of 400–800 MHz (CHIME/FRB Collaboration et al., 2019a) has shown that FRB emission extends to lower radio frequencies. With the apparent ubiquity of these bursts above a frequency of 400 MHz, it is surprising that none of the FRB searches conducted in the frequency range of 300–400 MHz (e.g., Deneva et al. 2016, Chawla et al. 2017, Rajwade et al. 2020) have detected any FRBs so far.
Observations of FRBs at low frequencies are important to ascertain whether there exists a cutoff or turnover frequency for their emission, which can help constrain proposed emission mechanisms. FRBs could also be rendered undetectable at low frequencies due to a spectral turnover arising from propagation effects in the circumburst environment or due to scattering (multipath propagation of signals caused by an intervening ionized medium). Either of these possibilities offers an opportunity to constrain the properties of the circumburst medium using low-frequency detections (CHIME/FRB Collaboration et al., 2019a; Ravi et al., 2019). Additionally, observations in the 300–400-MHz frequency range can enable studies of the frequency dependence of FRB activity, allowing determination of optimal observing strategies for future FRB searches with instruments such as the Low-Frequency Array (LOFAR) and the Murchison Widefield Array (MWA) which have not detected any FRBs so far at frequencies close to 150 MHz (Coenen et al., 2014; Tingay et al., 2015; Karastergiou et al., 2015; Sokolowski et al., 2018).
To detect emission from FRBs at low frequencies, a complementary strategy to blind searches is targeted follow-up of repeating FRBs (e.g., Houben et al. 2019). There are currently 20 known repeating FRBs (Spitler et al., 2016; CHIME/FRB Collaboration et al., 2019b, c; Kumar et al., 2019; Fonseca et al., 2020). It is as yet unclear whether these sources have a different physical origin as compared to the so-far non-repeating FRBs. Burst widths for repeating sources are found to be larger, on average, than those for the so-far non-repeating sources. While this observation supports the notion of potentially different emission mechanisms and/or local environments for the two (Scholz et al., 2016; CHIME/FRB Collaboration et al., 2019c; Fonseca et al., 2020), analysis of volumetric occurrence rates suggests that a large fraction of FRBs must repeat (Ravi, 2019).
The CHIME/FRB collaboration has recently reported on the detection of a 16.35-day modulation (or alias thereof) in the activity of one of the repeating FRB sources, FRB 180916.J0158+65 (CHIME/FRB Collaboration et al., 2020) with bursts from this source being detected in a 5-day-long activity window. This source is also interesting because of its recent localization to a star-forming region in a massive spiral galaxy at a redshift (corresponding to a luminosity distance of 149.0 0.9 Mpc), making it the closest of any of the localized FRBs (Marcote et al., 2020).
Here we report on the detection of low-frequency radio emission from FRB 180916.J0158+65 with the 100-m diameter Robert C. Byrd Green Bank Telescope (GBT) and simultaneous observations of the source with the CHIME/FRB instrument and LOFAR. In Section 2, we provide details of observations made with the above-mentioned instruments. In Section 3, we describe the methodology used to determine burst properties and sensitivity thresholds for these observations. In Section 4, we discuss the frequency dependence of burst activity as well as the implications of the detection of emission at low frequencies from this source. We summarize our conclusions in Section 5.
2 Observations
2.1 Green Bank Telescope
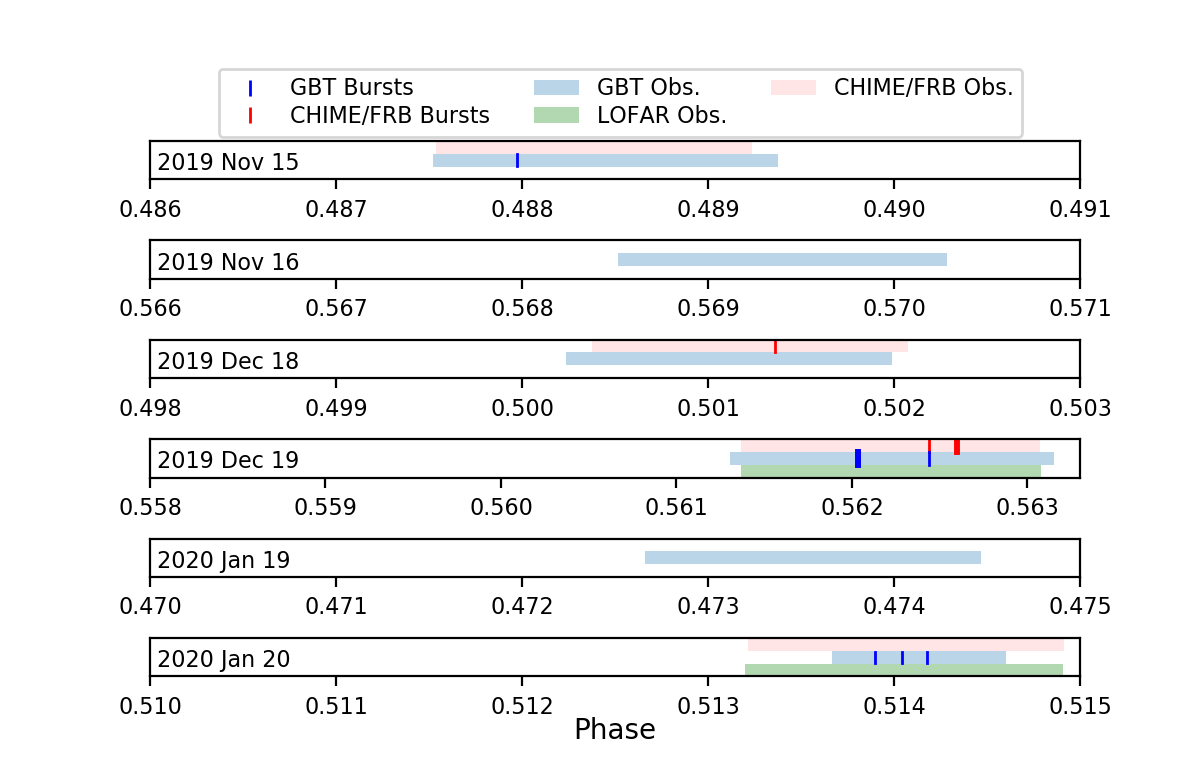
We observed the interferometric position of FRB 180916.J0158+65 (RA = 01h58m000075, Dec. = 65∘43′00.3152′′; Marcote et al. 2020), in the period from 2019 November 15 to 2020 January 20, with the GBT at a central frequency of 350 MHz. Data spanning 100 MHz of bandwidth were recorded using the Green Bank Ultimate Pulsar Processing Instrument backend (GUPPI; DuPlain et al. 2008). We conducted six observations of the source, all of which were within a 1.2-day interval of predicted epochs of peak source activity (CHIME/FRB Collaboration et al., 2020). Details of the observations are provided in Table 1 with a timeline shown in Figure 1.
In each observation, data for all four Stokes parameters were recorded for 512 frequency channels at a cadence of 20.48 s. Since the DM of the source was known prior to the observations, data were coherently dedispersed to the nominal DM (349.5 pc cm-3, CHIME/FRB Collaboration et al. 2019c), thereby increasing search sensitivity by mitigating the effects of intra-channel dispersive smearing.
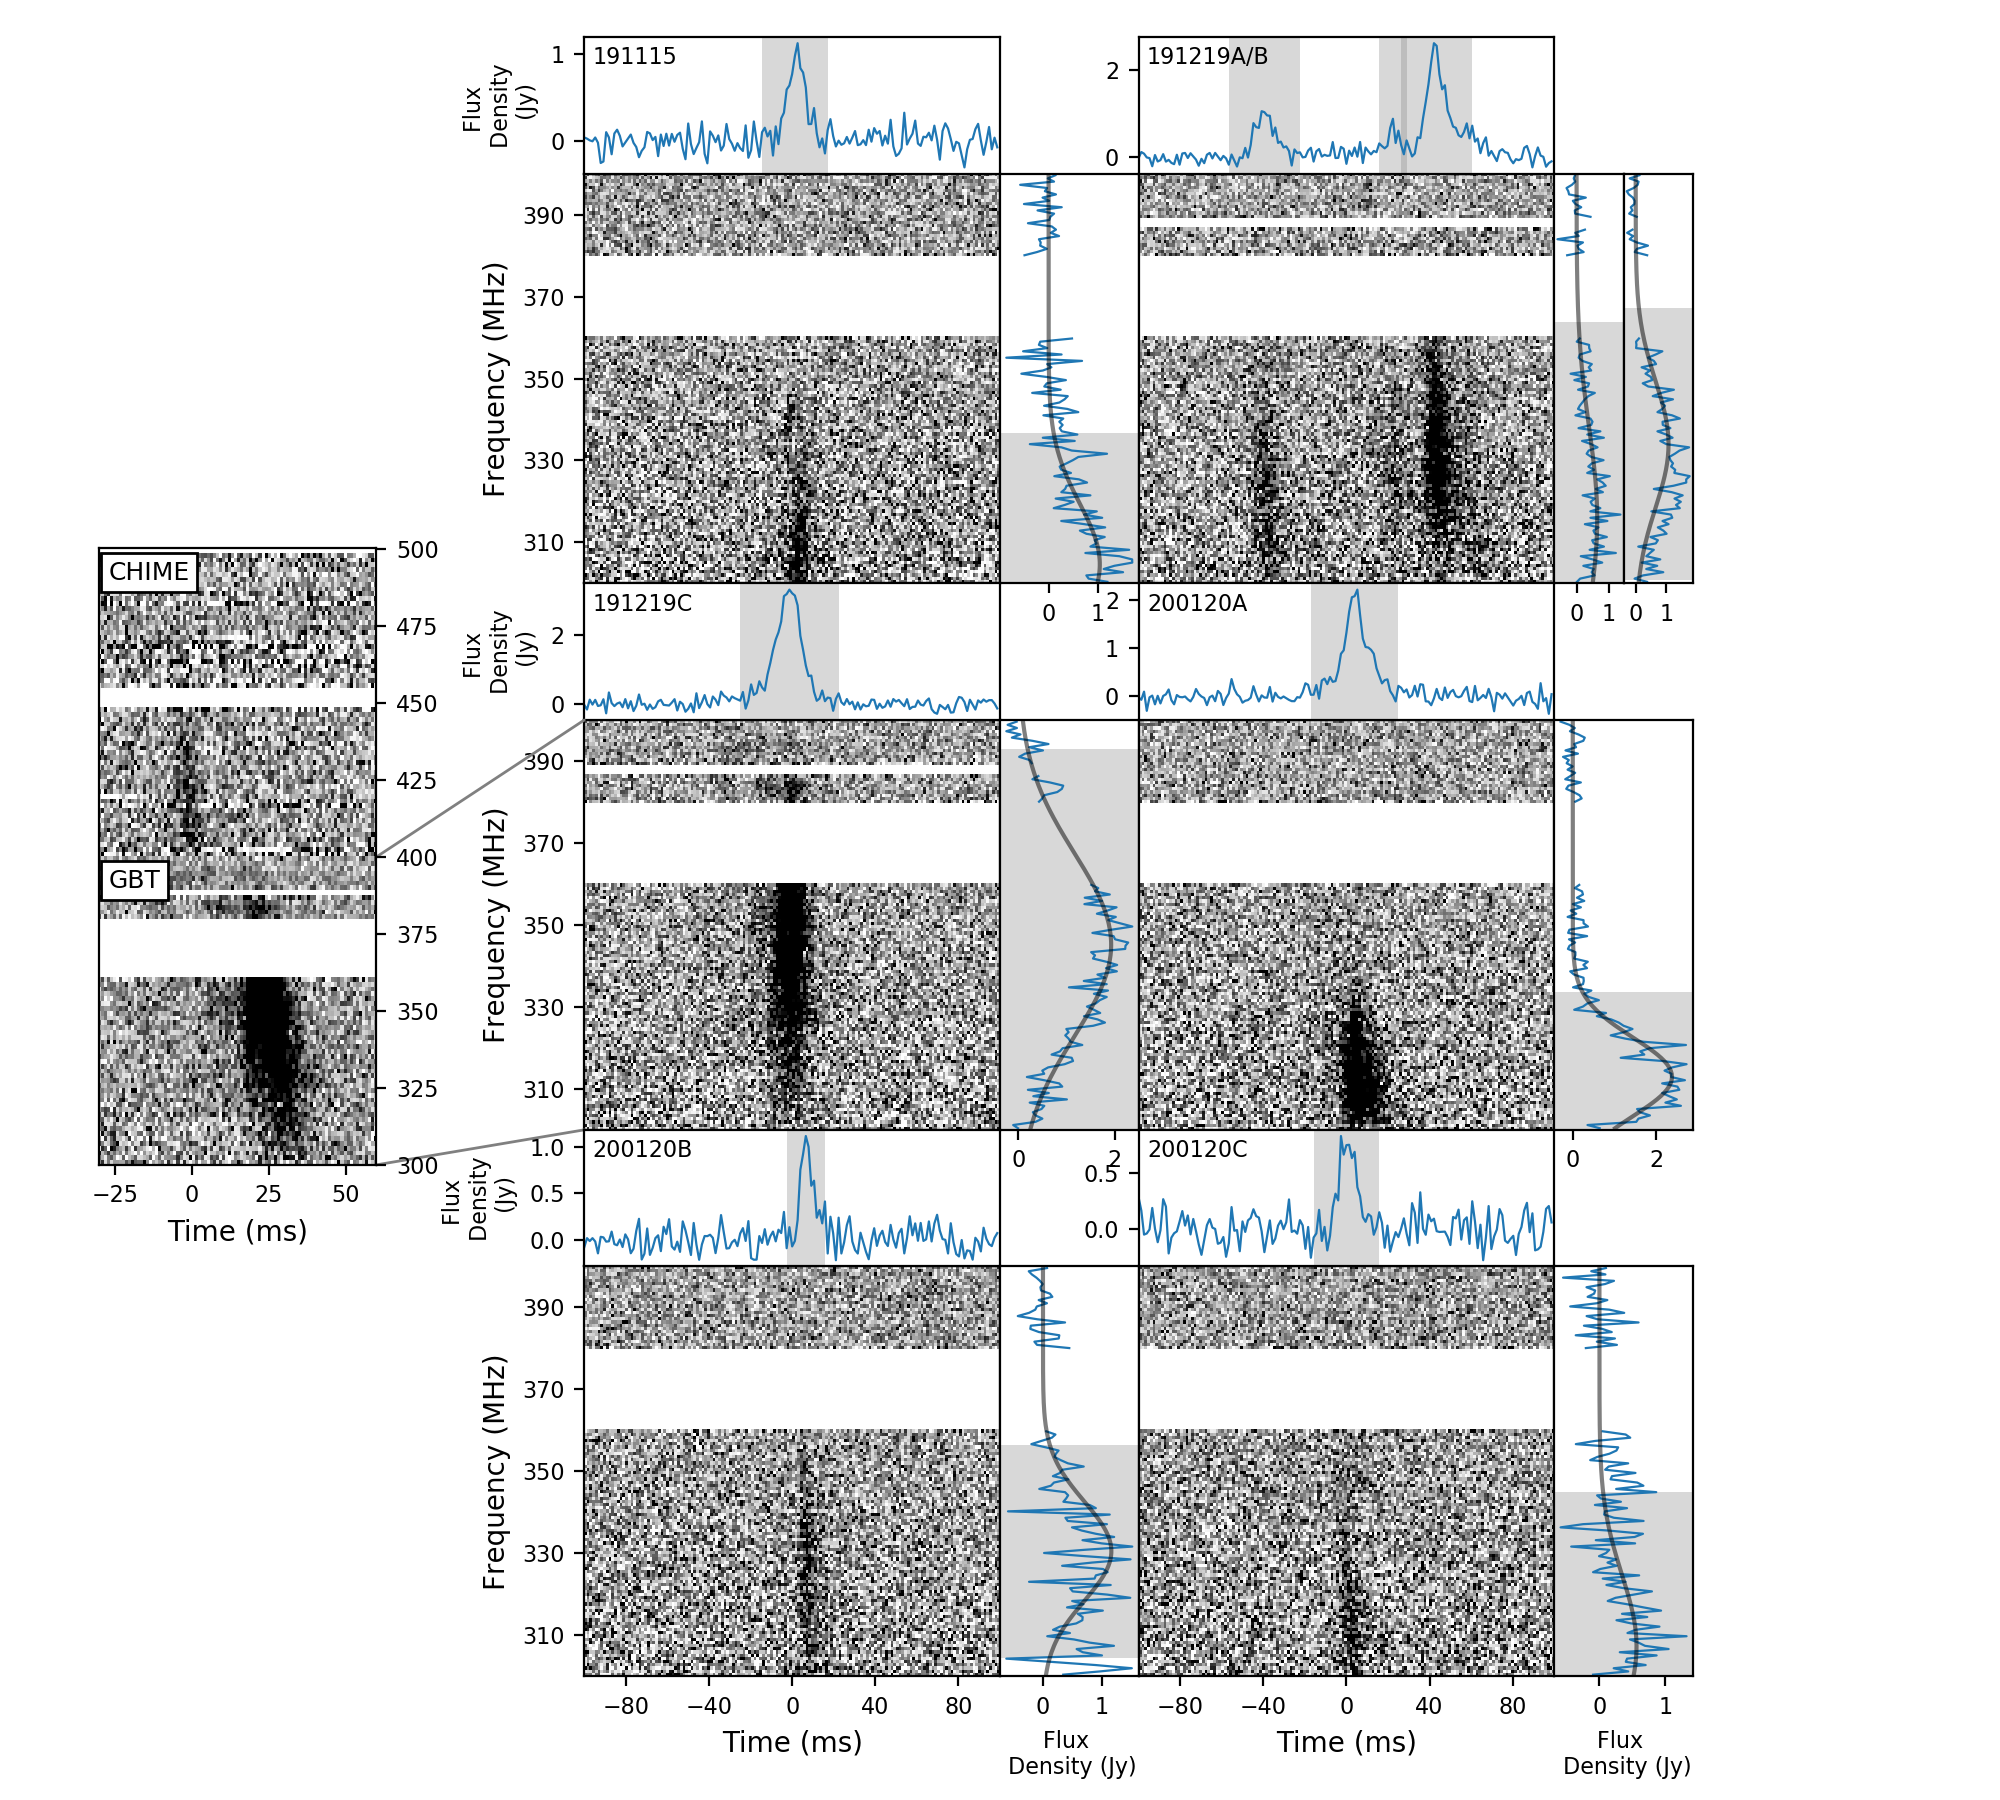
We downsampled the data to a resolution of 327.68 s and searched for bursts using the PRESTO software package333https://github.com/scottransom/presto (Ransom, 2001). In order to do so, we masked time samples and frequency channels containing radio frequency interference (RFI) using PRESTO’s rfifind. This process reduced the usable bandwidth in each observation to 80 MHz due to persistent RFI in the 360–380 MHz frequency range at the telescope site. We then dedispersed the data at a large number of trial DMs (in steps of 0.03 pc cm-3) in a narrow range of 20 pc cm-3 around the nominal DM. Each dedispersed topocentric time series was searched for single pulses (with a maximum width of 100 ms) using the PRESTO-based matched filtering algorithm, single_pulse_search.py. We found a total of eight candidate bursts having S/N in these observations, seven of which were found to be astrophysical after examining their dynamic spectra. The other candidate burst comprised of two narrowband RFI signals which were observed at different times but were detected with a high S/N as they coincidentally lined up at the DM of the source. The dynamic spectra of these bursts are shown in Figure 2 with the burst properties determined in Section 3.
2.2 CHIME/FRB Instrument
Four of the six GBT observations were scheduled to coincide with the transit of the source over the CHIME telescope. CHIME is a transit telescope sensitive in the frequency range of 400–800 MHz with the CHIME/FRB instrument searching for dispersed signals in 1,024 synthesized beams using a real-time detection pipeline (CHIME/FRB Collaboration et al., 2018). The repeating FRB 180916.J0158+65 is observable daily for 12 minutes within the FWHM (at 600 MHz) of the synthesized beams of the CHIME/FRB system. Transit of the source over the extent of the primary beam of the CHIME telescope is much longer (40 minutes). However, sensitivity to the source varies significantly during the primary beam transit.
All CHIME/FRB compute nodes responsible for processing data for the four synthesized beams through which the source transits were operational at the time of the GBT observations. Four bursts from the source were detected by the CHIME/FRB system during these observations (CHIME/FRB Collaboration et al., 2020), three of which do not have any coincident emission detected with the GBT (see Figure 1). However, one of these bursts, with emission in a narrow frequency range of 50 MHz at the bottom of the CHIME band, is found to be associated with the GBT-detected burst 191219C after referencing burst arrival times for both telescopes to the solar system barycenter. We caution that we cannot accurately determine the temporal separation between the two bursts as there could be as-yet-uncharacterized offsets (of the order of ms) between the timestamps reported by the two backends (GUPPI and CHIME/FRB). However, our current estimate of the separation between the best-fit burst arrival times (see Table 2) is 23 ms, which implies that the bursts together constitute emission drifting downwards in frequency — even after correction for dispersion. The phenomenon of downward-drifting sub-bursts has been observed previously for this source as well as for other repeating FRBs (Hessels et al., 2019; CHIME/FRB Collaboration et al., 2019b, c). The dynamic spectra of these bursts are shown in Figure 2 with characterization of burst properties and the frequency-drift rate described in Section 3.
| Telescope | Obs. Freq. | Bandwidth | Calendar Date | Start Time | Duration | No. of |
|---|---|---|---|---|---|---|
| (MHz) | (MHz) | (MJD)aaReported start times are topocentric at each observing site. | (hours) | DetectionsbbDetections with the CHIME/FRB system have been reported on by CHIME/FRB Collaboration et al. (2020). | ||
| LOFAR | 150 | 80 | 2019 Dec 19 | 58836.15841 | 0.67 | … |
| 2020 Jan 20 | 58868.07083 | 0.67 | … | |||
| GBT | 350 | 100 | 2019 Nov 15 | 58802.25100 | 0.73 | 1 |
| 2019 Nov 16 | 58803.57524 | 0.69 | … | |||
| 2019 Dec 18 | 58835.15885 | 0.69 | … | |||
| 2019 Dec 19 | 58836.15731 | 0.73 | 3 | |||
| 2020 Jan 19 | 58867.40803 | 0.71 | … | |||
| 2020 Jan 20 | 58868.07846 | 0.37 | 3 | |||
| CHIME/FRBccThe start time and duration of each observation with the CHIME/FRB system corresponds to the transit of the source across the primary beam of the telescope (see §2.2) | 600 | 400 | 2019 Nov 15 | 58802.25126 | 0.67 | … |
| 2019 Dec 18 | 58835.16114 | 0.67 | 1 | |||
| 2019 Dec 19 | 58836.15841 | 0.67 | 3 | |||
| 2020 Jan 20 | 58868.07103 | 0.67 | … |
2.3 Low-Frequency Array (LOFAR)
We recorded beam-formed complex voltage data with the LOFAR High Band Antennas of all Core stations (van Haarlem et al., 2013; Stappers et al., 2011) at 110–190 MHz during the time of two GBT observations in which bursts are detected. This data has a native resolution of 5.12 s and 0.195312 MHz.
All channels were coherently dedispersed to 350 pc cm-3 using cdmt (Bassa et al., 2017), RFI was masked using PRESTO’s rfifind and the barycentered start times of the observations were calculated using sigproc’s barycentre module.
We performed a traditional single-pulse search of the observations, using PRESTO’s single_pulse_search.py, split into a high-time resolution and a low-time resolution search. We adopt this strategy to be sensitive to both narrow (similar burst width as in the GBT band) and wide bursts, in case bursts are intrinsically broader at lower frequencies or are broadened by scattering. For the high-time-resolution search, the data were downsampled to ms, and DMs 330–370 pc cm-3 were searched in 0.005 pc cm-3 steps up to burst widths of 0.05 s. For the low-time-resolution-search, the data were downsampled to ms, and DMs 330–370 pc cm-3 were searched in 0.2 pc cm-3 steps up to burst widths of 0.3 s. No bursts were detected with S/N and , the noise floors for the high and low-time resolution searches, respectively.
We converted the GBT burst times-of-arrival (TOAs; listed in Table 2) to expected TOAs at 150 MHz in the barycentric frame and generated 20 s of dynamic spectra around that time, incoherently dedispersed to 348.82 pc cm-3 (the best measured DM from high-resolution CHIME/FRB data; CHIME/FRB Collaboration et al., 2020), sub-banded to 200 channels of 0.390624 MHz bandwidth each and downsampled to 1.96608-ms and 20.97152-ms time resolution. We inspected these dynamic spectra by eye in order to be sensitive to bursts with potentially narrow (10–20 MHz) emission bandwidths and slow frequency drifts, to which a traditional search that sums over the full bandwidth has reduced sensitivity. This burst spectrum is expected from extrapolating burst widths and linear drift rates at higher frequencies down to 150 MHz (Hessels et al., 2019; Josephy et al., 2019). No bursts were found.
A 300-s test observation of pulsar B2111+46 (with a spin period of 1.01 s) was recorded and processed in the way described above (except that it was dedispersed at both the coherent and incoherent dedispersion stage to 141.3 pc cm-3). Pulses were detected in both a by-eye inspection of dynamic spectra and in a blind search, as expected. As the closest test observation is from 2019 July 30 this gives confidence in the processing pipeline.
3 Analysis
3.1 Determination of Burst Properties
We determine burst properties from data which are downsampled to a resolution of 327.68 s and corrected for the receiver bandpass using the radiometer equation (see, e.g., Lorimer & Kramer 2004),
| (1) |
where is the rms noise for each frequency channel, is the receiver temperature, is the telescope gain, is the number of summed polarizations, is the sampling time and is the frequency resolution. The GBT’s 350-MHz receiver has444https://science.nrao.edu/facilities/gbt/proposing/GBTpg.pdf , K and 2 K Jy-1. The sky temperature at the central frequency of each channel, , was estimated using the 408-MHz all-sky map produced by Remazeilles et al. (2015) by assuming a spectral index of 2.55 for Galactic synchrotron emission (Haslam et al., 1982). We calibrate the data by subtracting the off-pulse mean, dividing by the off-pulse standard deviation and converting the counts in each frequency channel to a flux density using Equation 1. Here we define the on-pulse region (shown in Figure 2) as twice the full width at tenth maximum (FWTM) in a Gaussian model fit to the band-averaged time series.
Using the calibrated data, we estimate burst DMs with the DM_phase package555https://github.com/danielemichilli/DM_phase (Seymour et al., 2019) which has previously been used to characterize FRBs with complex morphologies, particularly those with downward-drifting sub-bursts. For each burst, the algorithm estimates the optimal DM based on whether the coherent power over the emission bandwidth, and hence the burst structure, is maximized. The measured DMs (see Table 2) for all but two GBT detections are consistent within 1 uncertainties with the average DM of 348.82 pc cm-3 measured for the source using complex voltage data recorded by the CHIME/FRB system (CHIME/FRB Collaboration et al., 2020). The DMs of the other two detections, 191115 and 191219C, although higher, are consistent with the average source DM at the 3 level. We note that measurements can be biased high if drifting sub-structure within bursts is unresolved at the time resolution used for obtaining the best-fit DM.
We also fitted models of dynamic spectra to all calibrated GBT bursts for estimating component widths and scattering timescales, using the same least-squares algorithm employed in previous CHIME/FRB analyses (CHIME/FRB Collaboration et al., 2019a, b, c; Fonseca et al., 2020). For all modeling, we held the DM fixed to the values listed in Table 2 while fitting six parameters that describe a pulse broadening function – the convolution of a Gaussian temporal profile with a one-sided exponential decay induced by scattering (e.g. McKinnon, 2014) — modulated by a running power law across the band. However, FRBs from repeating sources regularly display complex behavior, such as drifting sub-structure as well as frequency-dependent profile variations intrinsic to the emission mechanism (Hessels et al., 2019). In the low-S/N limit, such frequency-dependent structure can be temporally unresolved and mimic the effects of scatter broadening, potentially biasing the scattering measurements. However, in order to assess the statistical significance of scattering and place upper limits whenever possible, we nonetheless apply two-dimensional pulse broadening functions as models to the GBT spectra in a manner consistent with previous CHIME/FRB analyses.
We estimate fluence by integrating the extent of each burst in the band-averaged time series with the peak flux density estimated to be the highest value in this time series. Both these measurements rely on the off-pulse mean and standard deviation used in correcting the data for the receiver bandpass. Therefore, we generate different realizations of calibrated data, each using the off-pulse mean and standard deviation from a different time chunk (of 3-s duration) in the observation in which the burst was detected. We measure the fluence and peak flux density for each realization of the calibrated data and report the mean and standard deviation of these measurements in Table 2.
| Name | Arrival TimebbArrival times are corrected to the solar system barycenter and referenced to infinite frequency. | Detection | DMccDMs reported here are obtained through the process of structure-optimization (see §3) with the dynamic spectra shown in Figure 2 dedispersed to these DMs. | Scattering | Temporal WidtheeAll values are intrinsic burst widths since spectra are fitted with two-dimensional pulse broadening functions, and thus separate frequency-dependent scattering contributions and intrinsic components from the observed widths. | Fluence | Peak Flux | Center | Bandwidth | RMggThe values are not corrected for ionospheric contribution. |
|---|---|---|---|---|---|---|---|---|---|---|
| (MJD) | S/N | (pc cm-3) | Time (ms)ddScattering timescales reported here are measured at a frequency of 350 MHz. See Section 4.1 for a discussion on the scattering estimates and sources of bias that can produce apparent variations. | (ms) | (Jy ms) | DensityffPeak flux density for each burst is estimated from the corresponding band-averaged time series at a resolution of 327.68 s. | Freq. | (FWTM; MHz) | (rad m-2) | |
| (Jy) | (MHz) | |||||||||
| 191115 | 58802.25840267 | 11.3 | 349.3(2) | 2.9 | 3.6(5) | 10.2(5) | 1.18(6) | 304(5) | 64(17) | |
| 191219A | 58836.16929624 | 13.3 | 348.8(4) | 5.9(3) | 2.7(4) | 11.2(4) | 1.24(5) | 316(5) | 96(19) | 116.9(5) |
| 191219BhhBurst 191219B is treated as having two components rather than being two separate bursts since the emission between the two does not revert to the baseline noise level. Therefore, arrival time, width, fluence and peak flux density for the two components are reported separately. | 58836.16929695 | 28.6 | 348.8(4) | 5.9(3) | 3.9(8) | 5.2(2) | 1.09(4) | 334(1) | 66(6) | 116.9(2) |
| 58836.16929720 | 2.42(18) | 31.9(1.1) | 2.66(9) | |||||||
| 191219C | 58836.17591822 | 54.9 | 349.5(3) | 1.7 | 5.89(11) | 48.9(1.7) | 3.58(13) | 345.2(7) | 96(2) | 116.6(2) |
| 200120A | 58868.08221442 | 19.3 | 348.9(1) | 4.1(3) | 3.7(2) | 28.1(9) | 2.28(7) | 312.9(6) | 41(2) | 117.7(3) |
| 200120B | 58868.08461892 | 14.4 | 348.7(2) | 3.1(5) | 1.5(3) | 7.8(2) | 1.30(4) | 330.5(9) | 52(4) | |
| 200120C | 58868.08679636 | 11.9 | 348.8(2) | 1.8(9) | 3.2(6) | 7.7(2) | 0.98(3) | 307(5) | 75(16) |
3.2 Drift Rate Measurement for Burst 191219C
If the estimate of the temporal separation between burst 191219C and its coincident CHIME/FRB detection is correct, then we can measure the linear drift rate of the sub-bursts in the burst envelope that drifts from the bottom of the CHIME band into the top of the GBT band (inset panel on the left in Fig. 2) using a Monte Carlo resampled auto-correlation analysis (CHIME/FRB Collaboration et al., 2019b). We use the composite dynamic spectrum in the frequency range of 300–500 MHz having 256 normalized frequency channels dedispersed to 348.82 pc cm-3 for this analysis. We use 100 100 = 10,000 random noise and DM uncertainty samples, and set the difference between the best known DM for the source and the inverse-variance weighted average DM of the GBT bursts, 0.12 pc cm-3, as the DM uncertainty. Two systematics in the auto-correlation analysis are the 0.1953125 MHz offset between the two bands and the alignment of time samples of the two systems, which is uncertain on the 30 s level. Both effects introduce uncertainties on the drift rate measurement that are much smaller than the nominal uncertainty calculated from resampling the noise and DM uncertainty distributions. However, as noted above, there might be an additional unaccounted for offset between the two receivers on the ms level. We measure d/dt MHz ms-1 (68% confidence interval), under the assumption that that receiver time offset is negligible. This value is in line with the general observed trend for the drift rates to be lower at lower frequencies for bursts from FRB 121102 (Hessels et al., 2019; Josephy et al., 2019) and it points to a similar trend for FRB 180916.J0158+65. However, for FRB 180916.J0158+65, the lack of drift rate measurements at gigahertz frequencies impedes a measurement of drift rate evolution with frequency for now.
3.3 Polarization Properties
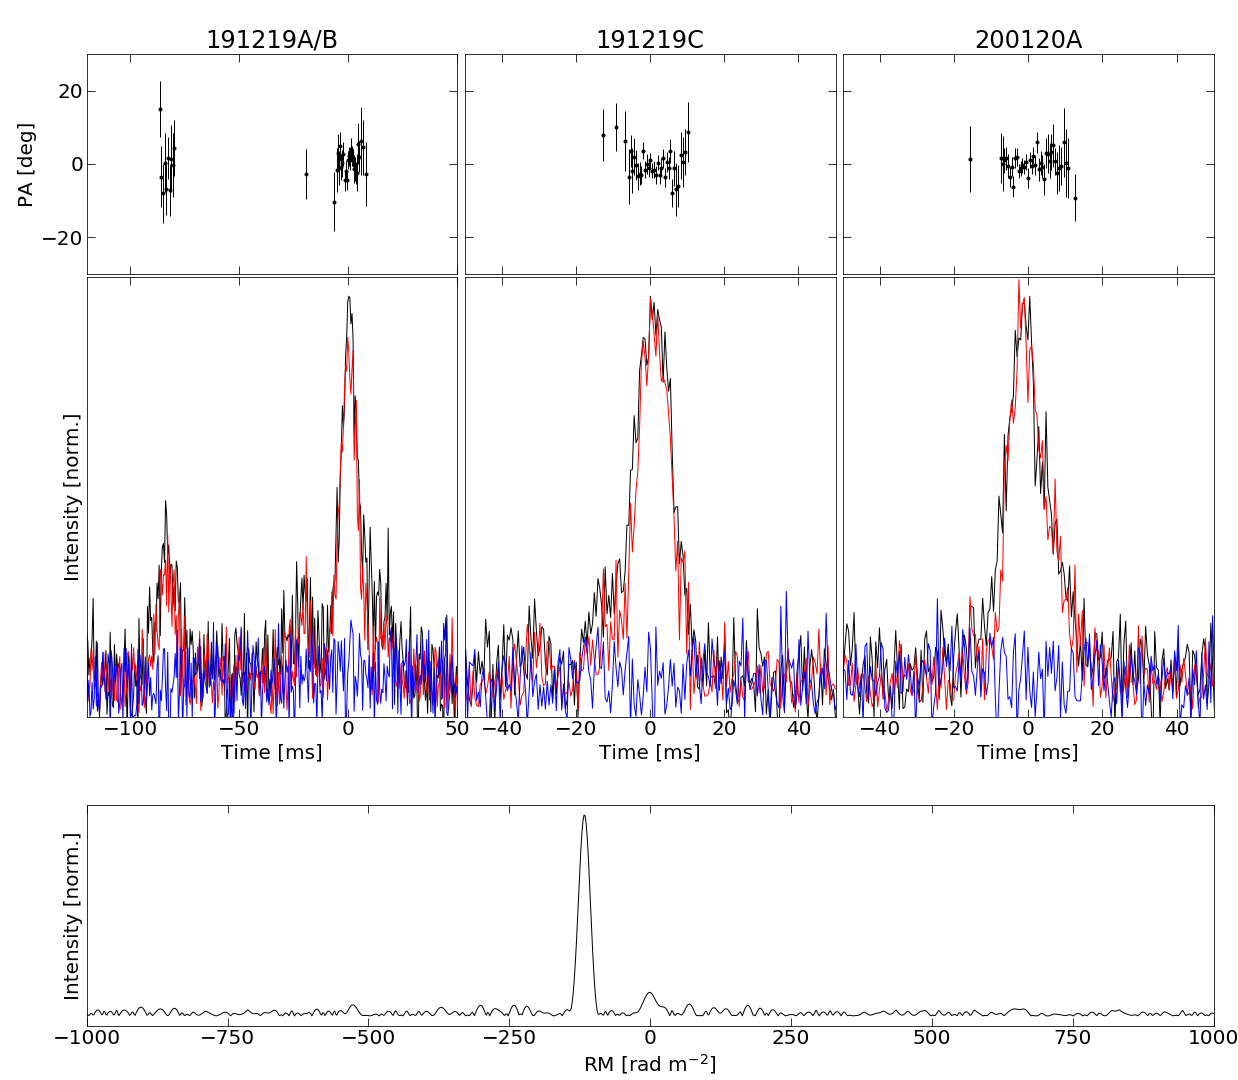
Polarization properties have been analyzed for four bursts of our sample. The lower S/N of the rest of the detections did not allow us to obtain robust measurements. One second of frequency-resolved Stokes parameters have been extracted for each burst by using the PSRCHIVE library666http://psrchive.sourceforge.net (Hotan et al., 2004). A one-minute scan of a noise diode was acquired at the beginning of each observation and was used to calibrate the Stokes parameters of the bursts (van Straten et al., 2012). All the bursts have been dedispersed to pc cm-3 for this analysis. Following CHIME/FRB Collaboration et al. (2019b), the rotation measures (RMs) of the bursts have been calculated by using the implementation of rotation measure synthesis (Burn, 1966; Brentjens & de Bruyn, 2005) in the RM-tools package777https://github.com/CIRADA-Tools/RM and the resulting Faraday dispersion function (FDF) was cleaned with the deconvolution algorithm presented by Heald (2009). The FDF of bursts detected on MJD 58836 showed effects of a bad calibration, apparent in the presence of peaks at RM values symmetric about zero. This was solved by using the scan of the noise diode acquired on MJD 58835. The quality of the FDFs, one of which is reported in the bottom of Figure 3, demonstrates the validity of this operation.
The measured RM values are reported in Table 2. On 2018 December 26, the RM for FRB 180916.J0158+65 was measured to be rad m-2 (CHIME/FRB Collaboration et al., 2019b); it therefore shows possible evidence of a decrease of 2–3 rad m-2 over one year. According to the RM model of the ionosphere RMextract (Mevius, 2018), its varying contribution can account for rad m-2. However, systematic effects between GBT and CHIME could account for the remaining discrepancy. Among the GBT bursts, 191219A and 191219B are separated by less than 100 ms. They show the same RM within the errors. Burst 191219C, detected on the same day, also shares the same RM. However, burst 200120A, detected a month later, shows a marginal increase in RM of rad m-2, which is still compatible at level. Therefore, even though the varying contribution of the ionosphere only accounts for rad m-2, we consider the measurements in agreement and more observations are required to detect an eventual evolution of the RM with time.
Each of the bursts has been corrected for its RM and the resulting polarization profiles are reported in Figure 3. Following Everett & Weisberg (2001), we estimate that all the bursts in the sample have a linear polarization fraction larger than 90% and a circular polarization fraction consistent with zero. However, we note that the fractional polarization measurements could be biased, especially for weak bursts.
The time-resolved polarization angle (PA), also shown in Figure 3, is approximately flat within each burst, with reduced values with respect to a straight line ranging between and . Due to the lack of an absolute polarization calibration, we did not attempt to compare PA values for different bursts, except for bursts 191219A and 191219B, which are separated by only 100 ms. Their average PA values are in agreement, with a difference of the weighted PA curves of deg.
It is interesting comparing the polarization properties of FRB 180916.J0158+65 with the other repeating FRB source with a measured RM, FRB 121102 (Michilli et al., 2018). The latter shows an extreme value of Faraday rotation corresponding to an rad m-2, orders of magnitude higher than the value measured for FRB 180916.J0158+65. The RM of FRB 121102 varied by over 7 months, which is not observed for FRB 180916.J0158+65. The flat PA curve within each burst is an interested similarity between the two FRB sources, together with a linear polarization fraction close to 100% and a circular polarization fraction of approximately 0%. The rest of the FRB population shows very diverse polarization properties, with varying RM values, polarization fractions and PA curves (Petroff et al., 2016).
3.4 Periodicity Search
Although the source exhibits a modulation in activity at a 16.35-day period (or possibly a higher-frequency alias), an additional periodicity of the order of milliseconds to seconds might be present if the progenitor is a neutron star (Yang & Zou, 2020; Lyutikov et al., 2020; Ioka & Zhang, 2020) and the bursts come from a narrow range of rotational phases. We use two different methods to search for a periodicity due to stellar rotation. First, we fit the largest common denominator to the differences in arrival times of bursts detected in individual observations, as is done for rotating radio transients (McLaughlin et al., 2006). We did not find any statistically significant periodicities in the two observations having multiple detections (see Table 1). We note that bursts 191219A and 191219B have a separation of 60 ms which is similar to the separation between sub-bursts in two bursts of this source, as noted by CHIME/FRB Collaboration et al. (2019c). However, periods close to 60 ms were not found to be statistically more significant than any other trial periods in the aforementioned analysis. Detection of eight or more bursts in a single observation might be necessary to determine an underlying periodicity, if it exists, with this method (Cui et al., 2017).
For GBT observations in which there were single-pulse detections, we also searched for a rotational periodicity using PRESTO’s Fourier domain acceleration search algorithm, accelsearch. We conducted this search on the same 327.68-s resolution data as the initial single-pulse search, with the same rfifind mask and dedispersed to the same grid of DMs. Initially we searched all DMs using a zmax parameter of 200, implying an acceleration range of m s-2 for a 500 Hz (2 ms) signal. Next, we used the “jerk-search” functionality of accelsearch (Andersen & Ransom, 2018) to search at the nominal DM with a zmax of 100 and a wmax of 500, corresponding to an acceleration range of m s-2 and a jerk range of m s-3 for a 500 Hz signal. Finally, we ran a jerk search for the period of time in the MJD 58836 observation encompassing 10 min around burst 191219B, with a zmax of 100 and a wmax of 500, corresponding to an acceleration range of m s-2 and a jerk range of m s-3 for a 500 Hz signal. The best candidates from all three of these searches were folded using PRESTO’s prepfold and inspected by eye. No convincing periodic astrophysical signals were found.
3.5 Determination of System Sensitivity
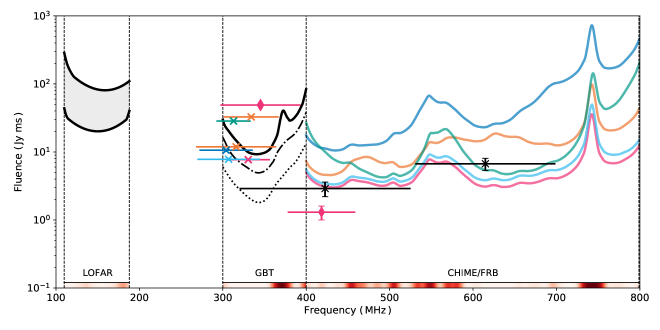
We determine fluence completeness for the CHIME/FRB system at the time of detection of the GBT bursts by expanding on the methods outlined in Josephy et al. (2019). Previously, detection scenarios were generated in a Monte Carlo simulation in order to capture sensitivity variations due to source position along transit, burst spectral shape, and detection epoch. Relative sensitivities for these detection scenarios were translated to fluence thresholds using bandpass-calibrated observations of bursts detected from FRB 180916.J0158+65 by CHIME/FRB Collaboration et al. (2020). In this work, we do not sample the transit position when simulating detection scenarios; instead we examine the instantaneous sensitivity at the time of each GBT burst. This distinction is important for CHIME/FRB, since the sensitivity varies significantly depending on the source’s position within the synthesized beams, as seen in Fig. 4. Furthermore, we compute fluence thresholds for Gaussian bursts of different central frequencies instead of computing band-averaged fluence thresholds. This choice is informed by the bands under consideration having frequency-dependent sensitivity and appreciable RFI contamination due to which the detectability of a given burst varies significantly as it is shifted throughout the band. For burst bandwidths, we uniformly sample from 10–80 MHz (FWHM) to match the observed range.
We extend this analysis to obtain the fluence completeness limit for the GBT observations by swapping in the appropriate bandpass. The frequency response across the band is estimated to be the mean of the counts detected in each frequency channel over all time intervals not flagged for masking. The completeness limit as a function of the central frequency of emission is shown in Figure 4, while the band-averaged 90%-completeness limit is estimated to be 22 Jy ms. In extending the analysis to LOFAR, we determine the frequency response using Equation 1; taking into account the exact number of Core stations used and correcting for the zenith-angle dependence as described by Kondratiev et al. (2016). Since no burst was detected in the LOFAR observations, we use the radiometer equation to construct a fiducial reference burst, which is parameterized as having the mean width of all bursts reported in this work (3.3 ms), a S/N of 7 (detection threshold of the search pipeline), a central frequency of 150 MHz, and a spectral bandwidth of 80 MHz (FWHM). With 18% of channels having some RFI contamination, we take the effective bandwidth to be 64 MHz. Substituting these parameters and a band-averaged sky temperature, receiver temperature and gain in the radiometer equation in the limit of no pulse broadening, this reference scenario gives a fluence detection limit of 21 Jy ms. Considering the same range of Gaussian spectral profiles as above, the band-averaged 90%-completeness limit is estimated to be 24 Jy ms. To account for suppressed detectability due to potential pulse broadening, we repeat this analysis using the upper limit on the scattering timescale of 50 ms at 150 MHz (see §4.1). In this scenario, the band-averaged 90%-completeness becomes 106 Jy ms, assuming a power-law index of 4 for the frequency dependence of scatter-broadening for different spectral profiles. The completeness threshold is significantly higher than that of the GBT due to the high Galactic foreground emission (a sky temperature of 700 K at 150 MHz) at the source position.
4 Discussion
The detection of emission in multiple bursts from FRB 180916.J0158+65 down to the bottom of the GBT band indicates that a cutoff or turnover in the FRB rest-frame spectrum can only exist below a frequency of 300 MHz. Since this source is the closest localized FRB (Marcote et al., 2020), other FRBs could be detectable at frequencies lower than 300 MHz as their rest-frame spectra would be redshifted to even lower frequencies. We note that this conclusion would not apply to the so-far non-repeating FRBs if repeating and non-repeating sources do not share a common emission mechanism. A spectral turnover due to propagation effects in the circumburst environment (Ravi et al., 2019) or scattering combined with a flat spectrum for FRB emission (Chawla et al. 2017) can still render FRBs undetectable at low frequencies. Therefore, detection of emission from this source at 300 MHz can potentially still be consistent with the non-detection of FRBs with several surveys in this frequency range (Deneva et al., 2016; Chawla et al., 2017; Rajwade et al., 2020) if a less dense circumburst environment (see §4.4), low scattering timescale (see §4.1) and the proximity of the source conspire to make its emission particularly detectable.
4.1 Scattering Times
Assuming that the scattering properties of the intervening medium do not change between detections, we report a 95% confidence upper limit of 1.7 ms on the scattering timescale of the source at 350 MHz, improving significantly on the constraint derived from CHIME/FRB observations, 0.9 ms at 600 MHz (which translates to 8 ms at 350 MHz, assuming a power-law frequency dependence of 4; Bhat et al. 2004). An indirect measurement of scattering for this source, 2.7 s at 1.7 GHz, was obtained by Marcote et al. (2020) using the auto-correlation function estimated from a burst spectrum, assuming that the frequency-dependent intensity variations are due to scintillation. This translates to a scattering timescale of 1.5 ms at 350 MHz which is consistent with the GBT measurement. We used the methodology and code employed by Masui et al. (2015) to estimate the auto-correlation function for the spectrum of the brightest burst in our sample (191219C) but find its magnitude small enough to suggest a non-astrophysical origin and be potentially explained by errors in modelling the burst spectrum or in correcting for the receiver bandpass.
Assuming a power-law index of 4, the upper limit on the scattering timescale derived from GBT observations translates to 50 ms at 150 MHz. This suggests that pulse smearing due to scattering alone cannot explain the non-detection with LOFAR, for which observations were searched for bursts with widths up to 0.3 s (see §2.3). Detection of the source at frequencies lower than 300 MHz is essential to obtain an accurate measurement of the scattering timescale. However, the measured upper limit is not inconsistent with that of known FRBs: an FRB discovered by the UTMOST telescope exhibited a scattering timescale of 4.12.7 s at 835 MHz (scales to 0.13 ms at 350 MHz; Farah et al. 2018), suggesting that FRB 180916.J0158+65 is not atypical of the FRB population.
4.2 Phase Dependence of Source Activity
If the periodic modulation of source activity is due to orbital motion, then any inhomogeneities in the source environment can cause some burst properties to be phase-dependent, as suggested by CHIME/FRB Collaboration et al. (2020). Following the approach of CHIME/FRB Collaboration et al. (2020), we compute the phases of all detections and see no monotonic variation in DM, fluence, burst width, scattering timescale or emission frequency with phase or time in the sample of GBT bursts as well as in the overall sample of bursts from the source which includes detections from the CHIME/FRB system and the European Very-long-baseline-interferometry Network (EVN; Marcote et al. 2020). We caution that observations of the source with the GBT did not cover a large fraction of the 5-day-long activity window. Additionally, we note that the aforementioned conclusion would not hold if the true period is not 16.35 days, as the estimated phases for all detections would be incorrect. Detections with the GBT cannot help in ruling out any of the possible higher-frequency aliases of the 16.35-day period, as all observations in which these detections were made were coincident with the transit of the source over the CHIME telescope.
4.3 Frequency Dependence of Source Activity
Six of the seven GBT bursts were not detected with the CHIME/FRB system although their GBT fluences were higher than or, in two cases, comparable to the corresponding 95% confidence fluence threshold (see Figure 4). The burst for which coincident emission was detected was the only GBT burst with emission detected at the top of the band (400 MHz), with a GBT-measured fluence of 48.9 0.3 Jy ms and a fluence in the CHIME band of 1.3 0.3 Jy ms. Coincident detection of only one burst out of a total of ten unique bursts detected by the two instruments during simultaneous observations suggests that emission is restricted to a narrow frequency range for individual bursts (fractional bandwidths of 13–30% were measured for the GBT detections), with the overall source spectrum being highly variable as the center frequency of the individual bursts varies with time. This is consistent with the non-detection of coincident emission from FRB 121102 with the Arecibo telescope at 1.4 GHz and the Very Large Array (VLA) at 3 GHz for several bursts detected in simultaneous observations with the two instruments (Law et al., 2017; Gourdji et al., 2019). Similarly, Hessels et al. (2019) used 1.1–1.7-GHz Arecibo observations to show that FRB 121102 bursts have fractional bandwidths ranging from 7–30% at these frequencies. Longer observations of repeating FRB sources, simultaneously in several observing bands, are required to identify any potential temporal variations in the emission frequency of multiple narrow-band detections.
Based on a total of 3.9 hours of exposure to the source, we estimate the burst rate in the 300–400 MHz frequency range to be bursts hr-1 above a fluence threshold, , of 22 Jy ms, with the uncertainties representing the 95% confidence interval derived assuming Poisson statistics. Since all observations were within a phase window of 0.1 (phases ranging from 0.47 to 0.57; see Figure 1), we compare the GBT-detection rate with the CHIME/FRB measurement in the same phase window, bursts hr-1 above a fluence threshold, , of 5.2 Jy ms (CHIME/FRB Collaboration et al., 2020). We scale the CHIME/FRB detection rate to that expected for a fluence threshold of using a power-law index, , estimated for the differential energy distribution of the source by CHIME/FRB Collaboration et al. (2020) and find that the expected detection rate is consistent with that measured for the GBT. Therefore, we cannot ascertain whether there is a variation in source activity with frequency using a direct comparison of the detection rates in the two bands.
Following Houben et al. (2019), we characterize the frequency dependence of source activity using a statistical spectral index, , which characterizes the power law relating the normalization (A) of the differential energy distribution (dN()/dE = A()Eγ) at different frequencies. The detection rates, and , at two frequencies, and , are then related as,
| (2) |
We estimate , with the reported 95% confidence level uncertainties determined by the range obtained when solving for this parameter in 10,000 simulations of sets of , and , where each is sampled from its Gaussian distribution of mean and range given above. This measurement is consistent within reported uncertainties with the statistical spectral index estimated for FRB 121102 using observations in the frequency range of 1.2–3.5 GHz by Houben et al. (2019). We note that this measurement is robust only if the true period of the source is 16.35 days since a higher-frequency alias would imply that all observations are at phases different than those currently estimated. Moreover, the conclusion also relies on the burst rate being constant in each period of source activity since the GBT detection rate is estimated from observations over three periods as compared to the 20 periods used for the CHIME/FRB measurement. If the aforementioned assumptions hold, then the measurement implies decreasing burst activity with increasing frequency for the source and could explain its non-detection at 1.4 GHz (above a fluence threshold of 0.17 Jy ms) with the Effelsberg telescope in 17.6 hours of exposure during a predicted epoch of activity (CHIME/FRB Collaboration et al., 2020). This conclusion would also be consistent with the spectral index of estimated for the mean spectrum of 23 FRBs detected by the Australian SKA Pathfinder at 1320 MHz (Macquart et al., 2019) with the caveat that the mean spectrum is not redshift-corrected while the statistical spectral index that we evaluate characterizes the rest-frame spectrum of the source.
We did not detect coincident emission with LOFAR at the time of detection of six GBT bursts. Assuming the emission is broadband and that the burst fluence scales with frequency as , we can use the brightest burst in our sample, 191219C, to place a constraint on the spectral index, , of the instantaneous emission from the source. We obtain a lower limit of , which is the spectral index for which the 95% confidence lower bound on the GBT-measured fluence of the burst (see Table 2) would imply a fluence at 150 MHz equal to the 90% completeness fluence threshold of the LOFAR observations (106 Jy ms; see §3.5). However, it could be that coincident emission was suppressed in the LOFAR band not due to the burst having a flat spectrum but rather due to its band-limited nature. In that scenario, non-simultaneous bursts could still have been detected in the LOFAR band during the 1.3 hours of exposure to the source. The non-detection of such bursts could be explained by flattening of the statistical spectrum at low frequencies, as suggested by Houben et al. (2019) for FRB 121102. To investigate the possibility of spectral flattening, we derive a 95% confidence upper limit on the burst rate in the LOFAR band of 2.2 bursts hour-1 above a fluence threshold of 106 Jy ms. We then obtain a 95% confidence lower limit on the statistical spectral index between the GBT and LOFAR bands, . Since this measurement of the statistical spectral index is consistent with that derived by comparing detection rates in the GBT and CHIME bands, we cannot confirm or rule out a flattening of the spectrum at low frequencies.
4.4 Constraints on Proposed Models
The detection of FRB 180916.J0158+65 down to 300 MHz shows that its source’s ambient environment is optically thin to free-free absorption at 300 MHz. For an ionized nebula of size L, and DM 70 pc cm-3 (Marcote et al., 2020), this implies the optical depth due to free-free absorption (Condon & Ransom, 2016),
| (3) |
where is a factor that accounts for the volume-filling factor and the electron density fluctuation in the circumburst medium. If such a nebula circumscribes the FRB 180916.J0158+65 source, our detection implies L 0.02 pc (T/ K)-1.35 which rules out a surrounding dense and compact ionized nebula like a hyper-compact Hii region (Churchwell, 2002) or a young supernova remnant (age 50 yr; Piro 2016). This result is consistent with observations of the source by Marcote et al. (2020) who conclude, based on the measured RM and non-detection of an associated persistent radio source, that FRB 180916.J0158+65 has a much less extreme circumburst environment compared to that of the other localized repeater, FRB 121102. From Equation 3, free-free absorption at frequencies well below 300 MHz seems unlikely to inhibit detectability, so follow-up observations in this regime are warranted in order to constrain the intrinsic FRB spectrum turn-over frequency.
Induced Compton scattering (ICS) can also suppress the observed low-frequency emission from FRBs specifically in models that invoke magnetar giant flares (Lyubarsky, 2014; Beloborodov, 2017; Metzger et al., 2019; Margalit et al., 2019; Levin et al., 2020). In the synchrotron maser model (Metzger et al., 2019; Margalit et al., 2019), FRBs are produced when the decelerating ultra-relativistic shock waves from a flaring hyperactive magnetar interact with the sub-relativistic circumstellar medium (CSM). As the shock propagates into the CSM, ICS attenuates the FRB emission. However, the negative spectral indexes of some of the bursts we have observed for FRB 180916.J0158+65 argue that the optical depth due to ICS, at 300 MHz. The constraint that 1 implies a density upstream from the shock (Kumar & Lu, 2020),
| (4) |
at the deceleration radius rdec, the distance that a relativistic shock travels before half of its energy is dissipated to its ambient medium, 1012 cm (Metzger et al., 2019). Here, L is the isotropic equivalent luminosity of the FRB, t is the burst temporal width, and is the Lorentz factor of the shocked CSM gas. However, the Metzger et al. (2019) model requires an upstream density of 102 cm-3 for the synchrotron maser to be effective; for our optical depth constraint, this requires rdec 1014 cm for the above parameters. Kumar & Lu (2020) have argued that it is difficult to produce FRBs at distances cm because of the requirement of the source luminosity to be erg s-1 for each repeat burst — difficult to obtain even from a hyperactive magnetar. Thus, the detection of FRB 180916.J0158+65 bursts down to 300 MHz challenges some of the assumptions of the maser synchrotron model.
5 Conclusions
We have reported on the detection of emission from the repeating FRB 180916.J0158+65 at frequencies down to 300 MHz. This result implies that any cutoff in the rest-frame FRB spectrum exists at a frequency below 300 MHz, and thus bodes well for future blind surveys for FRBs as well as follow-up observations of repeating FRBs at low radio frequencies. Using burst rates in the GBT band (300–400 MHz) and the CHIME band (400–800 MHz), we compute a statistical spectral index, , to characterize the frequency dependence of source activity. We find , which is consistent with observations of FRB 121102 by Houben et al. (2019) and motivates follow-up observations of other repeating FRBs to determine whether this trend is common to all sources. We do not see any frequency dependence to the polarization fraction in the overall sample of bursts from this source, with the four brightest bursts in the GBT sample being nearly 100% linearly polarized and having a circular polarization fraction consistent with zero.
Our observation strategy of simultaneous coverage with GBT, the CHIME/FRB system and LOFAR allowed for a study of emission from this source over a large range of frequencies. Most bursts detected during these observations had low emission bandwidths (being observable with either the GBT or with CHIME/FRB) with the notable exception of GBT-detected burst 191219C which had a potentially associated sub-burst in the CHIME band. We detected no bursts in the frequency range 110–190 MHz with LOFAR despite performing an extensive search for bursts with narrow emission bandwidths and slow frequency drifts by visually inspecting LOFAR data in a 10-s interval around the arrival times of the GBT bursts. Our constraint on the scattering timescale for the source, 1.7 ms at 350 MHz, rules out the phenomenon of scattering alone as a cause of non-detection of the source with LOFAR. However, we cannot yet say whether the reduced system sensitivity owing to the high sky temperature or a spectral turnover at these frequencies was the cause of the non-detection. More observations of the source at lower frequencies might help determine whether a spectral turnover exists.
In the late stages of writing this paper, we became aware of follow-up observations of the source at 328 MHz with the Sardinia radio telescope by Pilia et al. (2020). Detection of three bursts from the source in these observations is consistent with our conclusions.
References
- Andersen & Ransom (2018) Andersen, B. C., & Ransom, S. M. 2018, ApJ, 863, L13, doi: 10.3847/2041-8213/aad59f
- Bannister et al. (2019) Bannister, K. W., Deller, A. T., Phillips, C., et al. 2019, Science, 365, 565, doi: 10.1126/science.aaw5903
- Bassa et al. (2017) Bassa, C. G., Pleunis, Z., & Hessels, J. W. T. 2017, Astronomy and Computing, 18, 40, doi: 10.1016/j.ascom.2017.01.004
- Beloborodov (2017) Beloborodov, A. M. 2017, The Astrophysical Journal Letters, 843, L26
- Bhat et al. (2004) Bhat, N. D. R., Cordes, J. M., Camilo, F., Nice, D. J., & Lorimer, D. R. 2004, ApJ, 605, 759, doi: 10.1086/382680
- Brentjens & de Bruyn (2005) Brentjens, M. A., & de Bruyn, A. G. 2005, A&A, 441, 1217, doi: 10.1051/0004-6361:20052990
- Burn (1966) Burn, B. J. 1966, MNRAS, 133, 67, doi: 10.1093/mnras/133.1.67
- Chawla et al. (2017) Chawla, P., Kaspi, V. M., Josephy, A., et al. 2017, ApJ, 844, 140, doi: 10.3847/1538-4357/aa7d57
- CHIME/FRB Collaboration et al. (2018) CHIME/FRB Collaboration, Amiri, M., Bandura, K., et al. 2018, ApJ, 863, 48, doi: 10.3847/1538-4357/aad188
- CHIME/FRB Collaboration et al. (2019a) —. 2019a, Nature, 566, 230, doi: 10.1038/s41586-018-0867-7
- CHIME/FRB Collaboration et al. (2019b) CHIME/FRB Collaboration, Andersen, B. C., Bandura, K., et al. 2019b, ApJL, 885, L24, doi: 10.3847/2041-8213/ab4a80
- CHIME/FRB Collaboration et al. (2019c) CHIME/FRB Collaboration, Andersen, B. C., Bandura, K., et al. 2019c, ApJ, 885, L24, doi: 10.3847/2041-8213/ab4a80
- CHIME/FRB Collaboration et al. (2020) CHIME/FRB Collaboration, Amiri, M., Andersen, B. C., et al. 2020, arXiv e-prints, arXiv:2001.10275. https://arxiv.org/abs/2001.10275
- Churchwell (2002) Churchwell, E. 2002, Annual Review of Astronomy and Astrophysics, 40, 27
- Coenen et al. (2014) Coenen, T., van Leeuwen, J., Hessels, J. W. T., et al. 2014, A&A, 570, A60, doi: 10.1051/0004-6361/201424495
- Condon & Ransom (2016) Condon, J. J., & Ransom, S. M. 2016, Essential radio astronomy (Princeton University Press)
- Cordes & Chatterjee (2019) Cordes, J. M., & Chatterjee, S. 2019, ARA&A, 57, 417, doi: 10.1146/annurev-astro-091918-104501
- Cui et al. (2017) Cui, B. Y., Boyles, J., McLaughlin, M. A., & Palliyaguru, N. 2017, ApJ, 840, 5, doi: 10.3847/1538-4357/aa6aa9
- Deneva et al. (2016) Deneva, J. S., Stovall, K., McLaughlin, M. A., et al. 2016, ApJ, 821, 10, doi: 10.3847/0004-637X/821/1/10
- DuPlain et al. (2008) DuPlain, R., Ransom, S., Demorest, P., et al. 2008, Society of Photo-Optical Instrumentation Engineers (SPIE) Conference Series, Vol. 7019, Launching GUPPI: the Green Bank Ultimate Pulsar Processing Instrument, 70191D, doi: 10.1117/12.790003
- Everett & Weisberg (2001) Everett, J. E., & Weisberg, J. M. 2001, ApJ, 553, 341, doi: 10.1086/320652
- Farah et al. (2018) Farah, W., Flynn, C., Bailes, M., et al. 2018, MNRAS, 478, 1209, doi: 10.1093/mnras/sty1122
- Fonseca et al. (2020) Fonseca, E., Andersen, B. C., Bhardwaj, M., et al. 2020, ApJ, 891, L6, doi: 10.3847/2041-8213/ab7208
- Gajjar et al. (2018) Gajjar, V., Siemion, A. P. V., Price, D. C., et al. 2018, ApJ, 863, 2, doi: 10.3847/1538-4357/aad005
- Gourdji et al. (2019) Gourdji, K., Michilli, D., Spitler, L. G., et al. 2019, ApJ, 877, L19, doi: 10.3847/2041-8213/ab1f8a
- Haslam et al. (1982) Haslam, C. G. T., Salter, C. J., Stoffel, H., & Wilson, W. E. 1982, A&AS, 47, 1
- Heald (2009) Heald, G. 2009, in IAU Symposium, Vol. 259, Cosmic Magnetic Fields: From Planets, to Stars and Galaxies, ed. K. G. Strassmeier, A. G. Kosovichev, & J. E. Beckman, 591–602, doi: 10.1017/S1743921309031421
- Hessels et al. (2019) Hessels, J. W. T., Spitler, L. G., Seymour, A. D., et al. 2019, ApJ, 876, L23, doi: 10.3847/2041-8213/ab13ae
- Hotan et al. (2004) Hotan, A. W., van Straten, W., & Manchester, R. N. 2004, PASA, 21, 302, doi: 10.1071/AS04022
- Houben et al. (2019) Houben, L. J. M., Spitler, L. G., ter Veen, S., et al. 2019, A&A, 623, A42, doi: 10.1051/0004-6361/201833875
- Ioka & Zhang (2020) Ioka, K., & Zhang, B. 2020, ApJ, 893, L26, doi: 10.3847/2041-8213/ab83fb
- Josephy et al. (2019) Josephy, A., Chawla, P., Fonseca, E., et al. 2019, ApJ, 882, L18, doi: 10.3847/2041-8213/ab2c00
- Karastergiou et al. (2015) Karastergiou, A., Chennamangalam, J., Armour, W., et al. 2015, MNRAS, 452, 1254, doi: 10.1093/mnras/stv1306
- Kondratiev et al. (2016) Kondratiev, V. I., Verbiest, J. P. W., Hessels, J. W. T., et al. 2016, A&A, 585, A128, doi: 10.1051/0004-6361/201527178
- Kumar & Lu (2020) Kumar, P., & Lu, W. 2020, Monthly Notices of the Royal Astronomical Society
- Kumar et al. (2019) Kumar, P., Shannon, R. M., Osłowski, S., et al. 2019, ApJ, 887, L30, doi: 10.3847/2041-8213/ab5b08
- Law et al. (2017) Law, C. J., Abruzzo, M. W., Bassa, C. G., et al. 2017, ApJ, 850, 76, doi: 10.3847/1538-4357/aa9700
- Levin et al. (2020) Levin, Y., Beloborodov, A. M., & Bransgrove, A. 2020, arXiv preprint arXiv:2002.04595
- Lorimer & Kramer (2004) Lorimer, D. R., & Kramer, M. 2004, Handbook of Pulsar Astronomy, Vol. 4
- Lyubarsky (2014) Lyubarsky, Y. 2014, Monthly Notices of the Royal Astronomical Society: Letters, 442, L9
- Lyutikov et al. (2020) Lyutikov, M., Barkov, M., & Giannios, D. 2020, arXiv e-prints, arXiv:2002.01920. https://arxiv.org/abs/2002.01920
- Macquart et al. (2019) Macquart, J. P., Shannon, R. M., Bannister, K. W., et al. 2019, ApJ, 872, L19, doi: 10.3847/2041-8213/ab03d6
- Marcote et al. (2020) Marcote, B., Nimmo, K., Hessels, J. W. T., et al. 2020, Nature, 577, 190, doi: 10.1038/s41586-019-1866-z
- Margalit et al. (2019) Margalit, B., Metzger, B. D., & Sironi, L. 2019, arXiv preprint arXiv:1911.05765
- Masui et al. (2015) Masui, K., Lin, H.-H., Sievers, J., et al. 2015, Nature, 528, 523, doi: 10.1038/nature15769
- McKinnon (2014) McKinnon, M. M. 2014, PASP, 126, 476, doi: 10.1086/676975
- McLaughlin et al. (2006) McLaughlin, M. A., Lyne, A. G., Lorimer, D. R., et al. 2006, Nature, 439, 817, doi: 10.1038/nature04440
- Metzger et al. (2019) Metzger, B. D., Margalit, B., & Sironi, L. 2019, Monthly Notices of the Royal Astronomical Society, 485, 4091
- Mevius (2018) Mevius, M. 2018, RMextract: Ionospheric Faraday Rotation calculator. http://ascl.net/1806.024
- Michilli et al. (2018) Michilli, D., Seymour, A., Hessels, J. W. T., et al. 2018, Nature, 553, 182, doi: 10.1038/nature25149
- Petroff et al. (2019) Petroff, E., Hessels, J. W. T., & Lorimer, D. R. 2019, A&A Rev., 27, 4, doi: 10.1007/s00159-019-0116-6
- Petroff et al. (2016) Petroff, E., Barr, E. D., Jameson, A., et al. 2016, PASA, 33, e045, doi: 10.1017/pasa.2016.35
- Pilia et al. (2020) Pilia, M., Burgay, M., Possenti, A., et al. 2020, arXiv e-prints, arXiv:2003.12748. https://arxiv.org/abs/2003.12748
- Piro (2016) Piro, A. L. 2016, The Astrophysical Journal Letters, 824, L32
- Platts et al. (2019) Platts, E., Weltman, A., Walters, A., et al. 2019, Phys. Rep., 821, 1, doi: 10.1016/j.physrep.2019.06.003
- Prochaska et al. (2019) Prochaska, J. X., Macquart, J.-P., McQuinn, M., et al. 2019, Science, 366, 231, doi: 10.1126/science.aay0073
- Rajwade et al. (2020) Rajwade, K., Mickaliger, M., Stappers, B., et al. 2020, Monthly Notices of the Royal Astronomical Society
- Ransom (2001) Ransom, S. M. 2001, PhD thesis, Harvard University
- Ravi (2019) Ravi, V. 2019, Nature Astronomy, 3, 928, doi: 10.1038/s41550-019-0831-y
- Ravi et al. (2019) Ravi, V., Catha, M., D’Addario, L., et al. 2019, Nature, 572, 352, doi: 10.1038/s41586-019-1389-7
- Remazeilles et al. (2015) Remazeilles, M., Dickinson, C., Banday, A. J., Bigot-Sazy, M. A., & Ghosh, T. 2015, MNRAS, 451, 4311, doi: 10.1093/mnras/stv1274
- Scholz et al. (2016) Scholz, P., Spitler, L. G., Hessels, J. W. T., et al. 2016, ApJ, 833, 177, doi: 10.3847/1538-4357/833/2/177
- Seymour et al. (2019) Seymour, A., Michilli, D., & Pleunis, Z. 2019, DM_phase: Algorithm for correcting dispersion of radio signals. http://ascl.net/1910.004
- Sokolowski et al. (2018) Sokolowski, M., Bhat, N., Macquart, J.-P., et al. 2018, The Astrophysical Journal Letters, 867, L12
- Spitler et al. (2016) Spitler, L. G., Scholz, P., Hessels, J. W. T., et al. 2016, Nature, 531, 202, doi: 10.1038/nature17168
- Stappers et al. (2011) Stappers, B. W., Hessels, J. W. T., Alexov, A., et al. 2011, A&A, 530, A80, doi: 10.1051/0004-6361/201116681
- Tendulkar et al. (2017) Tendulkar, S. P., Bassa, C. G., Cordes, J. M., et al. 2017, ApJ, 834, L7, doi: 10.3847/2041-8213/834/2/L7
- Tingay et al. (2015) Tingay, S. J., Trott, C. M., Wayth, R. B., et al. 2015, AJ, 150, 199, doi: 10.1088/0004-6256/150/6/199
- van Haarlem et al. (2013) van Haarlem, M. P., Wise, M. W., Gunst, A. W., et al. 2013, A&A, 556, A2, doi: 10.1051/0004-6361/201220873
- van Straten et al. (2012) van Straten, W., Demorest, P., & Oslowski, S. 2012, Astronomical Research and Technology, 9, 237. https://arxiv.org/abs/1205.6276
- Yang & Zou (2020) Yang, H., & Zou, Y.-C. 2020, arXiv e-prints, arXiv:2002.02553. https://arxiv.org/abs/2002.02553