Imaging and localizing individual atoms interfaced with a nanophotonic waveguide
Abstract
Single particle-resolved fluorescence imaging is an enabling technology in cold-atom physics. However, so far, this technique was not available for nanophotonic atom–light interfaces. Here, we image single atoms that are trapped and optically interfaced using an optical nanofiber. Near-resonant light is scattered off the atoms and imaged while counteracting heating mechanisms via degenerate Raman cooling. We detect trapped atoms within and record image sequences of given atoms. Building on our technique, we perform two experiments which are conditioned on the number and position of the nanofiber-trapped atoms. We measure the transmission of nanofiber-guided resonant light and verify its exponential scaling in the few-atom limit, in accordance with Beer-Lambert’s law. Moreover, depending on the interatomic distance, we observe interference of the fields that two simultaneously trapped atoms emit into the nanofiber. The demonstrated technique enables post-selection and possible feedback schemes and thereby opens the road towards a new generation of experiments in quantum nanophotonics.
Engineering light-matter interaction at the level of single atoms and photons is one of the main pursuits in quantum optics. Over the last decade, various techniques have been developed for trapping and optically interfacing atoms using nanophotonic devices Vetsch et al. (2010); Thompson et al. (2013); Goban et al. (2015); Kato and Aoki (2015); Lee et al. (2015); Nayak et al. (2019). By tailoring the nanophotonic mode structure, e.g., via bandgaps or resonances, the interaction between the atoms and the mode can be engineered and enhanced. Therefore, nanophotonic systems offer intriguing and often unique opportunities Chang et al. (2018). For example, they can be used to study strong light-matter coupling in an integrated setting Thompson et al. (2013); Kato and Aoki (2015) and in unconventional parameter regimes Dareau et al. (2018); Johnson et al. (2019). Moreover, chiral light–matter interaction occurs naturally near nanophotonic structures Lodahl et al. (2017), and several building blocks for future quantum networks have already been demonstrated using nanophotonic, fiber-integrated cold-atom systems Nayak et al. (2009); Sayrin et al. (2015); Gouraud et al. (2015); Corzo et al. (2019).
Recently, the dynamics of the number of nanofiber-trapped atoms in a large ensemble has been measured using heterodyne detection Béguin et al. (2014), and the preparation of atoms in the motional ground state of a nanofiber-based trap has been demonstrated Meng et al. (2018). Two important next steps in order to further enhance the control of atoms near nanophotonic structures are to image and to address the atoms individually. For free-space optical tweezers and lattices, many remarkable scientific results have been enabled by such techniques Bergamini et al. (2004); Meschede and Rauschenbeutel (2006); Bakr et al. (2009); Weitenberg et al. (2011); Cheuk et al. (2015); Bernien et al. (2017); Barredo et al. (2018). Imaging and addressing single atoms is even more challenging in nanophotonic cold-atom systems: There, scattering of the excitation light by the nearby nanophotonic structure hampers the detection of the fluorescing atoms. Moreover, Raman-scattering of trapping laser fields in the waveguide material can produce additional near-resonant background light. Recently, imaging of a single trapped atom that is placed in close vicinity of but not yet coupled to a nanophotonic circuit has been demonstrated Kim et al. (2019). In addition, images of atoms that are trapped in optical tweezer arrays at a distance of from a photonic crystal waveguide have been recorded Béguin et al. (2020). Furthermore, the fluorescence of a single trapped atom has been detected with a nanofiber-based cavity Nayak et al. (2019).
In this work, we demonstrate imaging of individual atoms that are trapped and optically interfaced using the evanescent field surrounding an optical nanofiber Vetsch et al. (2010). The imaging is performed by means of light that the atoms emit during degenerate Raman cooling (DRC) Lester et al. (2014). The cooling prepares the atoms both in a well-defined internal state and keeps them close to the motional ground state of the trap. Our imaging capability then allows us to post-select experimental runs on the number of trapped atoms. In this way, we determine the transmission of a resonant light field through the nanofiber as a function of the atom number. This allows us to directly measure the extinction per nanofiber-coupled atom. Moreover, by measuring the power of the light that two trapped atoms emit into the nanofiber, we observe interference as a function of the atom–atom distance.
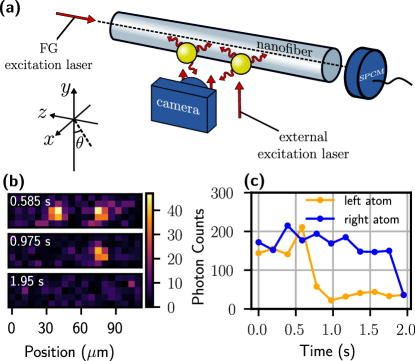
The core elements of the experiment are shown in Fig. 1(a). We use a red-detuned standing-wave and a blue-detuned running-wave nanofiber-guided light field to trap laser-cooled cesium atoms in two diametric linear arrays of potential minima in the evanescent field surrounding the nanofiber Le Kien et al. (2004); Vetsch et al. (2010). The diameter of the nanofiber is , and the red-detuned field has a free-space wavelength of and a total power of . The spatial period of the arrays is Kien et al. (2004). The blue-detuned field has a power of and a free-space wavelength of . This reduces the Raman scattering background by a factor of 7 compared to previous settings Vetsch et al. (2010); Stolen et al. (1984). The light that is scattered by the atoms is collected with a microscope objective placed inside of the vacuum chamber (NA=0.29, working distance ) Alt (2002). An additional lens outside of the vacuum chamber (focal length ) images the atoms onto a camera (Andor iXon Ultra 897). The magnification of the imaging system is , and the point spread function (PSF) has a measured -radius of . A band-pass filter (Semrock MaxLine) and a long-pass filter (Semrock EdgeBasic) are used to further reduce the background.
The atoms are loaded from a magneto-optical trap into the nanofiber-based trap using an optical molasses stage Vetsch et al. (2010). This probabilistically populates both diametric arrays with at most one atom per trapping site Schlosser et al. (2001). We remove atoms from the array behind the nanofiber using side-selective degenerate Raman heating Meng et al. (2018). From the remaining ensemble, we only keep atoms that fall into the field of view of the imaging system. This is achieved by performing DRC with an external laser beam of diameter for , i.e., for a time much longer than the 50-ms trap lifetime without cooling. Atoms outside of this range are thus lost. We then take images with a larger excitation beam-diameter of about , thereby evenly illuminating the atoms (see SM). This beam propagates along the quantization axis (), is -polarized, and has a detuning of with respect to the D2 cycling transition. Here, is the linewidth of the D2 transition. In addition to generating scattered light for imaging, these settings are chosen to perform continuous DRC of the trapped atoms, thereby counteracting recoil and other heating mechanisms Hümmer et al. (2019).
In Fig. 1(b), we present examples out of a series of images of nanofiber-trapped atoms that is obtained in one experimental run. In the upper panel (at time s after the start of the imaging series), two regions of pixels with a large number of counts are apparent. Each bright region shows light that stems from a single atom. The middle panel shows an image taken later. One atom is still present while the other one has been lost from the trap. Even later ( s), both atoms are lost (bottom panel). The series of images from which Fig. 1(b) was extracted is shown in the SM. We note that the 150-ms exposure time is shorter than the typical lifetime of the atoms when cooling is applied ( ). In Fig. 1(c), we analyze the same series of images by summing the relevant photon counts. The yellow (blue) symbols show this signal as a function of time, corresponding to the atom on the left (right). About counts per exposure are observed for each atom, dropping to significantly smaller values when the atom is lost.
We present a detailed analysis of the performance of our imaging procedure in the SM. For the case of integration time, an atom that is in the trap during the full exposure time is detect with a probability of . False detection, i.e., erroneously finding one or more atoms although there are no atoms in the trap, occurs in % of the cases. Atoms can also be lost from the trap while imaging. We infer that the probability of detecting a trapped atom and then losing it by the end of the image integration time is . Moreover, we present images with only integration time including an animated image series as well as images taken with nanofiber-guided instead of external excitation light in the SM. Our analysis and the examples for different implementations of the imaging show that our method is reliable and can be applied in a variety of ways. The comparably large experimentally determined PSF of our imaging system limits the number of atoms that can be spatially resolved to be on the order of ten for the given section () along the nanofiber over which atoms are prepared. This could be improved, e.g., by refined alignment of the imaging system and a microscope objective with larger NA.
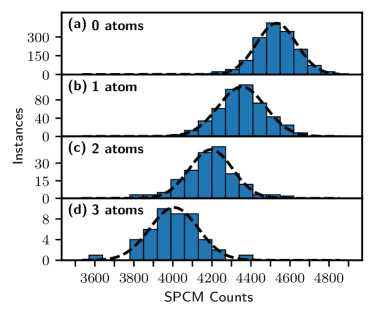
We carry out two experiments that employ our capability of determining the number of atoms trapped along the nanofiber. First, we study the transmission of a resonant guided probe field as a function of the number of atoms in the trap. The transmitted light is detected with a single photon counting module (SPCM, Excelitas SPCM-AQRH-14-FC), see Fig. 1(a). In order to further reduce the background photon level arising from Raman scattering of the guided trapping laser fields, we filter the light that is sent to the SPCM using a combination of spectral filters as well as a narrow-band Fabry-Pérot filter cavity. The combined transmission of the signal through the filtering system is %. The background SPCM count rate after filtering is . The nanofiber-guided probe light is quasi-linearly polarized in the plane of the trapped atoms and also performs DRC Meng et al. (2018), thereby maximizing the interrogation time. However, it turns out that the DRC with resonant nanofiber-guided light is not quite as effective. Therefore, in order to still cool the atoms and to obtain good counting statistics for the resonant transmission measurement, we use an interleaved experimental scheme: We illuminate the atoms, alternating between the guided resonant probe light field and an external DRC laser beam, which is detuned by . The probing lasts and the cooling , and we repeat the probing/cooling-cycle 450 times per experimental run. At the end of each experimental run, we also determine the rate of detected probe photons that are transmitted through the setup in the absence of atoms. This number is then used in order to correct for drifts.
Figure 2 shows the outcome of this transmission measurement. In (a), zero atoms are observed on the camera, and the histogram shows a distribution that is peaked at SPCM counts. Panels (b), (c), and (d) show the histograms for one, two, and three atoms observed on the camera, respectively. A shift of the SPCM count distribution to lower values by more than with every additional atom is apparent. We calculate the mean SPCM counts, , for atoms. With each additional atom, we find that the mean extinction increases by ={0.039(1), 0.039(1), 0.043(3)}, where . The values are constant within the error and, thus, in agreement with Beer-Lambert law. The mean extinction per atom is consistent with the prediction for an atom–fiber surface distance of , which agrees well with the expected position of the trap minimum given the laser configuration used in our experiment.
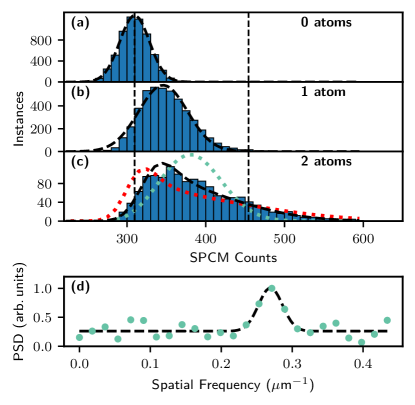
In a second experiment, we study the scattering of an external light field by single as well as pairs of trapped atoms into the nanofiber-guided mode. Figure 3 shows histograms of the SPCM counts. In (a), no atom is observed on the camera. The corresponding peak in the histogram of the SPCM counts thus characterizes the background (a Gaussian fit yields counts, counts). Panel (b) shows the histogram of the SPCM counts conditioned on the observation of one atom with the camera. Compared to (a), the peak is clearly shifted to higher values because of the additional light that the atom scatters into the nanofiber-guided mode. A Gaussian fit yields counts, counts. The width of the distribution in (a) is almost shot-noise limited, i.e., . The width in (b), however, is about 70 % larger than what is expected from Poissonian statistics. We attribute this to shot-to-shot variations of the atom–nanofiber coupling rate, of the intensity of the excitation laser beam (see SM), and of the transmission of the filter cavity because of frequency drifts.
In Fig. 3 (c), the light scattered into the nanofiber by two atoms is analyzed. We observe a photon count distribution which is qualitatively different from the one-atom case. For our parameters, we expect the scattering of the excitation light field by the atoms to be mainly coherent (saturation parameter ), i.e., the scattered light fields will interfere constructively or destructively, depending on their relative phase. For a given fixed angle between the collimated excitation laser beam and the fiber axis, this relative phase is set by the atom–atom distance along the nanofiber. In the experiment, the relative phases of the scattered light fields are evenly sampled in the interval , see SM. We now first assume that the amplitudes of the fields scattered by the two atoms onto the SPCM, though varying from shot to shot, are always equal to each other. Such common mode variations are to be expected, e.g., from drifts of the filter cavity, the excitation laser power, or the trapping potential. The red dotted line in Fig. 3 (c) shows the predicted distribution of SPCM counts in this case. The distribution is normalized such that it has the same total number of instances as the experimental data. The underlying calculation takes into account the background signal inferred from (a) and the single-atom signal from (b). We attribute the deviation between the experimental data in (c) and this theory prediction to differential mode variations of the amplitudes of the fields scattered by the two atoms onto the SPCM. Such differential mode variations are to be expected from, e.g., an out-of-phase thermal motion of the two atoms in the radial direction of the trapping potential and a corresponding variation of the atom–nanofiber coupling strengths. In the extreme case of an on–off modulation of the coupling strengths, this leads to a distribution of SPCM counts, which effectively corresponds to the incoherent sum of the two single atom signals (green dotted line in (c)). Also this theory prediction deviates from the experimental data. Taking into account both common mode and differential mode variations and fitting their weight, we find very good agreement between the predicted distribution of SPCM counts and the experimental data for 71 % common-mode and 29 % differential-mode variations (black dashed line).
In order to further analyze the measurement results that underlie the histogram in (c), we now determine the distance between the two atoms for each experimental run from three consecutive images. For this purpose, we vertically integrate images showing two atoms and then fit the result with the sum of two spatially offset one-dimensional Gaussians, yielding an estimate for the atom–atom distance. Assuming a Gaussian PSF with a 1/e-radius of 10 , see above, the statistical error of this distance estimation is about Alberti et al. (2016). We now examine the dependence of the SPCM counts on the atom–atom distance. To this end, we perform a Fourier transform of this signal and obtain the power spectrum shown in (d). A peak at a spatial frequency of , determined using a Gaussian fit, is visible. This corresponds to a predominant spatial modulation period of , in good agreement with our expectations (see SM).
Summarizing, our demonstrated capability of in situ imaging and precision localization of single atoms significantly enriches the experimental toolbox for nanophotonic cold-atom systems. Here, beyond observing individual atoms in our nanofiber-based trap, it allowed us to perform an atom number-resolved measurement of the transmission of nanofiber-guided light and to thereby test Beer-Lambert’s law atom by atom. Furthermore, our technique enabled us to study the collective scattering of light by two quantum emitters into a single-mode waveguide and to reveal the interference of the scattered fields.
These results provide an excellent basis for future experimental studies of collective, waveguide-mediated effects Stannigel et al. (2012); Ramos et al. (2014); González-Tudela et al. (2015); Shahmoon et al. (2016). For example, they may allow one to study sub- and superradiance Solano et al. (2017) with an exactly known number of waveguide-coupled emitters. Moreover, imaging is an asset, for example, for the investigation of self-organization of quantum emitters along waveguides Chang et al. (2013); Grießer and Ritsch (2013), including in the chiral domain Holzmann et al. (2014); Eldredge et al. (2016), and for the study of novel optical forces Sukhov et al. (2015); Rodríguez-Fortuño et al. (2015); Scheel et al. (2015); Kalhor et al. (2016). Single-site resolved imaging in nanophotonic cold atom systems such as the one studied here could become possible by using an imaging system with a larger NA, imaging light with a shorter wavelength, or by implementing super resolution techniques for trapped cold atoms Subhankar et al. (2019); McDonald et al. (2019). Finally, our results pave the way towards position-resolved real-time feedback and may enable the step-by-step assembly of cold atom-based nanophotonic quantum devices Chang et al. (2018); Samutpraphoot et al. (2020).
Acknowledgements.
We thank D. Weiss for contributions in the early stage of this project. Financial support from the Austrian Academy of Sciences (ÖAW, ESQ Discovery Grant Quantsurf), the Austrian Science Fund (FWF, DK CoQuS, Project No. W 1210-N16), and the European Union’s Horizon 2020 research and innovation program under grant agreement No. 800942 (ErBeStA) is gratefully acknowledged.References
- Vetsch et al. (2010) E. Vetsch, D. Reitz, G. Sagué, R. Schmidt, S. T. Dawkins, and A. Rauschenbeutel, Phys. Rev. Lett. 104, 203603 (2010).
- Thompson et al. (2013) J. D. Thompson, T. G. Tiecke, N. P. de Leon, J. Feist, A. V. Akimov, M. Gullans, A. S. Zibrov, V. Vuletic, and M. D. Lukin, Science 340, 1202 (2013).
- Goban et al. (2015) A. Goban, C.-L. Hung, J. D. Hood, S.-P. Yu, J. A. Muniz, O. Painter, and H. J. Kimble, Phys. Rev. Lett. 115, 063601 (2015).
- Kato and Aoki (2015) S. Kato and T. Aoki, Phys. Rev. Lett. 115, 093603 (2015).
- Lee et al. (2015) J. Lee, J. Grover, J. Hoffman, L. Orozco, and S. Rolston, J. Phys. B: At., Mol. and Opt. Phys. 48, 165004 (2015).
- Nayak et al. (2019) K. P. Nayak, J. Wang, and J. Keloth, Phys. Rev. Lett. 123, 213602 (2019).
- Chang et al. (2018) D. E. Chang, J. S. Douglas, A. González-Tudela, C.-L. Hung, and H. J. Kimble, Rev. Mod. Phys. 90, 031002 (2018).
- Dareau et al. (2018) A. Dareau, Y. Meng, P. Schneeweiss, and A. Rauschenbeutel, Phys. Rev. Lett. 121, 253603 (2018).
- Johnson et al. (2019) A. Johnson, M. Blaha, A. E. Ulanov, A. Rauschenbeutel, P. Schneeweiss, and J. Volz, Phys. Rev. Lett. 123, 243602 (2019).
- Lodahl et al. (2017) P. Lodahl, S. Mahmoodian, S. Stobbe, A. Rauschenbeutel, P. Schneeweiss, J. Volz, H. Pichler, and P. Zoller, Nature 541, 473 (2017).
- Nayak et al. (2009) K. P. Nayak, F. Le Kien, M. Morinaga, and K. Hakuta, Phys. Rev. A 79, 021801 (2009).
- Sayrin et al. (2015) C. Sayrin, C. Clausen, B. Albrecht, P. Schneeweiss, and A. Rauschenbeutel, Optica 2, 353 (2015).
- Gouraud et al. (2015) B. Gouraud, D. Maxein, A. Nicolas, O. Morin, and J. Laurat, Phys. Rev. Lett. 114, 180503 (2015).
- Corzo et al. (2019) N. V. Corzo, J. Raskop, A. Chandra, A. S. Sheremet, B. Gouraud, and J. Laurat, Nature 566, 359 (2019).
- Béguin et al. (2014) J.-B. Béguin, E. Bookjans, S. Christensen, H. Sørensen, J. Müller, E. Polzik, and J. Appel, Phys. Rev. Lett. 113, 263603 (2014).
- Meng et al. (2018) Y. Meng, A. Dareau, P. Schneeweiss, and A. Rauschenbeutel, Phys. Rev. X 8, 031054 (2018).
- Bergamini et al. (2004) S. Bergamini, B. Darquié, M. Jones, L. Jacubowiez, A. Browaeys, and P. Grangier, JOSA B 21, 1889 (2004).
- Meschede and Rauschenbeutel (2006) D. Meschede and A. Rauschenbeutel, Adv. At., Mol. and Opt. Phys. 53, 75 (2006).
- Bakr et al. (2009) W. S. Bakr, J. I. Gillen, A. Peng, S. Fölling, and M. Greiner, Nature 462, 74 (2009).
- Weitenberg et al. (2011) C. Weitenberg, M. Endres, J. F. Sherson, M. Cheneau, P. Schauß, T. Fukuhara, I. Bloch, and S. Kuhr, Nature 471, 319 (2011).
- Cheuk et al. (2015) L. W. Cheuk, M. A. Nichols, M. Okan, T. Gersdorf, V. V. Ramasesh, W. S. Bakr, T. Lompe, and M. W. Zwierlein, Phys. Rev. Lett. 114, 193001 (2015).
- Bernien et al. (2017) H. Bernien, S. Schwartz, A. Keesling, H. Levine, A. Omran, H. Pichler, S. Choi, A. S. Zibrov, M. Endres, and M. Greiner, Nature 551, 579 (2017).
- Barredo et al. (2018) D. Barredo, V. Lienhard, S. De Leseleuc, T. Lahaye, and A. Browaeys, Nature 561, 79 (2018).
- Kim et al. (2019) M. E. Kim, T.-H. Chang, B. M. Fields, C.-A. Chen, and C.-L. Hung, Nature Comm. 10, 1647 (2019).
- Béguin et al. (2020) J.-B. Béguin, A. P. Burgers, X. Luan, Z. Qin, S. P. Yu, and H. J. Kimble, Optica 7, 1 (2020).
- Lester et al. (2014) B. Lester, A. Kaufman, and C. Regal, Phys. Rev. A 90, 011804 (2014).
- Le Kien et al. (2004) F. Le Kien, V. I. Balykin, and K. Hakuta, Phys. Rev. A 70, 063403 (2004).
- Kien et al. (2004) F. L. Kien, J. Liang, K. Hakuta, and V. Balykin, Opt. Comm. 242, 445 (2004).
- Stolen et al. (1984) R. H. Stolen, C. Lee, and R. Jain, JOSA B 1, 652 (1984).
- Alt (2002) W. Alt, Optik 113, 142 (2002).
- Schlosser et al. (2001) N. Schlosser, G. Reymond, I. Protsenko, and P. Grangier, Nature 411, 1024 (2001).
- Hümmer et al. (2019) D. Hümmer, P. Schneeweiss, A. Rauschenbeutel, and O. Romero-Isart, Phys. Rev. X 9, 041034 (2019).
- Alberti et al. (2016) A. Alberti, C. Robens, W. Alt, S. Brakhane, M. Karski, R. Reimann, A. Widera, and D. Meschede, New J. Phys. 18, 053010 (2016).
- Stannigel et al. (2012) K. Stannigel, P. Rabl, and P. Zoller, New Journal of Physics 14, 063014 (2012).
- Ramos et al. (2014) T. Ramos, H. Pichler, A. J. Daley, and P. Zoller, Phys. Rev. Lett. 113, 237203 (2014).
- González-Tudela et al. (2015) A. González-Tudela, V. Paulisch, D. E. Chang, H. J. Kimble, and J. I. Cirac, Phys. Rev. Lett. 115, 163603 (2015).
- Shahmoon et al. (2016) E. Shahmoon, P. Grišins, H. P. Stimming, I. Mazets, and G. Kurizki, Optica 3, 725 (2016).
- Solano et al. (2017) P. Solano, P. Barberis-Blostein, F. K. Fatemi, L. A. Orozco, and S. L. Rolston, Nature Comm. 8, 1857 (2017).
- Chang et al. (2013) D. E. Chang, J. I. Cirac, and H. J. Kimble, Phys. Rev. Lett. 110, 113606 (2013).
- Grießer and Ritsch (2013) T. Grießer and H. Ritsch, Phys. Rev. Lett. 111, 055702 (2013).
- Holzmann et al. (2014) D. Holzmann, M. Sonnleitner, and H. Ritsch, Eur. Phys. J. D 68, 1 (2014).
- Eldredge et al. (2016) Z. Eldredge, P. Solano, D. Chang, and A. V. Gorshkov, Phys. Rev. A 94, 053855 (2016).
- Sukhov et al. (2015) S. Sukhov, V. Kajorndejnukul, R. R. Naraghi, and A. Dogariu, Nature Phot. 9, 809 (2015).
- Rodríguez-Fortuño et al. (2015) F. J. Rodríguez-Fortuño, N. Engheta, A. Martínez, and A. V. Zayats, Nature Comm. 6 (2015).
- Scheel et al. (2015) S. Scheel, S. Y. Buhmann, C. Clausen, and P. Schneeweiss, Phys. Rev. A 92, 043819 (2015).
- Kalhor et al. (2016) F. Kalhor, T. Thundat, and Z. Jacob, Appl. Phys. Lett. 108, 061102 (2016).
- Subhankar et al. (2019) S. Subhankar, Y. Wang, T.-C. Tsui, S. L. Rolston, and J. V. Porto, Phys. Rev. X 9, 021002 (2019).
- McDonald et al. (2019) M. McDonald, J. Trisnadi, K.-X. Yao, and C. Chin, Phys. Rev. X 9, 021001 (2019).
- Samutpraphoot et al. (2020) P. Samutpraphoot, T. Djordjevic, P. L. Ocola, H. Bernien, C. Senko, V. Vuletic, and M. D. Lukin, Phys. Rev. Lett. 124, 063602 (2020).