Position Reconstruction Using Photon Timing for the DEAP-3600 Dark Matter Experiment
Abstract
DEAP-3600 is a single-phase liquid argon dark matter detector being operated 2 km underground at SNOLAB, Sudbury, Canada. The detector consists of 3.3 tonnes of ultra-pure liquid argon in a spherical acrylic cryostat instrumented with 255 photomultiplier tubes. Natural radioactive contamination in the acrylic vessel or TPB wavelength shifter can alpha-decay. Reconstruction of the position of the interactions taking place in the detector uses information about the number of photoelectrons detected in each PMT and when they were detected. Including this information in our suite of cuts allows us to identify and remove almost all surface background events. A method of event position reconstruction emphasizing photon timing is presented here.
1 DEAP-3600 experiment
DEAP-3600 is a single-phase liquid argon (LAr) direct-detection dark matter experiment, located underground at SNOLAB, Sudbury, Canada. It has been collecting data since August, 2016. The detector contains a 3.3 tonne LAr target mass in a spherical acrylic vessel (AV) with an inner radius of , viewed by 255 inward-facing photomultiplier tubes (PMTs) optically coupled to long acrylic light guides (LGs). The top of the AV is filled with gaseous argon (GAr), and leads to an acrylic neck with a cooling coil and a set of acrylic flowguides (FGs). The inner surface of the AV is coated with a layer of 1,1,4,4-tetraphenyl-1,3-butadiene (TPB) that converts LAr scintillation light to visible wavelengths with a spectrum that peaks at . At these wavelengths, the light can travel through the AV and LGs and be detected by the PMTs. For a more detailed description of the detector see [1].
Fiducialization and surface background rejection rely on position reconstruction. DEAP-3600 uses two complementary position reconstruction algorithms. One is a photoelectron (PE)-based algorithm, which fits the spatial distribution of PMT charge with the model distribution of PEs detected by each PMT for different test event positions, pre-trained by a Monte Carlo simulation of the detector. The other is a time-of-flight-based algorithm, which uses both spatial and timing information of the hits in the first to fit the position. This should be compared with the PE-based algorithm that uses both prompt and late light and is based on the way that intensity drops off with distance. In the WIMP search analysis with the 231-day exposure dataset published in 2019 [1], we have used the PE-based algorithm for fiducialization, and used the time-of-flight-based algorithm to remove backgrounds induced by -decays from the AV neck.
2 Time-of-flight-based position reconstruction algorithm
The time-of-flight (TOF)-based position reconstruction algorithm takes advantage of the finite speed of light propagation to the PMTs. The group velocity of UV light at a wavelength of in LAr is known to be [2], while that of visible light at a wavelength of is [3]. Both values are used in the TOF-based algorithm. A test with the values of group velocities varying by 5% has resulted in negligible effect on position reconstruction resolution.
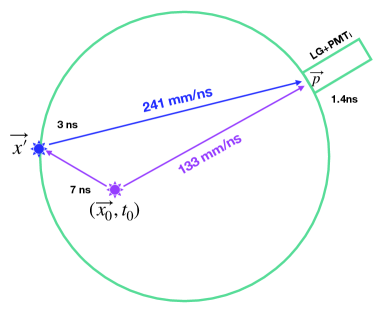
The algorithm is based on an simplified optical model, demonstrated in the left panel of Figure 1. For a scintillation interaction event taking place at event time and position in LAr, the arrival time of a photon at a PMT can be calculated as
| (2.1) |
in which is the TOF from the event vertex to position , defined as the center of the LG front surface. spreads by a random time, which is based on three physical processes: singlet decay with time constant [4], TPB re-emission with time constant , and propagation in LG and PMT response with total uncertainty in time . The average TOF for light propagation in LG and the PMT response time are removed by calibration, so we effectively treat the front surface of LGs as where the light is detected. The spread due to the LG light propagation and the PMT response times are included into the random time delay term. The digitizer samples at , but the analog electronics were designed to allow significantly better resolution, which is dominated by the PMT response time and has been measured to be . [5]
A primary photon can be absorbed by TPB when it reaches a point on the AV surface, re-emitted with the wavelength shifted to , and travel with the greater group velocity to reach a LG front point . The TOF can be calculated as
| (2.2) |
where and are the group velocity of the UV light and that of the visible light in LAr, respectively. When a photon of UV light is reaching the LG front directly from the scintillation vertex , it can be considered as , then only the TOF of UV contributes to the above equation. Reflections and scattering of visible photons in TPB, as well as Rayleigh scattering in the LAr, are neglected.
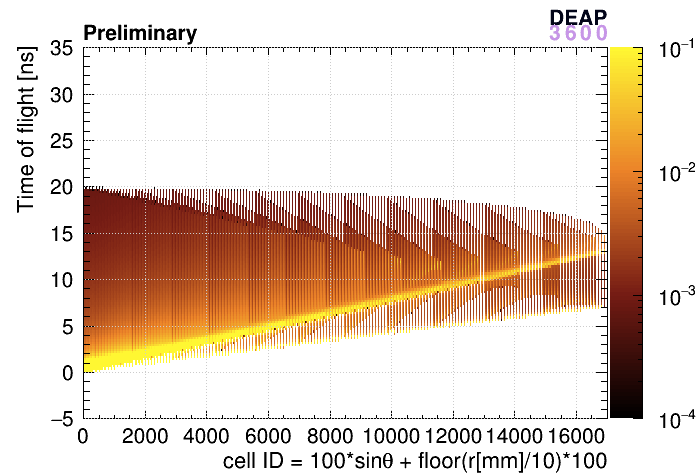
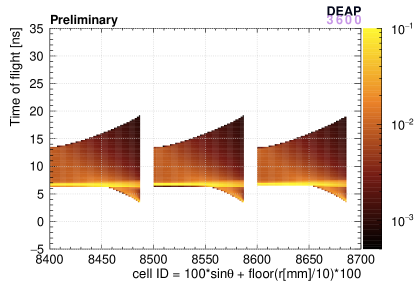
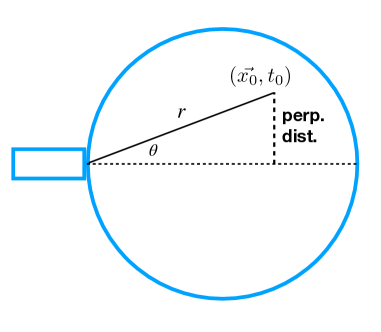
The probability density functions (PDFs) are constructed for an arbitrary PMT/LG assembly, in a coordinate system where the origin is the center of LG front surface. The event position is represented as its distance to the origin, , and sine of the opposite angle of the perpendicular distance to the axis, , as shown in the right panel of Figure 1. Then cells (testing points) are deployed at every in , and at every 0.01 in . For each cell, the TOF distribution is determined with numerical calculation, integrating Eq. 2.2 with respect to over the whole AV surface. The resulting PDFs are shown in Figure 2 as a two-dimensional histogram, with -axis as the TOF and -axis as cell ID, with the definition shown in the label of -axis. In the overall histogram (left panel) the bright strip represents the time when the majority of the UV light arrives, as it is proportional to distance. Other features represent the distribution of visible light emitted by TPB on AV surface. The right panel shows part of this histogram from cell ID 8,400 to 8,700. The three pieces represent three distance values , , and that are typical and equivalent from the center to the surface of the AV. The spread of each piece represents varying from 0.00 to 0.99. For large values of , there is light arriving earlier than the majority of the UV light, because these cells are close to the surface, producing early TPB light traveling faster than the UV light. The PDF can be noted as , a function of TOF with cell position as parameters.
The likelihood of a given event time and test position is computed as
| (2.3) |
where is the time at which the th PE was detected in channel PMTi; the in the first 40 ns are accounted for this calculation. The configuration of and PMTi is transformed to cell position . This algorithm returns the values of and that maximize .
3 Validation
The position resolutions for both algorithms are measured with a data-driven method described in [6]. Within the WIMP-search PE region, near the radial cut for fiducialization, the position resolution for the TOF-based algorithm is typically 40-.
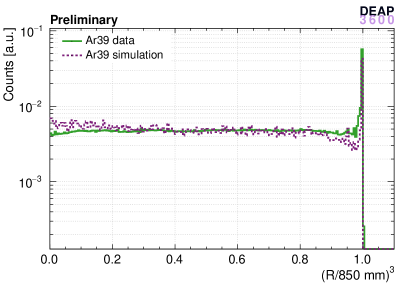
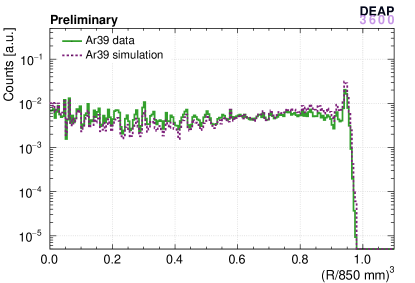
The WIMP-search analysis for the DEAP-3600 experiment relies primarily on the PE-based algorithm for fiducialization, though it also requires convergence and agreement between both algorithms. We reconstructed 39Ar electronic recoil (ER) events with both algorithms and showed that the two distributions are uniform in volume. Figure 3 shows the radius cubed distribution for the PE-based algorithm on left panel and TOF-based algorithm on right panel for 39Ar events. The PE-based algorithm results in a more uniform distribution in the bulk region, but strongly biased near the surface, while the distribution with TOF-based algorithm is more rippled in the bulk but less biased near the surface. They are both compared with Monte Carlo simulated 39Ar -decays and show good agreement. The enhancement at the surface arises because the fitting function is discontinuous in both algorithms. The discrepancy at zero for the PE-based algorithm is due to artifacts and is being investigated.
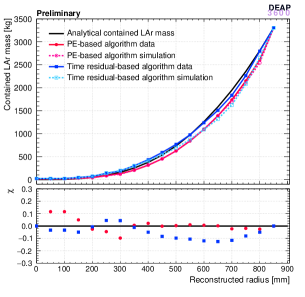
The left panel of Figure 4 shows the calculation of the contained mass of LAr within a radius of the reconstructed position estimated based on the total fraction of 39Ar ER events. Good agreement is achieved between the mass estimated using both reconstruction algorithms and the analytical contained LAr mass. In the WIMP search analysis, the fiducial mass is determined based on the fraction of 39Ar ER events in the 95-200 PE range surviving fiducial cuts.
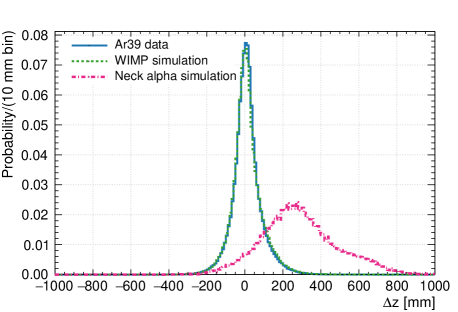
Both algorithms use the hypothesis that an event is from a single flash of isotropic light in bulk LAr. When the hypothesis is true such as for WIMPs or 39Ar ER events, the two algorithms should agree. For neck events, however, the light is emitted above the detector and shadowed by the flowguides, resulting in very different pulse hitting distribution and TOF distribution. We expect that they should reconstruct differently. Right panel of Figure 4, published in [1], shows the difference of the vertical positions of the TOF-based and PE-based algorithms. It is shown that the reconstructed vertical positions agree within for 50% of 39Ar events in data and simulated WIMPs. For simulated neck -decays, the reconstructed vertical positions of the two algorithms are very different, with the TOF-based algorithm systematically reconstructing these events much closer to the top of the detector than the PE-based algorithm doing. Including a cut based on the consistency of both position reconstruction algorithms in our suite of cuts, we achieved an overall expectation of events in ROI for backgrounds induced by neck -decays in the dataset of 231 live-day WIMP search analysis [1].
4 Summary
DEAP-3600 uses both PE-based and TOF-based algorithms for position reconstruction. The TOF-based algorithm is presented in detail. Although it is not used for fiducialization, the TOF-based algorithm helps remove backgrounds induced by -decays from the AV neck by comparing the reconstructed positions with the PE-based algorithm. The TOF-based position reconstruction uses both spatial distribution and timing information of the PMT hits. Including the results of the TOF-based algorithm in our suite of cuts allows us to identify and remove almost all neck background events for the dark matter search.
References
- [1] R. Ajaj et al. [DEAP Collaboration], Search for dark matter with a 231-day exposure of liquid argon using DEAP-3600 at SNOLAB, Phys. Rev. D 100 (2019) 022004.
- [2] M. Babicz et al., Experimental study of the propagation of scintillation light in Liquid Argon, Nucl. Instr. and Meth. A 936 (2019) 178-179.
- [3] E. Grace et al., Index of refraction, Rayleigh scattering length, and Sellmeier coefficients in solid and liquid argon and xenon , Nucl. Instr. and Meth. A 867 (2017) 204-208.
- [4] A. Hitachi et al., Effect of ionization density on the time dependence of luminescence from liquid argon and xenon, Phys Rev. B 27 (1983).
- [5] P.-A. Amaudruz et al. [DEAP Collaboration], Design and Construction of the DEAP-3600 Dark Matter Detector, Astropart. Phys. 108 (2019) 1-23.
- [6] J. Willis, A Data-Driven Method for Measuring Position Resolution in the DEAP-3600 DarkMatter Detector, Master Thesis, University of Alberta (2019).