Interstellar Comet 2I/Borisov exhibits a structure similar to native Solar System comets††thanks: Based on observations with the NASA/ESA Hubble Space Telescope, obtained at the Space Telescope Science Institute, which is operated by AURA, Inc., under NASA contract NAS 5-26555.
Abstract
We processed images taken with the Hubble Space Telescope (HST) to investigate any morphological features in the inner coma suggestive of a peculiar activity on the nucleus of the interstellar comet 2I/Borisov. The coma shows an evident elongation, in the position angle (PA) 0∘-180∘ direction, which appears related to the presence of a jet originating from a single active source on the nucleus. A counterpart of this jet directed towards PA 10∘ was detected through analysis of the changes of the inner coma morphology on HST images taken in different dates and processed with different filters. These findings indicate that the nucleus is probably rotating with a spin axis projected near the plane of the sky and oriented at PA 100∘-280∘, and that the active source is lying in a near-equatorial position. Subsequent observations of HST allowed us to determine the direction of the spin axis at RA = 17h20m 15∘ and Dec = 35∘ 10∘. Photometry of the nucleus on HST images of 12 October 2019 only span 7 hours, insufficient to reveal a rotational period. The morphology exhibited by the interstellar comet 2I/Borisov is very similar to that of comet C/2014 B1 suggesting that the activation processes are the same observed in the Solar System native comets.
keywords:
comets: individual (2I/Borisov) – comets: general1 Introduction
Comet 2I/Borisov is only the second interstellar object known to have passed through the solar system (Guzik et al. 2019a, Ye et al. 2019); it therefore provides an invaluable opportunity to investigate the structure and dust characteristics of small objects presumably formed in another, distant star system.
This comet was observed in images taken on 10 and 13 September 2019 with the WHT and GNT telescopes, when it showed only an extended coma and a faint, broad tail. The color of the comet was slightly reddish with a color index of 0.660.01 mag, compatible with solar system comets. Its observed morphology was best explained by dust with a low ejection speed (4414 m s-1) for particles, where is the ratio of the solar gravitational attraction to the solar radiation pressure (Guzik et al., 2019b). Almost simultaneously the comet was observed by D. Jewitt and J. Luu with the NOT telescope on six dates between 13 September and 4 October, and the early results prompted D. Jewitt et al. to submit a successful DDT proposal to observe comet Borisov with the Hubble Space Telescope. Some results were published in Jewitt et al. (2019a).
A total of 24 images of the comet, of 260s each, were taken by the HST WFC3 camera in the F350LP broad-band filter (centered at 584.94 nm) on 12 October 2019 in 4 consecutive orbits. After they were released to the public we could use them to perform an analysis of the morphology of the coma of the comet, which is the focus of this Letter. Additional analyses were performed after release of new images taken by HST during single orbits on three successive dates: 16 November and 9 December 2019, and 3 January 2020.
2 Methods
In order to perform a morphological analysis of the inner coma, where structures due to the emission of gas and dust from active sources on the nucleus are more easily detectable, we co-added and averaged separately the four series of six HST images of 12 October. The comparative analysis of the four series did not show obvious structural variations over the 7 h imaging time-span (from 13h44m39s UT to 20h42m23s UT of 12 October 2019), therefore we decided to stack the 4 series of HST images in a single image corresponding to a total exposure of 6240 s (104 min), to obtain the highest possible signal to noise ratio.
To highlight the structures of the inner coma, we applied different algorithms, often used for this type of analysis: median subtraction, division by , division by (Samarasinha et al. 2014), Larson-Sekanina with 30∘ angle (Larson et al. 1984). The comparison of the results of the four methods showed that the details highlighted were always the same in the same place, however the latter process provided the highest signal to noise ratio (Fig. 1).
We also applied false color palette or isophote visualization to enhance the visibility of the details, as well as a polar transformation, centered on the optocenter, to the processed images, with the aim of highlighting and determining the precise position angle (PA) of any structures revealed by the processing algorithms. Knowing that the nominal resolution of the HST WFC3 camera is 0.03977 arcsec/pixel (Bellini et al. 2011, Gennaro et al. 2018), corresponding to 81.1 km on the plane of the sky at the distance of the comet, it was then easy to convert the measured distances from pixels into km.
Finally, we also performed photometric measures of the nucleus on each of the original HST images to determine its instrumental magnitude. We applied the same parameters used by Bolin et al. (2019): a photometric circle with a 5-pixel diameter (0.2 arcsec) centered on the comet’s optocenter (assumed to correspond to the nucleus) and an annulus with internal and external radii of 6 and 20 pixels (0.8 arcsec), respectively, to measure the mean background value.
3 Analysis of the Comet
3.1 Dust Tail
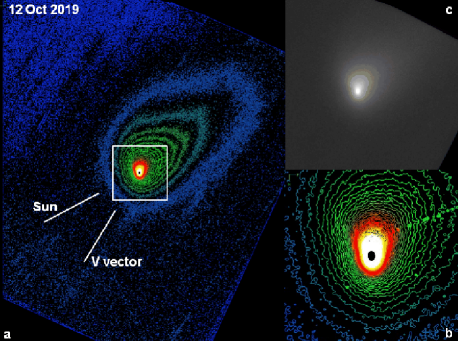
The stacked HST image of 12 October was processed in isophote color palette, to determine the shape and direction of the tail. We applied a brightness gap between each isophote as low as 75 ADU, ranging from 19307 ADU at the peak brightness of the comet’s nucleus to 1820 ADU of the farthest blue isophote, just 20 ADU above the sky-background, in order to detect the faintest details (Fig. 1). The orientation of the tail appears to be approximately aligned with the anti-solar vector in the image visualized with this method. Recently, Jewitt et al. (2019a) reported that the visible portion of the tail is limited to about 60 arcsec in length by sky noise and field structures on images taken with Earth-based telescopes. However, in the stacked HST images, the farthest point where the end of the tail could be detected is about 970 pixels from the nucleus, (40 arcsec), corresponding to a sky-plane length km and, assuming it is in antisolar direction, to an estimated true length km (with , where is the phase angle as calculated with the JPL/Horizon software111https://ssd.jpl.nasa.gov/horizons.cgi).
The high density of the isophotes in the area surrounding the nucleus (white-yellow-red isophotes, panel b in Fig. 1) suggests that the tail could partially originate from an almost isotropic distribution of dust, although the elongation of the inner coma is also suggesting a strong contribution of a radial emitting structure. On the contrary, the rapid decrease of the density of the isophotes moving away from the nucleus towards the end of the tail is indicative of a wide scattering of the emitted dust already at a relatively low distance from the nucleus.
The length of the tail can provide useful information about the size of the dust grains of which it is made. Within the tail, the dust and gas emitted from the nucleus are decoupled, and the only significant forces affecting the grain trajectories are the solar gravity and the radiation pressure. Both forces depend on the square of the heliocentric distance, but work in opposite directions (Vincent, 2010). Their sum can be seen as a reduced solar gravity, and the motion of dusts follows the equation
| (1) |
where is the ratio (radiation pressure)/(solar gravity), and is inversely proportional to the size of the grains for particles larger than 1 m (Bohren & Huffman, 1983).
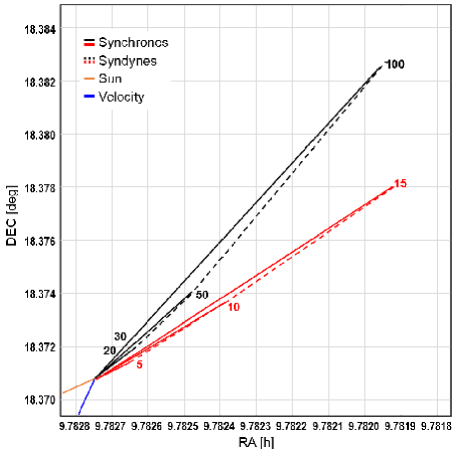
We performed a two-dimensional simulation of the dust tail made by means of the Finson-Probstein diagram (Comet Toolbox by J.B. Vincent 222http://www.comet-toolbox.com) up to 120 days earlier than 12 October 2019 using different (Fig. 2). Considering the approximations introduced, we obtained a length and shape of the tail in the numerical simulation corresponding to that measured on the HST image for values of between 0.01 and 0.03; it can therefore be estimated that the dust grains in the distal tail have radii between 30 and 100 m.
3.2 Coma
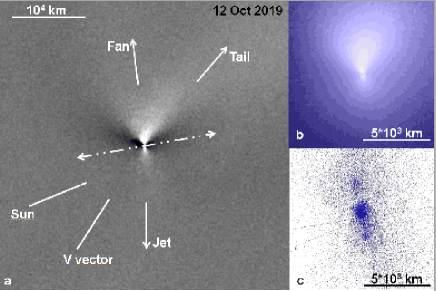
The composite HST image of 12 October 2019 clearly shows the comet as non- stellar and the inner coma anisotropic and elongated in N-S direction (3 arcsec or 75 pixels, Bolin et al. 2019), in contrast with the projected direction of the tail which is oriented towards PA 300∘. This elongation becomes more obvious and prominent in the composite image. The elongation appears to be related to the presence of a jet, that we could detect with all the spatial filters applied. At least part of the dust coma most likely originates from the emission of this jet, well visible directed towards PA 180∘ in the image processed with the Larson-Sekanina filter. The high resolution of the WFC3 camera shows no visible sub-structures of this jet, suggesting that it originates from a single active source on the nucleus of the comet (Fig. 3).
The emitted dust appears scattered at a relatively low distance from the nucleus and is soon deflected by the solar radiation pressure to merge into the tail. This appearance is indicative of a low ejection speed and possibly related to abundance of dust particles of a relatively small size.
We made further in depth analysis in search for other structures in different position angles. Actually, we found a fan-shaped structure towards PA 10∘, in a contralateral position with respect to the jet. The two structures are probably related, as they appear almost symmetrical on the opposite sides, thus most likely originating from the same single active source on a rotating nucleus (Fig. 4).
3.3 Photometry of the Nucleus
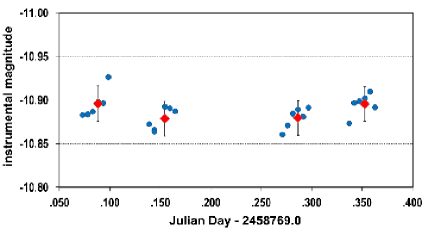
The images taken with HST are tracked at the differential motion rate of the comet with respect to the stars, therefore we could only perform a photometry to determine the instrumental magnitude of the nucleus. The use of a small aperture (5-pixel diameter) of the photometric circle removes efficiently the diffuse light due to the dust in the coma and enables to detect the smallest variations in brightness due to discrete emissions related to the rotation of the nucleus (Lamy et al. 1998a, 1998b). The measured instrumental magnitudes show small fluctuations suggestive of a possible period, however, the analysis made with standard algorithms based on the Fourier transforms and least squares methods provided no evidence of that (Fig. 5).
4 Discussion
4.1 Dust tail
Comet 2I/Borisov morphology looks similar to that of comet C/2014 B1 (Schwartz), with an equatorial ejection of dust particles from the nucleus and a near-equatorial viewing perspective (Jewitt et al. 2019b). However, since comet C/2014 B1 was at about 9 AU distance from the Sun, it showed a faint dust tail with a brightness just above the sky background, and only visible through isophote visualization (See Fig. 8, available only as supplementary on-line material). On the contrary, comet 2I/Borisov is at much lower heliocentric distance, shows a greater emission of gas and dust. Here solar gravity and solar radiation pressure are shaping the morphology of the dust coma, and its tail is in fact obvious and oriented in nearly anti-Solar direction. Dust emission in comet 2I/Borisov seem to be less collimated than C/2014 B1, with the dust particles widely scattered in anti-Solar direction, possibly due to the combination of a lower ejection speed and the effect of a greater radiation pressure. Our estimate of the size of dust particles in the range of 30 to 100 m radius is consistent with that recently reported by Jewitt (Jewitt et al. 2019a). However, it should be considered that in both cases the estimates apply to particles displaced to the end of the visible tail in order to reproduce its apparent length. In fact, using higher values in the Finson-Probstein diagram, in the region close to the nucleus the simulation approaches the wide scattering of the emitted dust observed in the HST images, which might be suggestive of the presence also of dust particles with a smaller size.
4.2 An emissive rotating structure
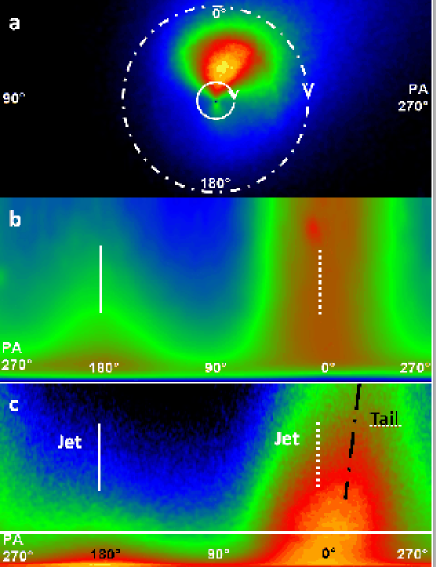
Assuming that the nucleus of comet 2I/Borisov is rotating and that the geometric position of the spin axis is such to favor a prolonged insolation, the dust emission from a single source located on the sunlit hemisphere should be modulated by the insolation and the resulting features of the inner coma should provide indications on the orientation of the spin axis. In the case of two emissive structures with similar morphology that are observed in approximately opposite directions, it could be supposed that both originated from the same active source on a nucleus that is rotating with a spin axis coinciding with the axis of the angle between the two structures and, if so, that they would be more evident when their position corresponds to the projection on the plane of the sky for the greater condensation of material on the perpendicular to the view (Sekanina, 1987).
The finding of a jet at PA 180∘ and of its counterpart at PA 10∘ suggest that the active area originating the structures is located in a near-equatorial position, and that the nucleus is probably rotating with a spin axis lying near the plane of the sky and geometrically oriented at PA 100∘ or PA (Fig. 3). Unfortunately, from the HST images it is not possible to determine the direction of rotation of the nucleus. To further verify our findings, we run a computer model of the inner coma using a proprietary software (P. Pellissier, 2009) specifically designed to reproduce Earth-based observations of the dust coma structures and of the development of the tail. The parameters needed to run the model are the properties of the dust particles, those of the nucleus, and the geometric conditions of the Sun-Earth-comet system. The following physical parameters of the dust particles, compatible with the observations of Rosetta on comet 67P (Fulle, 2015; Rotundi, 2015; Guettler, 2019) were entered in the model (albedo: 0.03; diameter: 50 m; density: 0.6g/cm-3; ejection velocity: 25 ms-1; dispersion: 0.75). For the cometary nucleus (assumed spherical) we entered a latitude of for a single jet at and a direction of the spin axis a PA . Since the rotation period was not known, we run the model applying only three full rotations in order to simulate the early development of the inner coma features before they would be hidden by the dust. The resulting model is shown in Figure 4b. The features shown by the model are consistent with those observed in the HST image processed with spatial filters. By applying higher number of rotations to the nucleus, it was also possible to model the development of the tail, which appeared similar to that observed on the HST image.
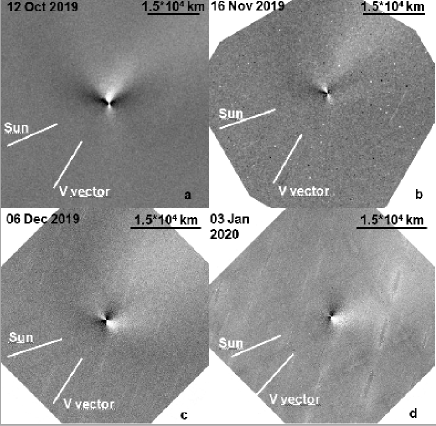
Our findings gathered stronger evidence by analysis of new HST images taken in the subsequent dates, thanks to the changes in the geometric conditions of the observation (Fig. 6). In these images the jet that appeared directed towards PA on 12 October 2019 becomes more and more evident and subsequently takes the shape of a fan due to the variations of insolation. These findings also confirms the near-equatorial position of the emitting source and thus the rotation of the nucleus.
The availability of HST observations extended over a period of about 80 days has also allowed us to study the changes in the direction of the axis of the angle between the two observed jets, which remained lying on the plane of the sky, as confirmed by the fact that the jet never showed evolution into shells or bow-shaped structures (Fig. 9, animation available only as supplementary on-line material). Assuming that the nucleus of the comet is spherical and that the active area is located within latitude from the equator, by means of a trial and error analysis we found the best fit for the direction of the spin axis at RA = 17h20m 15∘ and Dec = 35∘ 10∘ (or in opposite direction).
The time span of only 7 h is too short to allow for a detection of a possible periodicity of the rotation of the cometary nucleus by means of a photometric analysis. In fact, no significant variations in the light curve were detected also by Bolin et al. (2019), who hypothesized that the coma of 2I/Borisov may be too compact to see the rotational variation, or that the nucleus itself is spherical, has slow rotation period or is oriented with an unfavorable geometry. Despite the intrinsic limitations of our measurements, we think that the small variations that we could detect in the instrumental magnitude by applying a smaller aperture suggest a confirmation that the nucleus is rotating, although it was not possible to estimate any period with the available data. A series of high-resolution images over a longer time period could detect the period with greater accuracy.
5 Conclusions
From our analyses of the recent HST images of the interstellar comet 2I/Borisov we found that:
-
•
The comet is strongly emitting dust, and producing a tail that is approximately aligned with the anti-Solar vector with a sky-plane length km.
-
•
Modeling of the tail suggests that the dust grains have radii between 30 and 100 m, although the wide scattering of the emitted dust might also be suggestive of the presence of smaller dust particles around the nucleus.
-
•
A clear elongation of the peri-nuclear area appears related to the presence of a jet probably deriving from an active source in a near-equatorial position. At least part of the dust coma and of the tail most likely originate from this jet.
-
•
The nucleus is probably rotating with a spin axis lying near the plane of the sky and geometrically oriented at PA or PA on 12 October 2019. The small variations detected in the instrumental magnitude values confirm this finding, although they do not allow to estimate a periodicity of the rotation of the nucleus.
-
•
The spin axis direction was determined at RA = 17h20m 15∘ and Dec = 35.
In summary, the preliminary findings of our analyses suggest that the interstellar comet 2I/Borisov appears similar in morphology and behavior to the native Solar System comets.
Acknowledgments
This research has made use of the Keck Observatory Archive (KOA), which is operated by the W. M. Keck Observatory and the NASA Exoplanet Science Institute (NExScI), under contract with the NASA.
References
- [] Bellini A. et al., 2011, PASP 123, 903, DOI:10.1086/659878
- [] Bolin T. et al., 2019, arXiv:1910.14004
- [] Bohren, C.F., and Huffman, D.R., 1983. Nature, 306, 625
- [] Fulle, M., et al., 2015. ApJ 802, L12, DOI: 10.1088/2041-8205/802/1/L12
- [] Gennaro M. et al., 2018. WFC3 data handbook at: http://www.stsci.edu/hst/wfc3
- [] Guettler C. et al., 2019. A&A 630, A24 (2019), DOI: 10.1051/0004-6361/201834751
- [] Guzik et al., 2019a. ATel13100
- [] Guzik, P., Drahus, M., Rusek, K., et al.; Nat. Astron., 2019b., DOI: 10.1038/s41550-019-0931-8
- [] Jewitt, D., & Luu, J., 2019a. arXiv:1910.02547
- [] Jewitt D., Kim Y., Luu J., Graykowski A., AJ, 157, 2019b. DOI: 10.3847/1538-3881/aafe05
- [] Lamy, P., Toth, I., Jorda, L., 1998a, A&A 335, L29
- [] Lamy, P., Toth, I., Weaver, H., 1998b, A&A 337, 945
- [] Larson, S.M. & Sekanina, Z., 1984, A.J. 89, 571. DOI: 10.1086/113551
- [] Rotundi, A., et al., 2015. Sci. 347, 6220, DOI: 10.1126/science.aaa3905
- [] Samarasinha, N., and Larson, S.M., 2014. Icarus, 239, 168. DOI: 10.1016/j.icarus.2014.05.028
- [] Sekanina, Z., 1987. ESA, Proceedings of the International Symposium on the Diversity and Similarity of Comets, 315
- [] Vincent, J.B.; A&A, 512, 2010. DOI: 10.1051/0004-6361/200913418
- [] Vincent, J.B. http://www.comet-toolbox.com
- [] Ye, Q., Kelley, M., Bolin, B., et al. 2019. arXiv:1911.05902