Minkowski functionals for phase behavior under confinement
Abstract
In this work, the Minkowski functionals are used as a framework to study how morphology (i.e. the shape of a structure) and topology (i.e. how different structures are connected) influence wall adsorption and capillary condensation under tight confinement. Numerical simulations based on classical density functional theory (DFT) are run for a wide variety of geometries using both hard-sphere and Lennard-Jones fluids. These DFT computations are compared to results obtained using the Minkowski functionals. It is found that the Minkowski functionals can provide a good description of the behavior of Lennard-Jones fluids down to small system sizes. In addition, through decomposition of the free energy, the Minkowski functionals provide a good framework to better understand what are the dominant contributions to the physics of a system. Lastly, while studying the phase envelope shift as a function of the Minkowski functionals it is found that topology has a different effect depending on whether the phase transition under consideration is a first- or a second-order transition.
-
March 7, 2024
Keywords: capillary condensation, Minkowski functionals, Lennard-Jones fluid
1 Introduction
Under tight confinement a gas can form a condensed phase at a pressure below the bulk vapor pressure. This phenomenon is known as capillary condensation and has applications in many fields of science and engineering, including the storage of hydrogen carriers [1, 2, 3], battery technology [4], hydrocarbons extraction from unconventional reservoirs [5], and carbon dioxide sequestration [6]. Capillary condensation can have a large effect on transport properties [7], and it is reported in the literature that both morphology (i.e. the shape of a structure) and topology (i.e. how different structures are connected) have a strong effect on the sorption of both sub- and supercritical fluids [2, 8, 9]. For ordered porous media, the relation between capillary condensation and geometry is well understood [10]; however, in practice many porous media are disordered rather than ordered. Although simple geometries like cylinders, slit pores, ink bottles, and spheres [11, 12] have been studied extensively, capillary condensation in disordered porous media is not well understood [13, 14, 15, 16, 12, 17].
In this work, we study capillary condensation and wall adsorption under confinement (i.e. small pores) through the lens of the Minkowski functionals. These functionals are a concept from integral geometry which not only characterize the morphology, but also the topology of spatial patterns [18], and they have been applied in a wide array of research areas including astronomy [19, 20], statistical physics [21], phase behavior [22], and granular materials [23, 24]. For a system in dimensions, there are Minkowski functionals and in the case of a two-dimensional system these functionals are related to the surface area, circumference, and signed curvature (i.e. the Euler characteristic) of the system [25]. In addition to providing a method to characterize spatial patterns, the Minkowski functionals also provide a powerful connection between the thermodynamics and the geometry of a system. In many cases, the free energy of a system can be expressed as a linear combination of Minkowski functionals [26, 27]. Once an expression for the free energy has been found, other thermodynamic properties can be derived including the surface tension, excess adsorption, and shifts in the phase envelope [28].
Minkowski functionals can be used in combination with experiments, theory, or simulations. In this work, we employ classical density functional theory (DFT) [29] to compute the free energy and adsorption for a wide variety of geometries for both hard-sphere and Lennard-Jones fluids. These results are then compared to results obtained using the Minkowski functionals. The Minkowski functionals have mainly been used to study hard-sphere fluids [27]. In this study, we find that Minkowski functionals can also provide a good description of Lennard-Jones fluids down to fairly small system sizes. This, in turn, means that the decomposition of the free energy given by the Minkowski functionals can provide valuable insight into the physical behavior of a Lennard-Jones fluid under confinement; e.g. it is found that topology has a different effect on the phase envelope shift of a Lennard-Jones fluid under confinement depending on whether the phase transition under consideration is a first- or a second-order transition. It is left for future research to investigate whether this behavior is specific to wall adsorption and capillary condensation, or whether this is a more universal phenomenon.
2 Theory
2.1 Minkowski functionals
The Minkowski functionals are a concept from integral geometry. These functionals characterize both the morphology and the topology of a spatial pattern [30, 31]. For a dimensional space, there are functionals. Considering a 2D system with a surface, , and a smooth boundary, , the following functionals can be defined:
| (1) |
where is a surface element, is a circumference element, and is the signed curvature [32]. Following the Gauss-Bonnet theorem, the signed curvature is directly proportional to the Euler characteristic, , which is a measure of connectivity/topology. Now consider a functional, , which is additive:
| (2) |
motion invariant:
| (3) |
and continuous:
| (4) |
Then, following Hadwiger’s theorem [26], this functional, , can be expressed as a linear combination of Minkowski functionals, , as follows:
| (5) |
An example of such a functional is the grand potential or Landau free energy, , which is commonly used to study capillary condensation [33, 34]. For a 2D system, the grand potential can thus be written as [18]:
| (6) |
where is a unit length, is the pressure, is the surface tension, and is the signed bending rigidity. The above expression for the grand potential demonstrates the importance of Hadwiger’s theorem. The pressure, surface tension, and signed bending rigidity are all only dependent on the chemical potential, , and the temperature, . Thus, the above equation shows how thermodynamics can be separated from morphology and topology [27]. Once the grand potential is known, other thermodynamic properties can be derived. This includes the excess free energy or surface tension [11, 28]:
| (7) | ||||
| (8) |
and, through Gibbs’ theorem, the excess adsorption:
| (9) | ||||
| (10) |
In the above equations, is the bulk pressure and is the bulk density. While it has been suggested in the past that Gibbs’ theorem is not valid for some systems undergoing capillary condensation [33, 35], later work found that Gibbs’ theorem is not violated when using an arc length tracking algorithm [36, 11].
In addition to the excess adsorption, one can also compute the effect of confinement on the phase envelope [28]:
| (11) |
with:
| (12) | ||||
| (13) |
where and are the solid-gas and solid-liquid surface energies, respectively, and and are the solid-gas and solid-liquid bending rigidities. The above equation is a generalization of the Kelvin equation, and an equation of the same form can be derived for the temperature shift [37]. Two points should be noted about the above equation: i) due to diverging density fluctuations, a mean field approach is not expected to fully capture the correct scaling at the critical point [38], and ii) the correlation length that measures the range of density fluctuations at the critical point also diverges, resulting in a potential violation of Hadwiger’s theorem. However, while these points need to be investigated further, the above equation should give a good first approximation of how phase behavior is affected by topology.
3 Methods
3.1 Density Functional Theory
The Minkowski functionals can be used with either experiments, theory, or simulations. In this work, we decided on using classical density functional theory (DFT) to compute the coefficients in front of the Minkowski functionals. DFT is a mean field approach which was first developed for quantum mechanics [39], but was later adapted to describe classical mechanical systems [29] as well. This mean field approach has the advantage of giving a description of the physics at the nanoscopic molecular level, while scaling up to the mesoscopic level at which capillary condensation occurs.
The two basic assumptions of density functional theory are; i) the Hohenberg-Kohn variational principle, which states that there is a functional of the ground state free energy which can be fully recovered from the ground-state one-particle density distribution, and ii) the Gibbs’ inequality, which states that any particle density distribution that is not the ground state will have a higher free energy than the ground state free energy [39]. Formulated in the grand canonical (,,) ensemble, at the most basic level this means that classical DFT solves the following minimization problem:
| (14) |
where is the grand potential or Landau free energy, is the density, and is the Fréchet (functional) derivative [40]. To solve the above equation, we use the DFT solver Tramonto, which is developed at the Sandia National Laboratories [41, 42, 36, 11, 40]. This code uses perturbation theory where the grand potential is split up as:
| (15) |
where is the ideal contribution, is the hard-sphere contribution, and is the perturbation contribution. is the external potential resulting from (pore) walls acting on the fluid. The individual contributions are given by the following integrals:
| (16) | ||||
| (17) | ||||
| (18) |
In the above equations, , with the Boltzmann constant, and the temperature, is the thermal de Broglie wavelength, is the excess free energy density which is a function of , a set of weighted non-local densities, and is an interaction potential. This potential is based on the Weeks-Chandler-Anderson approach [43], which splits an interaction potential as for and for . The potential is a cut and shifted Lennard-Jones potential with where:
| (19) |
and . Here is the depth of the potential well and is the finite distance at which the potential is zero. In this work, the Fundamental Measure Theory (FMT) is used with the White Bear functional [44]. The weighted non-local densities are:
| (20) |
with the weight functions:
| (21) | ||||||
| (22) | ||||||
| (23) | ||||||
The excess free energy density is given by with:
| (24) | ||||
| (25) |
The last term that needs to be defined is the external potential, , which is defined as:
| (26) |
where the integral is taken over all elements assigned to the (pore) wall. The potential is the same as the Lennard-Jones potential defined in equation 19, but with replaced with and replaced with . More details about the discretization of the above equations, their numerical implementation, and how to solve them in parallel can be found in the literature [41, 42, 36, 11, 40]. Phase transitions are tracked using the pseudo arc length continuation algorithm of Keller [45, 36] which have been implemented in the LOCA software library [46].
3.2 Geometries
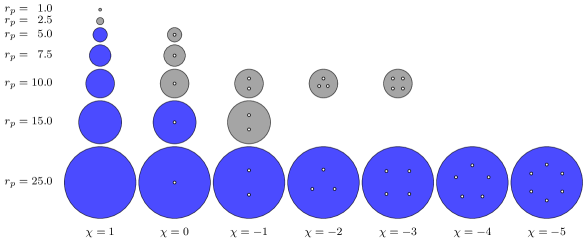
To study how capillary condensation depends on the Minkowski functionals, simulations have been performed for a broad range of pore sizes and topologies. Figure 1 shows these various geometries and topologies. Along the vertical axis, the various shapes show pores with different radii, . Along the horizontal axis rods with radius are placed inside the pores to modify the Euler characteristic . The various 2D Minkowski functionals associated with the surface area, circumference, and signed curvature, respectively, can be computed with the following set of equations:
| (27) | |||||
| (28) | |||||
| (29) |
where is the number of rods inside the pore. As mentioned in section 2.1, in order for the Minkowski functionals to accurately capture the physics of capillary condensation, the conditions in Hadwiger’s theorem need to be met. Considering that for very small pores the characteristic interaction length between molecules becomes of the same order as the pore size, the additivity constraint (Equation 2) is expected to break down first. In the literature it is reported that an error of about is found when the system size becomes of the order of , where is the characteristic length scale of the interaction potential between molecules [27]. For the pores in gray in Figure 1 the minimum distance between the walls of the pore and/or the rods inside the pore is smaller than this distance, and Hadwiger’s theorem is expected to break down.
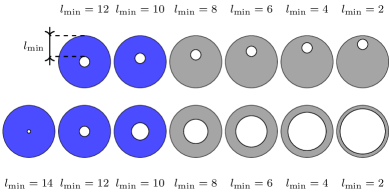
In addition, to further explore the effect of violating Hadwiger’s additivity assumption, simulations are run for the geometries shown in figure 2. For all geometries, the radius of the pore is, , and the Euler characteristic is, . The radius of the rod in the top row geometries is , and the distance with the wall is varied. In the bottom row geometries, the radius of the rod is varied from , to . By moving the rod towards the wall/changing the radius of the rod, the additivity assumption gradually breaks down. This allows us to investigate whether the accuracy of the simulations also breaks down gradually, or whether there is a catastrophic failure at a certain wall-to-wall distance. Again, the pores in gray are simulation cases in which the distance between the walls of the pore and the rod are smaller than , the distance at which the additivity assumption starts to break down [27].
3.3 Simulation parameters
| \ceN2 | 94.45 | 0.3575 | 0.3575 | 147.3 | 0.317 |
|---|
Existing literature has focused on the behavior of hard sphere fluids [27]. This kind of potential resembles a high temperature gas and can be a useful simplification of a system of interest. However, many engineering applications require more complex particle-particle interactions like the Lennard-Jones potential. In this work, simulations have been performed for both a hard-sphere fluid and a Lennard-Jones fluid. The hard-sphere fluid allows for a comparison with literature and provides a simplified base case. The Lennard-Jones fluid, on the other hand, is used to analyze the effect of adding an attractive longer range component to the interaction potential and to see whether the framework of the Minkowski functionals is also useful in more realistic engineering applications.

Table 1 shows the parameters used in the Lennard-Jones DFT simulations. Because it is a commonly used model system [50, 51, 52], the Lennard-Jones fluid is parameterized as Nitrogen in Vycor glass. The parameters are the same as those used by Ravikovitch et al. [47] and Ustinov et al. [48] and are very similar to the parameters used by Gelb & Gubbins [53] in their Grand Canonical Monte Carlo simulations of Nitrogen in Vycor glass. Figure 3 shows a comparison between DFT simulations and experiments [49] for the adsorption isotherm of \ceN2 in a \ceSiO2 slit pore with a width of . The results confirm that the parameters listed in table 1 are a reasonable choice. With more advanced models for the interaction between \ceN2 and \ceSiO2, a better match can be obtained between DFT simulations and experiments [47, 48]. However, the choice of the same potential for particle-particle and wall-particle keeps the system simple and the results more easy to interpret. The computations are performed in the grand canonical ensemble () and the relation between the chemical potential and pressure was obtained from a bulk DFT simulation.
4 Results
In this section, the results are shown for both simulations with a hard-sphere interaction potential and a Lennard-Jones interaction potential. All the parameters have been made dimensionless with and .
4.1 Hard sphere potential
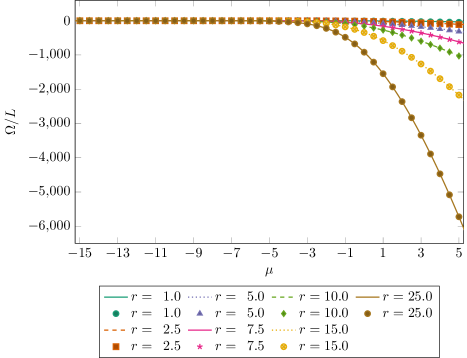
Figure 4 shows the 2D dimensionless grand potential, , as a function of the dimensionless chemical potential, , for a hard-sphere fluid. For clarity, only the simulation results when are shown. The different lines show the results of the DFT simulations while the symbols show the grand potential as reconstructed from the Minkowski functionals and one set of Minkowski functional coefficients: pressure, , surface tension, , and bending rigidity, . These coefficients are computed by performing a least squares fit on all the simulations. The various curves show a low density regime for chemical potentials and a transition to a high density regime for . Visually, in both regimes, the data sets show a good match for all geometries.
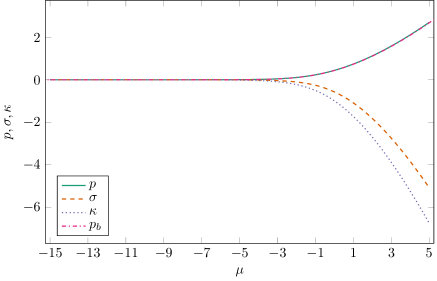
The individual dimensionless Minkowski functional coefficients are shown in Figure 5 as a function of the dimensionless chemical potential, . These are the values of the coefficients that are used in Figure 4 to reconstruct the grand potential as a function of the chemical potential. It can be seen that in this system, the pressure coefficient is the same as the bulk pressure. The surface tension and bending rigidity show the same behavior as in a 3D system [27].

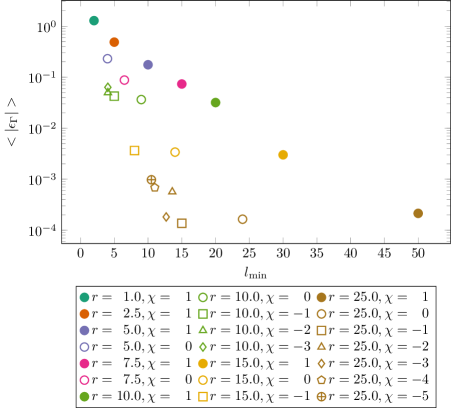
To get a better understanding of the error introduced by using the Minkowski functionals, Figure 6 shows the average absolute relative error, , as a function of the minimal characteristic length scale of the system, . The average absolute relative error is defined as:
| (30) |
where is the grand potential computed using DFT, and is the reconstruction of the grand potential using the Minkowski functionals. The error is averaged with respect to the chemical potential, . In the case of a pore without rods, the length scale, , equals twice the radius. When rods are present within the pore, this is the smallest distance between the pore wall and a rod or between two different rods. For pores without rods, it can be observed that scales approximately linearly with . Figure 4 indicates that there is a very good match between the grand potential computed directly using DFT and the reconstruction using the Minkowski functionals; nevertheless, close inspection of the results shows that the accuracy of the Minkowski functionals declines as the pores become smaller. This is due to the fact that when the system size is of the same order as the interaction length between molecules, Hadwiger’s assumption of additivity breaks down. However, looking at other topologies suggests that is not a perfect description of the characteristic length scale of the system. Changing the topology of the system with rods seems to have little effect on the error and the linear scaling relation between and does not hold. The error, , found in this work for cylindrical pores is consistent with the literature [27].
To further analyze the behavior of the error, , as a function of various morphologies and topologies, Figure 7 shows an analysis of the error when applying the Minkowski functional expansion of the grand potential for the geometries shown in Figure 2. The top row of this figure shows a set of pore geometries with one rod inside. In these different geometries, the distance from the pore to the wall is varied. All of these geometries have the same Minkowski functionals. The bottom row of Figure 2 also shows a set of pore geometries with one rod inside, but the pore is centered in the middle. In this set of geometries, the size of the rod is varied. Figure 7 shows the average absolute relative error, , as a function of the minimal characteristic length scale of the system, . The closed symbols show reference DFT simulations of pores without rods, open squares show simulations from the top row of Figure 2, and closed triangles show results from the bottom row of Figure 2. The figure shows that the scaling of the error as a function of the minimal distance, , is very similar for open pores and pores with rods of varying radii. However, moving a rod around inside a pore does not have much effect on the error of the Minkowski functional reconstruction of the grand potential. These results confirm that is not a perfect description of the characteristic length scale of the system. In addition, the literature suggests that perturbations introduced at a caustic point should increase the error [27], which is not the case for these simulations. The error was also studied as a function of the length scale defined as the ratio of the Minkowski functionals for surface area and circumference and as the average wall-to-wall distance. However, neither of these measures improved the scaling relation and more study is needed.
An important thermodynamic property which can be derived from the grand potential is the excess adsorption, . Figure 8 shows the 2D dimensionless excess adsorption, , as a function of the chemical potential, . Again, only the simulation results from Figure 1 when are shown. The different lines show the results of the DFT simulations. The symbols show the excess adsorption as reconstructed from the Minkowski functionals and one set of Minkowski functional coefficients: the derivatives of pressure,, surface tension, , and bending rigidity, , with respect to the chemical potential. Like the grand potential, these coefficients are computed by performing a least squares fit on all the simulations from Figure 1. For larger pores there is a very good match between the results of the DFT computations and the reconstruction of the adsorption isotherm using Minkowski functionals. However, for smaller pores a clear difference can be observed. This difference between the DFT simulations and the Minkowski functional reconstruction is more pronounced than for the grand potential in Figure 4. This can most likely be contributed to the fact that the excess adsorption is a derivative of the grand potential, which introduces additional uncertainty in the results. A second observation is the collapse of the different adsorption isotherms for larger pore sizes. Since the difference between the pressure, , and the bulk pressure, , is close to zero (see Figure 5), the only term in Equation 10 that can contribute to differences in excess adsorption between different geometries is . This suggests that, as the pore size increases, the effect of topology on the excess adsorption decreases.
The matching dimensionless Minkowski functional coefficients: the derivatives of pressure,, surface tension, , and bending rigidity, , with respect to the chemical potential are shown in Figure 9. This figure confirms again that in this system the pressure coefficient is the same as the bulk pressure. Considering the the minus sign in Equation 10, the curves for the surface tension and bending rigidity are consistent with Figure 5.
The last graph for the hard-sphere system is Figure 10, which shows the average absolute relative error as a function of the minimal characteristic length scale of the system, . In the case of a pore without rods, this distance is twice the radius. When rods are present within the pore, this is the smallest distance between the pore wall and a rod or between two different rods. The relative error is defined in the same manner as in equation 31. For pores without rods, it can be observed that scales almost linearly with instead of being proportional to . In addition, due to the fact that the excess adsorption is a derivative of the grand potential, the error is larger than observed in Figure 6.
4.2 Lennard-Jones potential
In this section, the results for the Lennard-Jones fluid are presented. Due to the increased interaction length and the more complex phase behavior of this interaction potential compared to a hard-sphere fluid, it is found that Hadwiger’s theorem starts to break down earlier. However, as is shown below, by performing a scaling analysis of the phase transitions of the system as a function of the Minkowski functionals, the following additional terms and can be identified and added to the expansion of the grand potential for increased accuracy. All the results in this section include these extra terms.
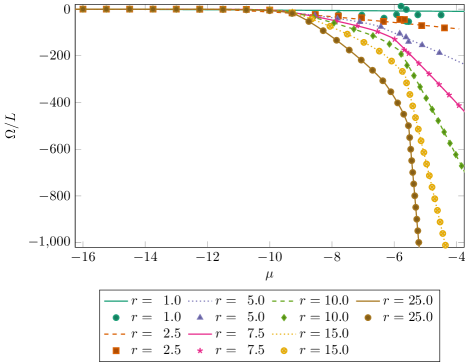
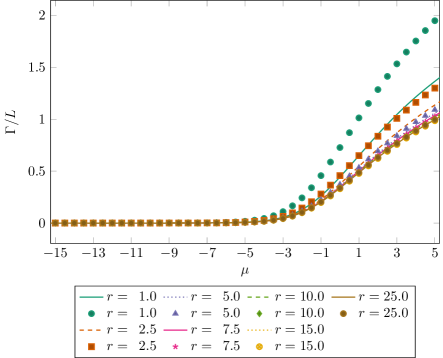
Figure 11 shows the dimensionless 2D grand potential, , as a function of the dimensionless chemical potential, , for a Lennard-Jones fluid. Only the simulation results with Euler characteristic, , are shown. The different lines show the results of the DFT simulations while the symbols show the grand potential reconstructed from the Minkowski functionals and one set of Minkowski functional coefficients: pressure, , surface tension, , bending rigidity, , and the pseudo pressure and surface tension terms and . The shape of the grand potential curves shows more complex behavior than those in Figure 4 for a hard-sphere fluid. For the pore size, , three different regimes can be identified: i) at low chemical potential the pores are completely empty, ii) starting at about , a second-order phase transition can be observed and gas starts adsorbing on the wall, and iii) at about capillary condensation can be observed. In this work, capillary condensation is defined as a first-order phase transition that can be identified by a van der Waals loop in the grand potential as a function of the chemical potential [37]. The data sets for DFT simulations and the reconstructions using the Minkowski functionals show a good match for larger geometries, but a discrepancy for the smallest pores. Like the hard-sphere fluid, this is the consequence of the breakdown of Hadwiger’s theorem. One example of how this manifests itself, is that there is a critical pore size at which the first order capillary condensation phase transition changes into a second order transition. It is found that this change from a first-order to a second-order phase transition is not captured well by the Minkowski functional approximation of the grand potential.
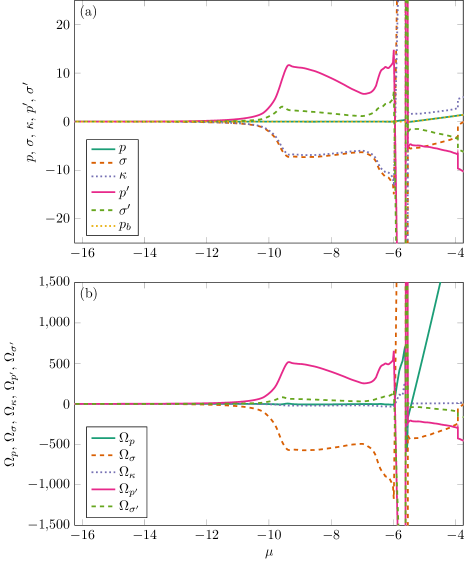
The corresponding dimensionless Minkowski functional coefficients as a function of the dimensionless chemical potential, , are shown in Figure 12 (a). It can be observed that like the hard-sphere system, the pressure coefficient is very similar to the bulk pressure, . All coefficients show a large peak around and the range of these peaks extends from about to . Before these peaks occur, the surface tension and bending rigidity terms show very similar behavior. To get a better understanding of the behavior of a Lennard-Jones fluid under confinement, one can analyze how much individual Minkowski functionals contribute to the grand potential. In Figure 12 (b), the value of the Minkowski functional coefficients times their corresponding Minkowski functionals is shown for a pore with radius, , and without any rods inside, . This analysis suggests that the adsorption of gas onto the pore wall is dominated by the surface tension and the pseudo pressure. When capillary condensation occurs, the surface tension and pseudo pressure contributions both become discontinuous and show large increases. Also, the contribution from the pseudo surface tension contribution becomes significant. After the bulk phase transition, the system becomes increasingly dominated by the pressure. As expected, there is no significant contribution from the topology in this pore geometry.
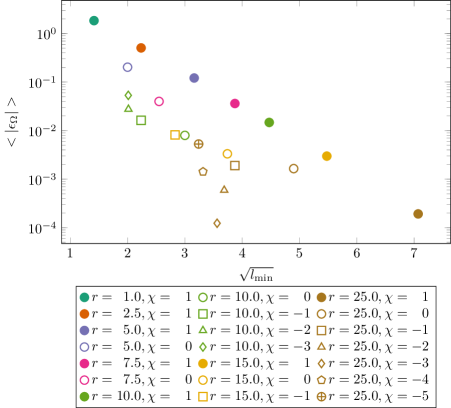
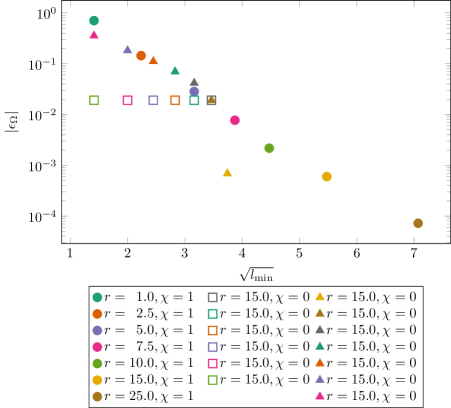
Figure 13 shows the average absolute relative error, , as a function of the square root of the minimal characteristic length scale of the system, . As a reminder, the average absolute relative error is defined as:
| (31) |
where is the grand potential computed using DFT, and is the reconstruction of the grand potential using the Minkowski functionals. The error is averaged with respect to the chemical potential, . Due to the longer interaction length of the Lennard-Jones potential compared to the hard-sphere potential and the more complex phase behavior, the observed error is larger than in Figure 6. While the cut-off length of the interaction potential is equal to in the DFT simulations, one could expect the error to be significantly less than 5 times as large because the attractive tail of the Lennard-Jones potential is almost zero at . The error is indeed significantly less than 5 times as large. However, this is in part due to the addition of the pseudo pressure and surface tension terms to the Minkowski functional expression for the grand potential. Like the hard-sphere fluid, for pores without rods, it can be observed that scales almost linearly with . However, this scaling does not hold for pores with rods. Like the hard-sphere system, changing the topology of the system with rods does not have a large effect on the error, , especially for smaller pores. The fact that, as shown above, the topology does not have a very large contribution to the grand potential could partly explain this observation. The figure confirms the observation in Figure 11 that for larger pores the fit of the Minkowski functional reconstruction of the grand potential is much better than for smaller pores.
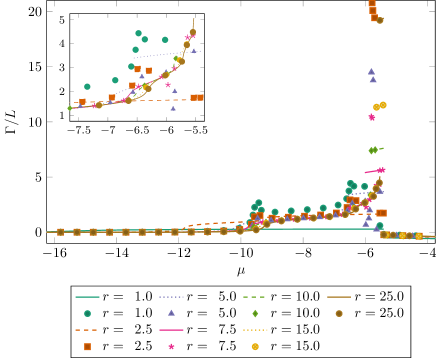
The dimensionless 2D excess adsorption, , as a function of the dimensionless chemical potential, , for a Lennard-Jones fluid is shown in Figure 14. Again, only the simulation results when are shown. The different lines show the results of the DFT simulations while the symbols show the grand potential as reconstructed from the Minkowski functionals and one set of Minkowski functional coefficients: the derivatives of pressure,, surface tension, , bending rigidity, , and the pseudo pressure and surface tension terms and with respect to the chemical potential. As is the case for the grand potential in Figure 11, different regimes can be identified in Figure 14. For the pore size, , the following regimes can be observed: i) at low chemical potential the pores are completely empty, ii) starting at about , a second-order phase transition can be observed and gas starts adsorbing on the wall, iii) at about capillary condensation can be observed, and iv) around the bulk phase transition occurs and the excess adsorption shows a significant drop. The inset shows that for larger pores there is a very good match between the DFT computations and the Minkowski functional reconstructions. However, for the smallest pores the match is quite poor and neither the film adsorption stage or capillary condensation is captured well.
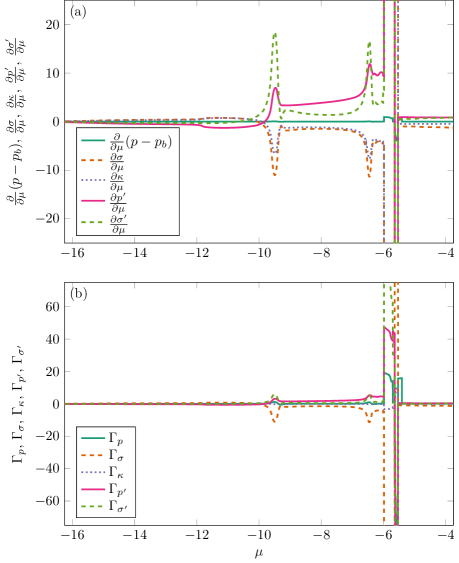
The derivatives of the Minkowski functional coefficient with respect to the chemical potential, , used to reconstruct the excess adsorption, can be observed in Figure 15 a. This plot confirms that the pressure term is very similar to the bulk pressure. The peaks at about and are the locations of the second-order phase transitions associated with layers of gas molecules adsorbing onto the pore wall. To be able to analyze how the different terms contribute to the excess adsorption, in Figure 15 (b) the value of the Minkowski functional coefficients times their corresponding Minkowski functionals is shown for a pore with radius and without any rods inside, . Since these coefficients are derivatives of the coefficients used to reconstruct the grand potential, they can be both positive and negative. The amount of gas adsorbed onto the wall is dominated by the pseudo pressure and a negative contribution from the surface tension. The pseudo surface tension only contributes during the second-order phase transitions at about and . Capillary condensation is characterized by a much larger contribution of the pseudo surface tension and many discontinuities in all the different terms to accommodate the discontinuity of a first-order phase transition. As expected for an open-pore geometry, both the pressure and topology do not significantly contribute to the excess adsorption.
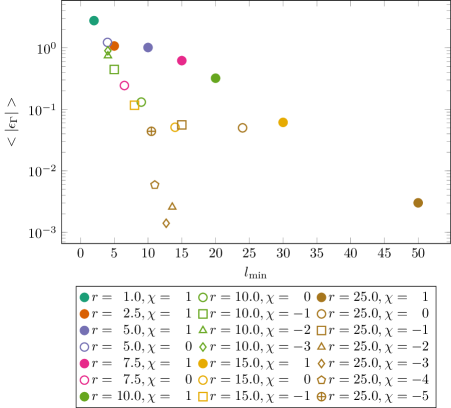
Figure 16 shows the average absolute relative error as a function of the minimal characteristic length scale of the system, . Because excess adsorption is a derivative of the grand potential, the observed error is larger than Figure 13. Due to the more complex interactions in a Lennard-Jones fluid, the error is also larger than the error observed for a hard-sphere fluid in Figure 10. For pores without rods, it can be observed that scales almost linearly with . Again, this scaling does not hold for pores with rods. This is similar to what was observed for Figure 13 which is probably at least partly caused by the limited contribution of topology to the grand potential and the excess adsorption.
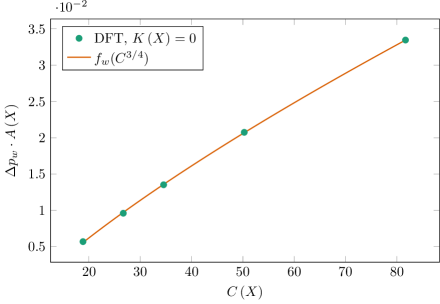
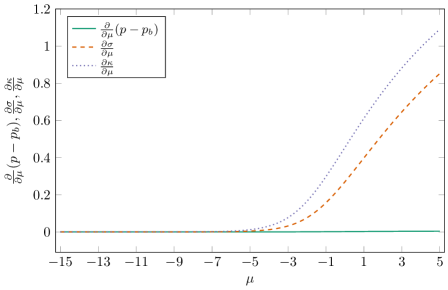
As expressed in Equation 11, the Minkowski functionals can also be used to evaluate the shift of the phase envelope as a function of morphology and topology. Additionally, knowing the phase behavior also helps in determining which terms should be used to expand the grand potential in terms of the Minkowski functionals. Because the rod size is constant across different simulations, the Minkowski functionals and can be expressed as a functions of only the pore radius for constant bending rigidity, . This means that for , the pressure shift in the phase envelope only depends on . Figure 17 shows that the pressure difference between the second-order phase transition associated with adsorption of gas onto a wall in the bulk and inside a pore, , can be predicted well by the function: , where the coefficients are: and . Although the power of is reasonably close to the theoretical prediction of , this shows that due to the small system size, Hadwiger’s additivity assumption starts to break down. A more accurate fit of the grand potential can be found by adding an additional term proportional to to the Minkowski functional expansion. This was done for the results presented in Figures 13 - 16. Another potential source of error could be that, for very small pores, excluded volume effects keeping molecules away from the wall could be significant.
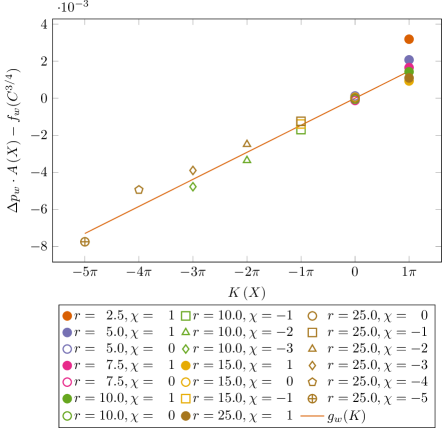
To validate how well the function describes the data, Figure 18 shows the pressure difference between the second-order phase transition associated with adsorption of gas onto a wall in the bulk and inside a pore times the surface area Minkowski functional minus the function , , as a function of the Minkowski functional, . The graph shows a collapse of the data and, as expected, a linear fit with: , where . The collapse of the data confirms that the grand potential and thus the second-order pressure shift in the phase envelope, , is proportional to and is linearly dependent on the topology of the system . In addition, the data shows that the sensitivity of the grand potential to topology is about an order of magnitude smaller than the sensitivity to the pseudo surface tension. The outlier, , , confirms the breakdown of Hadwiger’s theorem for small pore sizes.
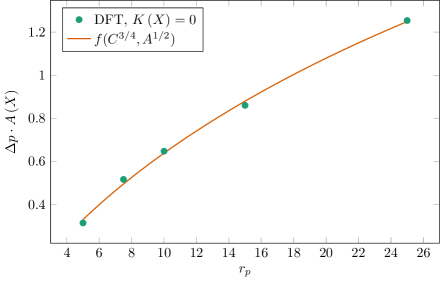
A similar analysis can be performed for the phase envelope shift of capillary condensation, which is a first-order phase transition. Figure 19 shows the pressure difference between the capillary condensation pressure and the bulk phase transition pressure times the surface area Minkowski functional, , as a function of pore radius, . The Minkowski functional for topology is zero in all the DFT simulations shown in Figure 19, . The curve fit is equal to: , where the Minkowski functionals and only depend on . The coefficients are: , , and . The curvature of the simulation data presents a clear case for adding an additional term proportional to to the expansion of the grand potential with Minkowski functionals.
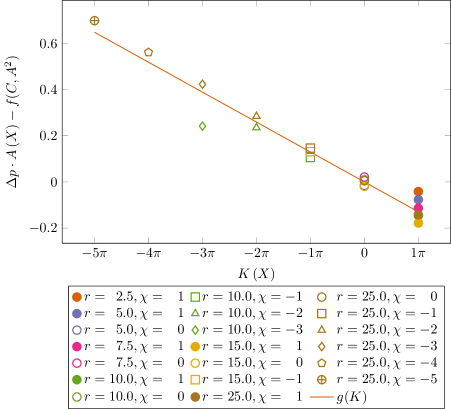
To validate the data fit shown in Figure 19, Figure 20 shows the pressure difference between capillary condensation pressure and the bulk phase transition pressure times the surface area Minkowski functional minus the function from Figure 19, , as a function of the Minkowski functional, . The graph shows a collapse of the data and, as predicted by theory, a linear fit with: , where . The collapse of the data into one single line, confirms that the grand potential is proportional to , , and . The fitting parameters and show that the difference between the capillary condensation pressure and the bulk phase transition pressure is the most sensitive to changes in the pseudo surface tension and the pseudo pressure. The sensitivity to topology changes, represented by the parameter , is much smaller. The outlier, , , is a system where the topology change compared to, , caused an additional phase transition to occur. Surprisingly, a difference between Figure 18 and 20 is that the phase envelope shift dependence on topology is different depending on whether the phase transition is a first-order or a second-order phase transition. This is a topic for further research.
5 Conclusions
We studied the effect of morphology and topology on capillary condensation in a systematic manner using a Minkowski functional framework. Consistent with the literature [27], it is found that hard-sphere fluids obey Hadwiger’s theorem [26] down to quite small pore sizes, especially when using the Minkowski functionals to reconstruct the grand potential. For the excess adsorption, a significantly larger average absolute error between the DFT simulations and the Minkowski functional reconstruction of the excess adsorption is found.
Analyzing the error for various geometries, it is observed that the error decreases rapidly with increasing pore size. However, it is also found that it is not trivial to find a characteristic length scale of the system at which Hadwiger’s theorem starts to break down. While increasing the size of a rod inside a pore has a clear effect on the error, moving a rod around inside a pore while keeping the Minkowski functionals of the system constant has no effect. This can potentially be explained by the fact that topology only has a small contribution to the grand potential for the systems studied in this work.
Changing the system from a hard-sphere fluid to a Lennard-Jones fluid, the interaction length becomes much longer and phase behavior becomes much more complex. This results in larger errors in both the grand potential and the excess adsorption, which can be partly overcome by introducing additional terms in the expansion of the grand potential. Trends in the error observed for hard-sphere fluids are also observed for Lennard-Jones fluids.
Analyzing the contributions of the various Minkowski functional coefficients to the grand potential shows that wall adsorption is dominated by a surface-tension term and pseudo pressure, which is proportional to . During capillary condensation, a pseudo surface tension term proportional to also gains in importance and this regime is characterized by large discontinuities in the coefficients which match the discontinuities caused by capillary condensation. After the bulk phase transition the system is increasingly dominated by the pressure. A similar analysis of the coefficients contributing to the excess adsorption shows the pseudo pressure as a positively contributing term to the wall adsorption and the surface tension as a negatively contributing term. The reason that there are both positive and negative contributions to the excess adsorption is due to the fact that the derivatives present in the Minkowski functional representation of the excess adsorption can be both positive and negative. During capillary condensation, the pseudo surface tension term becomes significantly more important. For both the grand potential and the excess adsorption the effect of topology is modest.
Last but not least, the effect of confinement on phase behavior is investigated. It is found that pressure shift in the second-order phase transition describing adsorption on the pore wall is proportional to and , which is close to what is predicted based on Hadwiger’s theorem. However, the pressure for the first-order phase transition describing capillary condensation is proportional to , and , which is a significant deviation from theory. In addition, the first-order phase transition and the second-order phase transition have the opposite dependence on topology. For first-order phase transitions as a function of the Minkowski functional, , the fitting parameter is positive, while for second-order phase transitions this parameter is positive. Whether this is a finding which holds in general for first- and second-order phase transitions has to be investigated further.
The Minkowski functionals provide a useful framework to study capillary condensation. The separation of geometry and thermodynamics allows for a method to systematically study the effect of surface area, circumference, and the Euler characteristic on phase behavior. This provides many opportunities for future research. One of the many open questions is whether the different effect that topology has on first- versus second-order phase transitions is also found for different Lennard-Jones fluids, or even for first- and second-order phase transitions in general. Another question is whether it is possible to use the Minkowski functionals for upscaling. The idea is to perform a number of simulations on different small geometries with known Minkowski functionals to compute the Minkowski functional coefficients for the excess adsorption. These coefficients are then used to predict the excess adsorption for a much larger experimental disordered porous medium with known Minkowski functionals. Other questions to consider working on are: to continue looking for a characteristic length scale that describes when Hadwiger’s theorem breaks down, study whether sorption hysteresis can be described using the Minkowski functionals, and to study whether the Minkowski functionals can be used for higher molecular weight molecules.
6 Acknowledgements
This work was supported as part of the Center for Mechanistic Control of Water-Hydrocarbon-Rock Interactions in Unconventional and Tight Oil Formations (CMC-UF), an Energy Frontier Research Center funded by the U.S. Department of Energy, Office of Science under DOE (BES) Award DE-SC0019165.
The majority of the computing for this project was performed on the Mazama cluster of the Center for Computational Earth & Environmental Science (CEES) at Stanford University. We would like to thank Stanford University and the Stanford Research Computing Center for providing computational resources and support that contributed to these research results.
References
References
- [1] Vincent Berube, Gregg Radtke, Mildred Dresselhaus, and Gang Chen. Size effects on the hydrogen storage properties of nanostructured metal hydrides: a review. International Journal of Energy Research, 31(6-7):637–663, 2007.
- [2] Lilin He, Yuri B Melnichenko, Nidia C Gallego, Cristian I Contescu, Junjie Guo, and Jitendra Bahadur. Investigation of morphology and hydrogen adsorption capacity of disordered carbons. Carbon, 80:82–90, 2014.
- [3] Teng He, Pradip Pachfule, Hui Wu, Qiang Xu, and Ping Chen. Hydrogen carriers. Nature Reviews Materials, 1(12):16059, 2016.
- [4] Mengya Li, Rachel Carter, Anna Douglas, Landon Oakes, and Cary L Pint. Sulfur vapor-infiltrated 3d carbon nanotube foam for binder-free high areal capacity lithium–sulfur battery composite cathodes. ACS nano, 11(5):4877–4884, 2017.
- [5] Elizabeth Barsotti, Sugata P Tan, Soheil Saraji, Mohammad Piri, and Jin-Hong Chen. A review on capillary condensation in nanoporous media: Implications for hydrocarbon recovery from tight reservoirs. Fuel, 184:344–361, 2016.
- [6] Youssef Belmabkhout, Rodrigo Serna-Guerrero, and Abdelhamid Sayari. Adsorption of co2 from dry gases on mcm-41 silica at ambient temperature and high pressure. 1: Pure co2 adsorption. Chemical Engineering Science, 64(17):3721–3728, 2009.
- [7] Binh T Bui, Hui-Hai Liu, Jinhong Chen, Azra N Tutuncu, et al. Effect of capillary condensation on gas transport in shale: A pore-scale model study. SPE Journal, 21(02):601–612, 2016.
- [8] Yuri B Melnichenko. Supercritical fluids in confined geometries. In Small-Angle Scattering from Confined and Interfacial Fluids, pages 251–309. Springer, 2016.
- [9] Kanka Ghosh and CV Krishnamurthy. Structural behavior of supercritical fluids under confinement. Physical Review E, 97(1):012131, 2018.
- [10] Elliott P Barrett, Leslie G Joyner, and Paul P Halenda. The determination of pore volume and area distributions in porous substances. i. computations from nitrogen isotherms. Journal of the American Chemical society, 73(1):373–380, 1951.
- [11] Laura J Douglas Frink and Andrew G Salinger. Rapid analysis of phase behavior with density functional theory. ii. capillary condensation in disordered porous media. The Journal of chemical physics, 118(16):7466–7476, 2003.
- [12] Benoit Coasne, Anne Galarneau, Francesco Di Renzo, and Roland JM Pellenq. Effect of morphological defects on gas adsorption in nanoporous silicas. The Journal of Physical Chemistry C, 111(43):15759–15770, 2007.
- [13] Geoffrey Mason. The effect of pore space connectivity on the hysteresis of capillary condensation in adsorption—desorption isotherms. Journal of Colloid and Interface Science, 88(1):36–46, 1982.
- [14] G Mason. Determination of the pore-size distributions and pore-space interconnectivity of vycor porous glass from adsorption-desorption hysteresis capillary condensation isotherms. Proceedings of the Royal Society of London. A. Mathematical and Physical Sciences, 415(1849):453–486, 1988.
- [15] L Sarkisov and PA Monson. Modeling of adsorption and desorption in pores of simple geometry using molecular dynamics. Langmuir, 17(24):7600–7604, 2001.
- [16] B Libby and PA Monson. Adsorption/desorption hysteresis in inkbottle pores: a density functional theory and monte carlo simulation study. Langmuir, 20(10):4289–4294, 2004.
- [17] Benoit Coasne, Anne Galarneau, Roland JM Pellenq, and Francesco Di Renzo. Adsorption, intrusion and freezing in porous silica: the view from the nanoscale. Chemical Society Reviews, 42(9):4141–4171, 2013.
- [18] Klaus R Mecke. Integral geometry in statistical physics. International Journal of Modern Physics B, 12(09):861–899, 1998.
- [19] Máximo Bañados, Claudio Teitelboim, and Jorge Zanelli. Black hole entropy and the dimensional continuation of the gauss-bonnet theorem. Physical review letters, 72(7):957, 1994.
- [20] Jens Schmalzing and Krzysztof M Górski. Minkowski functionals used in the morphological analysis of cosmic microwave background anisotropy maps. Monthly Notices of the Royal Astronomical Society, 297(2):355–365, 1998.
- [21] KR Mecke and Herbert Wagner. Euler characteristic and related measures for random geometric sets. Journal of Statistical Physics, 64(3-4):843–850, 1991.
- [22] Klaus R Mecke and Victor Sofonea. Morphology of spinodal decomposition. Physical Review E, 56(4):R3761, 1997.
- [23] Mario Scheel, Ralf Seemann, MDMM Brinkmann, Marco Di Michiel, Adrian Sheppard, Boris Breidenbach, and Stephan Herminghaus. Morphological clues to wet granular pile stability. Nature materials, 7(3):189, 2008.
- [24] Mohammad Saadatfar, Hiroshi Takeuchi, Vanessa Robins, Nicolas Francois, and Yasuaki Hiraoka. Pore configuration landscape of granular crystallization. Nature communications, 8:15082, 2017.
- [25] Klaus R Mecke. Additivity, convexity, and beyond: applications of minkowski functionals in statistical physics. In Statistical Physics and Spatial Statistics, pages 111–184. Springer, 2000.
- [26] Hugo Hadwiger. Vorlesungen über inhalt, Oberfläche und isoperimetrie, volume 93. Springer-Verlag, 1957.
- [27] P-M König, R Roth, and KR Mecke. Morphological thermodynamics of fluids: shape dependence of free energies. Physical Review Letters, 93(16):160601, 2004.
- [28] Klaus Mecke and CH Arns. Fluids in porous media: a morphometric approach. Journal of Physics: Condensed Matter, 17(9):S503, 2005.
- [29] Robert Evans. The nature of the liquid-vapour interface and other topics in the statistical mechanics of non-uniform, classical fluids. Advances in Physics, 28(2):143–200, 1979.
- [30] Hermann Minkowski. Volumen und oberfläche. Mathematische Annalen, 57(4):447–495, 1903.
- [31] Rolf Schneider. Convex Bodies: The Brunn–Minkowski Theory, volume 151. Cambridge University Press, 2013.
- [32] David Legland, Kiên Kiêu, and Marie-Françoise Devaux. Computation of minkowski measures on 2d and 3d binary images. Image Analysis & Stereology, 26(2):83–92, 2011.
- [33] E Kierlik, PA Monson, ML Rosinberg, L Sarkisov, and G Tarjus. Capillary condensation in disordered porous materials: Hysteresis versus equilibrium behavior. Physical review letters, 87(5):055701, 2001.
- [34] Peter I Ravikovitch and Alexander V Neimark. Density functional theory model of adsorption on amorphous and microporous silica materials. Langmuir, 22(26):11171–11179, 2006.
- [35] E Kierlik, PA Monson, ML Rosinberg, and G Tarjus. Adsorption hysteresis and capillary condensation in disordered porous solids: a density functional study. Journal of Physics: Condensed Matter, 14(40):9295, 2002.
- [36] Andrew G Salinger and Laura J Douglas Frink. Rapid analysis of phase behavior with density functional theory. i. novel numerical methods. The Journal of chemical physics, 118(16):7457–7465, 2003.
- [37] R Evans and U Marini Bettolo Marconi. Phase equilibria and solvation forces for fluids confined between parallel walls. The Journal of chemical physics, 86(12):7138–7148, 1987.
- [38] R Evans. Fluids adsorbed in narrow pores: phase equilibria and structure. Journal of Physics: Condensed Matter, 2(46):8989, 1990.
- [39] Pierre Hohenberg and Walter Kohn. Inhomogeneous electron gas. Physical review, 136(3B):B864, 1964.
- [40] Michael A Heroux, Andrew G Salinger, and Laura JD Frink. Parallel segregated schur complement methods for fluid density functional theories. SIAM Journal on Scientific Computing, 29(5):2059–2077, 2007.
- [41] Laura J Douglas Frink and Andrew G Salinger. Two-and three-dimensional nonlocal density functional theory for inhomogeneous fluids: I. algorithms and parallelization. Journal of Computational Physics, 159(2):407–424, 2000.
- [42] Laura J Douglas Frink and Andrew G Salinger. Two-and three-dimensional nonlocal density functional theory for inhomogeneous fluids: Ii. solvated polymers as a benchmark problem. Journal of Computational Physics, 159(2):425–439, 2000.
- [43] John D Weeks, David Chandler, and Hans C Andersen. Role of repulsive forces in determining the equilibrium structure of simple liquids. The Journal of chemical physics, 54(12):5237–5247, 1971.
- [44] Hendrik Hansen-Goos and Roland Roth. Density functional theory for hard-sphere mixtures: the white bear version mark ii. Journal of Physics: Condensed Matter, 18(37):8413, 2006.
- [45] H. B. Keller. Numerical solution of bifurcation and nonlinear eigenvalue problems. In P. Rabinowitz, editor, Applications of bifurcation theory, pages 359–384. Academic Press, 1977.
- [46] Andrew G Salinger, Nawaf M Bou-Rabee, Roger P Pawlowski, Edward D Wilkes, Elizabeth A Burroughs, Richard B Lehoucq, and Louis A Romero. Loca 1.0 library of continuation algorithms: theory and implementation manual. Sandia National Laboratories, SAND2002-0396, 2002.
- [47] Peter I Ravikovitch, Gary L Haller, and Alexander V Neimark. Density functional theory model for calculating pore size distributions: pore structure of nanoporous catalysts. Advances in colloid and interface science, 76:203–226, 1998.
- [48] EA Ustinov, DD Do, and M Jaroniec. Adsorption of argon and nitrogen in cylindrical pores of mcm-41 materials: application of density functional theory. Applied surface science, 252(4):1013–1028, 2005.
- [49] Mietek Jaroniec, Michal Kruk, and James P Olivier. Standard nitrogen adsorption data for characterization of nanoporous silicas. Langmuir, 15(16):5410–5413, 1999.
- [50] DF Brewer and DC Champeney. Sorption of helium and nitrogen on vycor porous glass. Proceedings of the Physical Society, 79(4):855, 1962.
- [51] P Levitz, G Ehret, SK Sinha, and JM Drake. Porous vycor glass: The microstructure as probed by electron microscopy, direct energy transfer, small-angle scattering, and molecular adsorption. The Journal of chemical physics, 95(8):6151–6161, 1991.
- [52] Cédric Boher, Isabelle Martin, Sylvie Lorente, and Fabien Frizon. Experimental investigation of gas diffusion through monomodal materials. application to geopolymers and vycor® glasses. Microporous and Mesoporous Materials, 184:28–36, 2014.
- [53] Lev D Gelb and KE Gubbins. Characterization of porous glasses: Simulation models, adsorption isotherms, and the brunauer- emmett- teller analysis method. Langmuir, 14(8):2097–2111, 1998.