Diffusion and viscosity of non-entangled polyelectrolytes.
Abstract
We report chain self-diffusion and viscosity data for sodium polystyrene sulfonate (NaPSS) in semidilute salt-free aqueous solutions measured by pulsed field gradient NMR and rotational rheometry respectively. The observed concentration dependence of and are consistent with the Rouse-Zimm scaling model with a concentration dependent monomeric friction coefficient. The concentration dependence of the monomeric friction coefficient exceeds that expected from free-volume models of diffusion, and its origin remains unclear. Correlation blobs and dilute chains with equivalent end-to-end distances exhibit nearly equal friction coefficients, in agreement with scaling. The viscosity and diffusion data are combined using the Rouse model to calculate the chain dimensions of NaPSS in salt-free solution, these agree quantitatively with SANS measurements.
I Introduction
Polyelectrolytes are essential components of living systems, where they form interpenetrating networks that impart mechanical integrity to biological tissue. Understanding the structure and dynamics of polyelectrolytes networks is an important step towards unravelling complex transport phenomena in biological environments, which underpin many physiological processes such as muscle contraction, nerve signalling or joint lubrication.Horkay, Tasaki, and Basser (2000); Schw rer et al. (2018); Ballauff (2018)
The strong, long ranged electrostatic interactions between like-charged chains means that polyelectrolyte solutions and gels are highly correlated systemsYethiraj (2009); Chang, Kim, and Yethiraj (2015); Muthukumar (2017); Dobrynin and Rubinstein (2005); Dedic, Okur, and Roke (2019); Chremos and Douglas (2018a); Chremos and Horkay ; Morishima et al. (2018); Jia and Muthukumar (2019); Muthukumar (2019); Chen, Perazzo, and Stone (2020), for which the success of mean field theories (e.g. the random phase approximation) is limited, particularly in low ionic strength solvents.Barrat and Joanny (1996); Dobrynin and Rubinstein (2005) Scaling models, following the pioneering work of de Gennes and co-workersDe Gennes, P.G. et al. (1976); Pfeuty (1978); Noda and Takahashi (1996); Dobrynin, Colby, and Rubinstein (1995); Liao et al. (2007); Carrillo and Dobrynin (2011), provide a relatively simple and useful framework to understand polyelectrolyte behaviour, and are particularly successful in predicting the conformational properties of flexible polyelectrolytes in solution.Lopez and Richtering (2018) The scaling treatment of polyelectrolyte dynamics on the other hand displays poorer agreement with experimental results.Boris and Colby (1998); Di Cola et al. (2004); Lopez and Richtering (2018, 2019); Lopez (2019a, b)
In salt-free or low ionic strength media, polyelectrolytes adopt highly extended conformationsStevens and Kremer (1995); Lopez and Richtering (2018); Lopez et al. (2016); Lopez (2019b); Mintis and Mavrantzas (2019); Lopez (2019a); Mintis et al. (2019); Soysa, Dünweg, and Prakash (2015); Mantha and Yethiraj (2015); Xu et al. (2016); Gupta and Natarajan (2019), meaning that their solutions are above the overlap concentration () for most practical applications. While the overlap concentration of polyelectrolytes is much lower than that of non-ionic polymers, especially for high degrees of polymerisation (), the entanglement concentration () is only weakly dependent on charge fractionDou and Colby (2006); Lopez (2019a). As the result, there exists a wide range in the phase space where polyelectrolytes are in the semi-dilute non-entangled regime ().Lopez and Richtering (2018); Lopez (2019a, b) For example, sodium polystyrene sulfonate (NaPSS) with displays in salt-free water. By comparison, for polystyrene with equivalent degree of polymerisation in good solvent.Lopez (2019a)
Single chain diffusion measurements provide an important test to the microscopic description of polymer dynamics put forward by various theoriesVagias et al. (2013); Seiffert and Oppermann (2008). In the context of polyelectrolytes, chain diffusion has been studied primarily in the excess salt, zero polymer concentration limit by dynamic light scatteringSerhatli et al. (2002); Yashiro and Norisuye (2002); Sedlák (2017), as well as by NMR, fluorescence methods and centrifugation in the infinite polymer dilution limit, both in salt-free and excess added saltLopez and Richtering (2018); Böhme and Scheler (2007a); Scheler (2009); Böhme and Scheler (2007b); Cao, Wu, and Zhang (2015); Wandrey and Ahmadloo (2016); Wang, Ye, and Zhang (2015). Measurements above have received far less attentionFilippov et al. (2013); Oostwal and Odijk (1993); Oostwal et al. (1993), and most experimental data come from two studies by Oostwal and co-workersOostwal and Odijk (1993); Oostwal et al. (1993), who investigated the molar mass, polymer concentration and added salt concentration variation of the diffusion coefficient of NaPSS in D2O. Studies on solvent, counter-ion and co-solute diffusion in polyelectrolyte and ionomer solutions and gels have also been reported. Schipper, Kassapidou, and Leyte (1996); Schipper, Hollander, and Leyte (1998); Schneider and Rivin (2006); Senanayake et al. (2019); Guo et al. (2019a, b); Sozanski et al. (2016); LaFemina et al. (2016); Bai et al. (2014)
Rheological data, particularly the zero shear-rate viscosity of solutions, provide a complementary test to the macroscopic dynamics of polyelectrolytes Noda and Takahashi (1996); Boris and Colby (1998); Lopez and Richtering (2018, 2019); Dou and Colby (2006, 2008); Di Cola et al. (2004). Due to the relative ease with which such measurements can be carried out, a vast literature on the viscosity of polyelectrolytes exists, covering a wide range of polyelectrolyte typesZheng et al. (2018); Dakhil, Auhl, and Wierschem (2019); Fouissac, Milas, and Rinaudo (1993), molar massesBoris and Colby (1998); Fouissac, Milas, and Rinaudo (1993); Izzo, Cloitre, and Leibler (2014); Bravo-Anaya, Rinaudo, and Mart nez (2016), charge densitiesChen et al. (2019a, 2020); Konop and Colby (1999), solvent qualityWaigh et al. (2001), dielectric constantDou and Colby (2008); Jimenez et al. (2018); Rozanska et al. (2019); De and Das (2020) and added saltsDi Cola, Waigh, and Colby (2007); Turkoz et al. (2018); Bercea and Wolf (2018, 2019); Pavlov et al. (2018); Jimenez, Martínez Narváez, and Sharma (2020); Lopez (2019b).
The viscosity of polyelectrolyte solutions was first studied by Fuoss and co-workers Fuoss (1948); Fuoss and Strauss (1949), who observed a linear dependence of the reduced viscosity () and the on the square root of the polymer concentration for poly-4-vinylpyridine derivatives in water-ethanol mixtures. Similar behaviour was observed for many other systems and eventually became known as the Fuoss lawColby (2010); Lopez and Richtering (2019). A theoretical explanation for this unusual dependence was first put forward by de Gennes’ and co-workersDe Gennes, P.G. et al. (1976), and later incorporated into the theories of Yamaguchi et alYamaguchi et al. (1992) and Dobrynin et alDobrynin, Colby, and Rubinstein (1995) among others. Boris and ColbyBoris and Colby (1998) identified significant deviations from the Fuoss law for NaPSS in DI water, and after a careful review of literature data concluded that much (but not all) of the observed behaviour could be attributed to artefacts related to shear thinning and/or salt contamination.Boris and Colby (1998) Deviations to stronger power-laws have also been reported for other systemsLopez et al. (2016); Lopez (2019b); Behra et al. (2019); Del Giudice et al. (2017); Kujawa et al. (2006). Recently, an extensive analysis of literature data for the viscosity of non-entangled NaPSSLopez and Richtering (2019) in salt-free water showed that the power-law exponent of the specific viscosity with concentration increases with increasing polymer concentration, and agrees with the Fuoss law only for M. The origin of the concentration dependence of the viscosity-concentration exponent could however not be established as viscosity and diffusion data were in apparent conflict.Lopez and Richtering (2018, 2019); Oostwal and Odijk (1993); Oostwal et al. (1993)
While it is common to treat solvent dynamics as independent of polymer concentration, it is known that the addition of polymers, salts, co-solvents or nanoparticles alters the cohesive energy between solvent moleculesGong et al. (2001); Bai et al. (2014); Cicerone and Douglas (2012); Andreev et al. (2017, 2018); Psurek et al. (2008); Bhadauriya et al. (2018). The structuring of water by solutes with ionic groups in particular has received renewed attention over the last few years, as recent results indicate that nuclear quantum effects Belloni, Borgis, and Levesque (2018); Jungwirth and Laage (2018); Chen et al. (2018). This leads to changes the thermodynamic and transport properties of solvents, a feature that is not considered by continuum theories such as Rouse-Zimm models. Experimental findings show that addition of polymers to a solvent leads to a slow-down of solvent dynamics, which can be captured based on obstruction or free-volume models.Mackie, Meares, and Rideal (1955); Fujita (1991); Colby et al. (1991) Other effects not included in the scaling theories are the influence of counterion solvation and polyelectrolyte clusteringTarokh, Karan, and Ponnurangam (2019); Sedlak (1996); Sedlák (1999); Sedlák and Amis (1992); Chremos and Douglas (2018a, b); Narayanan Krishnamoorthy, Holm, and Smiatek (2018). The impact of these on the dynamics of polyelectrolytes is not well understood at present.
The purpose of this work is to present new results for the viscosity and diffusion coefficient of NaPSS in salt-free solution as a function of polymer concentration and molar mass, and to compare these with scaling predictions. The paper is organised as follows: we first outline the scaling theory of non-entangled salt-free polyelectrolytes and review the available experimental data. We then present diffusion and viscosity results for NaPSS and show that scaling can account for most experimental observations if a concentration dependent monomeric friction coefficient is assumed. Possible explanations for the strong concentration dependence of the monomeric friction factor are considered. We discuss significance of the product of the viscosity increment and the diffusion coefficient, and show that it can be used to obtain quantitative estimates of the dimensions of non-entangled chains. Some observations, particularly a discrepancy between the theoretical and experimental dependence of the specific viscosityLopez and Richtering (2018) remain unexplained.
II Literature Review
II.1 Polyelectrolyte Scaling
Polyelectrolytes in dilute solution adopt a rod-like conformation with an end-to-end distance of , where is the effective monomer size and the degree of polymerisation.Dobrynin, Colby, and Rubinstein (1995); Boris and Colby (1998); Lopez (2019a); Not (a); Lopez (2019b) The overlap concentration scales as . For polyelectrolytes interpenetrate, forming a mesh with size , also known as the correlation length. Their conformation is a random-walk of correlation blobs, with an end-to-end distance of .Lopez and Richtering (2018)
The scaling theory of de Gennes and co-workers’ treats semidilute polyelectrolyte chains as Rouse chains made up of correlation blobs.De Gennes, P.G. et al. (1976) In salt-free solution, each correlation blob assumes a rod-like conformation with diameter and length . The scaling theory approximates the friction coefficient as:
| (1) |
where is a shape factor ( for spheres) and is a coefficient related to the local friction experienced by polymer chains. Scaling assumes and , where is the viscosity of the solvent.Dobrynin, Colby, and Rubinstein (1995)
The Rouse model expects to total friction coefficient to be that of a single correlation blob multiplied by the number of blobs in a chain:
| (2) |
which Dobrynin et al’s model expects to be concentration independent.Dobrynin, Colby, and Rubinstein (1995); Dobrynin and Rubinstein (2005); Colby (2010)
The Rouse diffusion coefficient of a chain is obtained via the Einstein-Smoluchowski relation:
| (3) |
where and are the Boltzmann constant and the absolute temperature respectively.
The chain’s relaxation time is so that:
| (4) |
where the factor of in Eq. 4b was calculated by Rouse, and is not usually included in scaling theories.
II.2 Experimental results on polyelectrolytes
We now turn our attention to the experimental results from the literature, specifically for NaPSS in water, the most extensively studied polyelectrolyte system. The conformational properties of NaPSS in salt-free solution are in nearly quantitative agreement with the scaling predictionsLopez and Richtering (2018), but larger deviations from theory are observed for dynamic quantities.Boris and Colby (1998); Lopez and Richtering (2018, 2019); Lopez (2019a) Of particular interest for this study is the fact that the specific viscosity of NaPSS shows a strong increase with polymer concentration beyond M, displaying exponential behaviour that is not anticipated by Dobrynin et al’s model.Lopez and Richtering (2019)
We define a function that accounts for deviations from the scaling prediction as follows:
| (6) |
where refers to the solution property (e.g. , ), and the subscripts and refer to the experimental result and the theoretical value respectively.
For , two recent studiesLopez and Richtering (2018, 2019) of semidilute, non-entangled NaPSS solutions showed that could be written as , where
and
where in units of moles of repeating units per dm3 and is a and independent constant of order unity.Lopez and Richtering (2018, 2019)
The function displayed a more complex dependence, with the and parts not being separable. At low polymer concentrations is observed. The divergence between and is somewhat surprising, as the simplest explanation for a independent slow-down of non-entangled polymer dynamics at high concentrations is an increase in the local friction experienced by polymer chains, which would affect both functions in precisely an inverse manner (i.e. ).
In contrast to , which was determined from data originating from nearly 20 different literature sourcesLopez and Richtering (2018, 2019), the evaluation of was carried out using the results of only two studies. In the current paper, we present new data for the diffusion coefficient of NaPSS in salt-free solution in order to compute over a wider range of and . We show that the and functions are consistent with the scaling theory coupled with a dependent , but the origin of this dependence remains unclear.
III Materials and Methods
Materials: Sodium polystyrene sulfonates with weight-averaged molar masses of 9.7, 14.9, 20.7, 29.2, 63.9, 148, 151 and 259 kg/mol were purchased from Polymer Standard Services (Mainz, Germany). DI water was obtained from a Milli-Q source. D2O was purchased from Sigma-Aldrich (conductivity 2 S/cm. Samples were prepared gravimetrically and stored in plastic vials.
| (g/mol) | (M)a | (M)b | |
|---|---|---|---|
| 5.1 | 1.04 | ||
| 2.2 | 1.04 | ||
| 1.1 | 1.05 | ||
| 5.9 | 5.7 | 1.06 | |
| 1.2 | 1.2 | 1.04 | |
| 2.0 | 2.2 | 1.04 | |
| 4.9 | 7.0 | 1.02 |
Rheology: A Kinexus-Pro rheometer with a cone-and-plate geometry (40 mm diameter, 1∘ angle) or a plate-plate geometry (20 mm, gap 0.4 mm gap) was employed for the steady and oscillatory shear experiments.
Pulsed-Field Gradient Nuclear Magnetic Resonance (PFG-NMR): 1H NMR diffusion experiments were run on a 500 MHz Bruker Avance NEO II spectrometer with a Bruker DIFFBBI probe head. All measurements were performed at 298.15 K. The polymers were dissolved in D2O to suppress the water signal and to obtain a lock signal in the NMR experiment. 5 mm NMR tubes were filled with 500 L of polymer solution. For all measurements, the stimulated echo pulse sequence combined with two gradient pulses was used. Thirty-two scans were accumulated for each gradient setting. The time delay between two gradient pulses was set to 25 ms. The gradient pulses were adjusted to strengths between 5 and 500 G/cm with a duration 1.0 ms. All measurements (the full set of gradient strengths under the variation from 5 to 500 G/cm) were repeated four times.
IV Results and Data Analysis
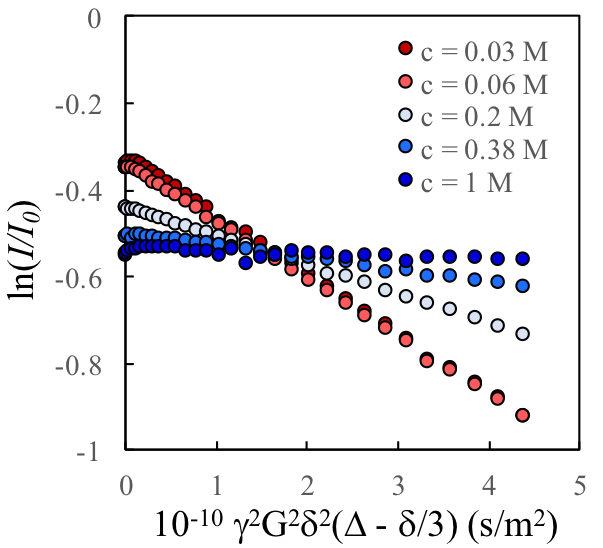
PFG-NMR can be used to study molecular diffusion in solutionGuo et al. (2017); Williamson et al. (2017). The PFG-NMR technique combines the ability to reveal information on the chemical nature as well as on the molecular or collective translational mobility of the individual components. The observed molecules, may be assigned to a structural part of the dispersion depending on its characteristic motional behaviour. Stejskal and Tanner (1965); Linders et al. (2012) In a homogeneous solution, the free self-diffusion coefficients of the dissolved molecules can be determined with the PFG-NMR. In the given case, all PFG-NMR experiments consist of the application of two field gradient pulses combined with a stimulated echo pulse sequence (90∘-1-90∘-2-90∘-1-echo). The pulse gradients with a gradient strength and duration are applied during both of the waiting periods 1 with an overall separation . In the presence of free diffusion with a diffusion coefficient , this leads to a decay of the echo intensity with respect to the original value (for ) according to:
with being the gyromagnetic ratio of the hydrogen nucleus. The value of the apparent diffusion constant is equal to the negative slope of the data points in the Stejskal-Tanner plot (ln versus .Stejskal and Tanner (1965); Stejskal (1965); Tanner and Stejskal (1968)
Plots of the decay of the echo intensity for the NaPSS sample with kg/mol for different polymer concentrations in salt-free D2O are shown in Figure 2. The DOSY spectra for the sample is shown in the SI.
The viscosity data did not display any appreciable shear thinning over the shear rate range probed (1-600s-1), as expected given the relatively short relaxation times of the low molar mass polymers studiedLopez and Richtering (2018).
V Discussion
V.1 Calculation of
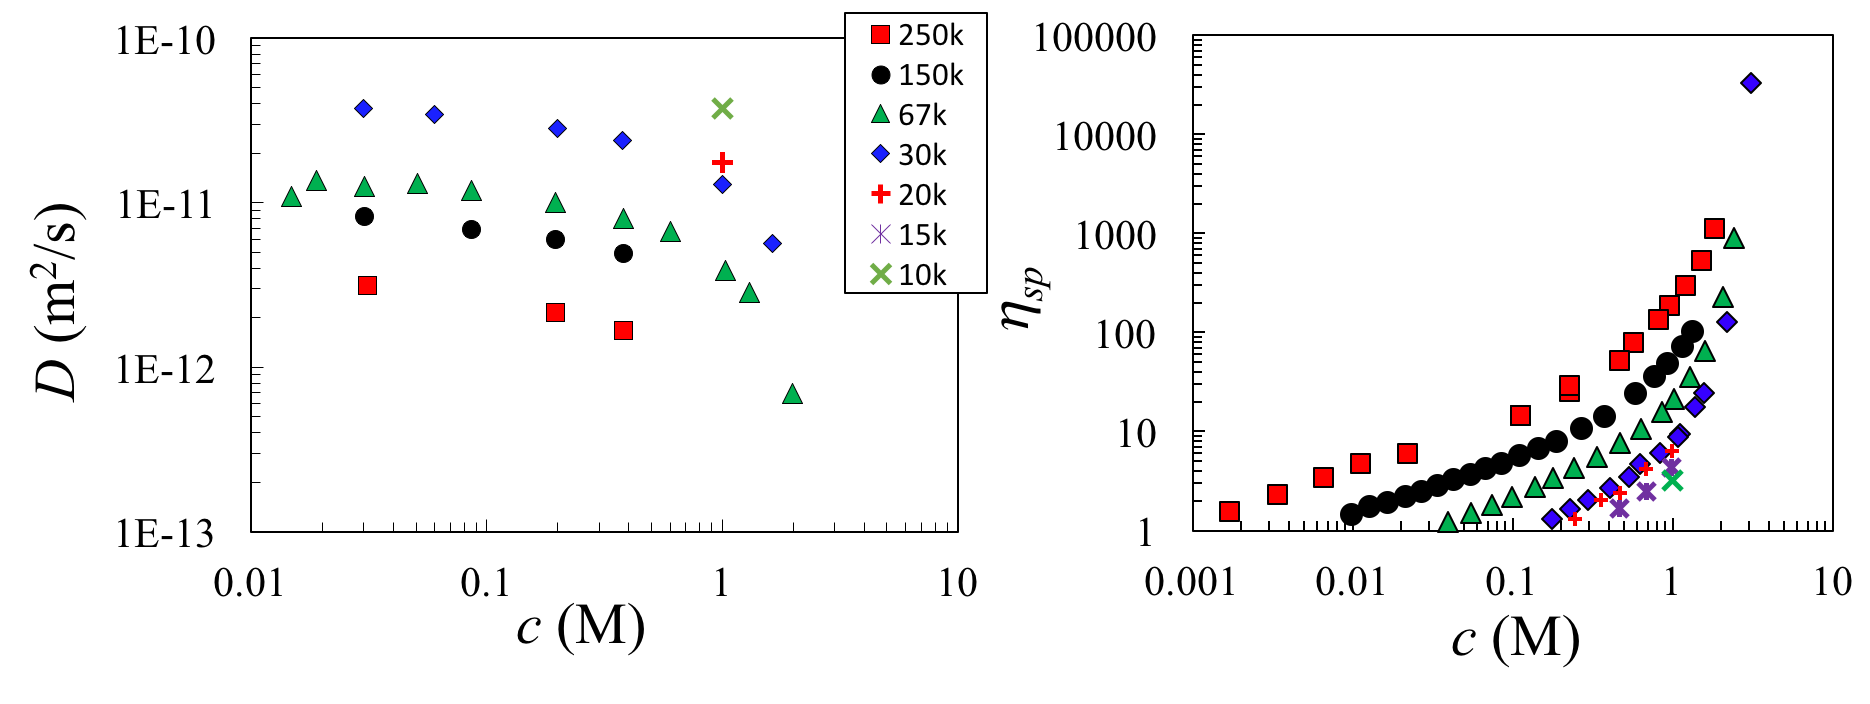
Figure 2 displays the diffusion coefficient and specific viscosity of NaPSS as a function of polymer concentration in salt-free aqueous solution. The data follow the scaling predictions at low concentrations and , followed by a sharp decrease in and increase in in the high concentration region.
As discussed in the introduction, the simplest explanation for the observed deviations from scaling, which are quantified by the function is to assume a concentration-dependent friction coefficient . This interpretation leads to two requirements: First, following Eqs. 3, 5 and 6, a change in local friction is expected to affect the diffusion coefficient and viscosity inversely, so that . Second, because local properties such as the monomeric friction coefficient are insensitive to the overall chain length, the shape of must be independent. Note that the second requirement does not necessitate that , but . An alternative interpretation, were is assumed to vary with concentration, is discussed in the next section.
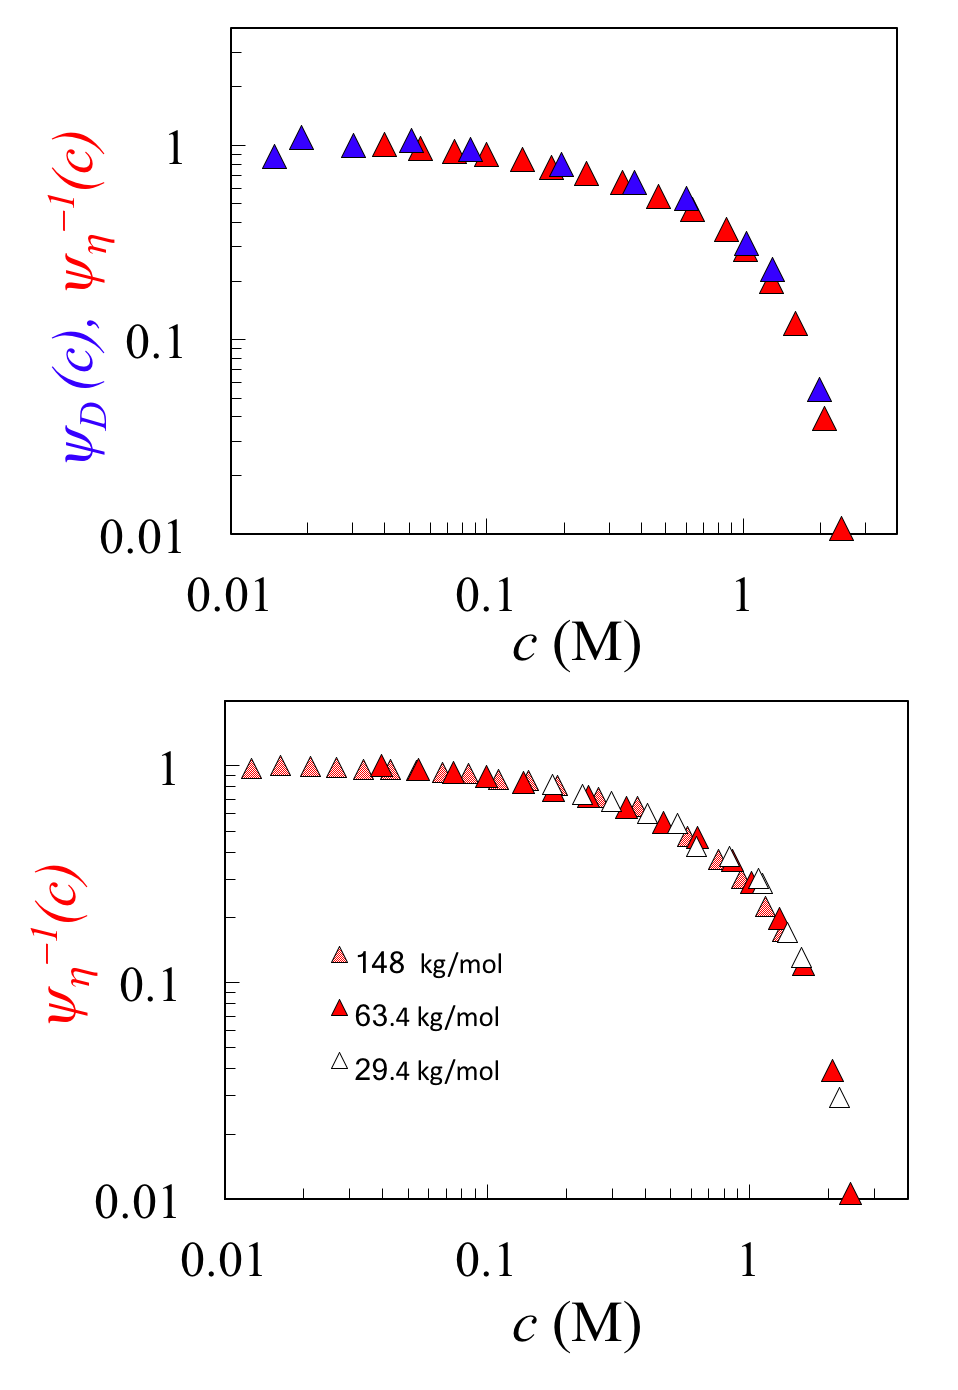
Figure 3a compares and for NaPSS samples with g/mol. The agreement between the two functions is superb. This contrasts with the findings of an earlier studyLopez and Richtering (2019), where the same viscosity data were compared with diffusion data by Odijk and OoswaldOostwal and Odijk (1993).
The independence of on is verified in Fig. 3b for of three different molar masses. is calculated by dividing experimental data for by Eq. 5 and adjusting the lowest concentration to for the g/mol sample. For the and g/mol samples, data at sufficiently low concentrations to observe a plateau in are not available and we therefore normalise the lowest concentrations to the g/mol sample. Very good agreement is observed in Fig. 3b over the entire concentration range considered, supporting the interpretation.
V.2 The shape factor
V.2.1 Hydrodynamic models
A quantitative comparison of scaling laws with dynamic data for polyelectrolytes requires a precise knowledge of . As the quantities and only appear as a product in the scaling laws outlined in the introduction, their individual evaluation is challenging. We proceed as follows: at low polymer concentrations, we suppose that solvent dynamics are not modified by the polymer, which in turn means that is a reasonable assumption. Using previously reported SANS measurements of the correlation lengthPrabhu et al. (2003) and effective monomer sizeKassapidou et al. (1997), we estimate the friction coefficient of a correlation blob as .Lopez and Richtering (2018) Figure 4 plots the concentration dependence of for NaPSS samples with 148 and 29.1 kg/mol. Our data for other molar masses and Oostwal and co-workers’s dataOostwal and Odijk (1993); Oostwal et al. (1993) for fall in between these values, and are generally closer to the triangles, see the supporting information for more details. A comparison is made with the friction coefficients calculated Eq. 2 using the scaling value of and that of a cylinder, which is given byTirado and de la Torre (1979):
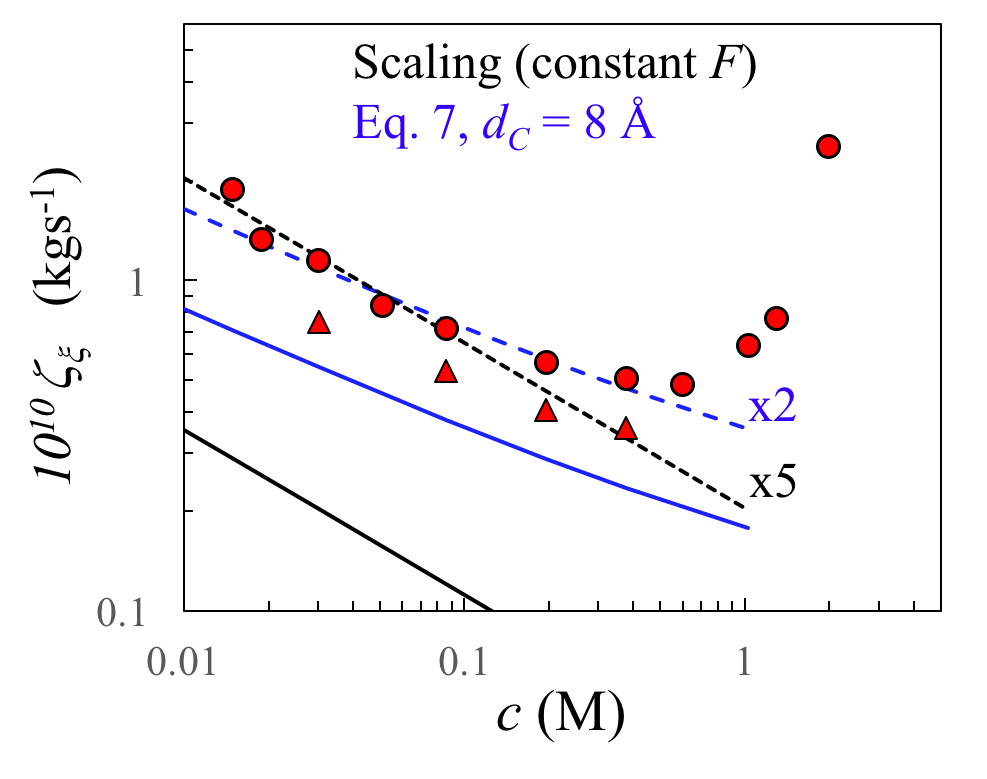
| (7) |
where and are the length and the cross-sectional diameter of the cylinder respectively. The former can be identified with the correlation blob and the latter is taken to be 10 Å.Kassapidou et al. (1997)
Using either the scaling value of or fail to describe the data quantitatively. Setting instead correctly describes experimental results for , see also Table 2. At higher polymer concentrations, the downturn in the friction coefficient can be assigned as discussed in the preceding section, to an increase in with increasing polymer concentration.
Alternatively, using Eq. 7 could account for results if is multiplied by a factor of 1.4-2 (see dashed line). Under this scenario, for would be entirely explained by the concentration dependence of , with in that concentration range. Inserting Eq. 7 into Eq. 5 predicts a power-law exponent for the specific viscosity with concentration stronger than 0.5 at low polymer concentrations, which is inconsistent with the experimental data for the viscosity of NaPSS Boris and Colby (1998); Lopez and Richtering (2018, 2019); Lopez (2019a). Conductivity dataColby et al. (1997); Bordi, Cametti, and Colby (2004); De and Das (2007); Ray, De, and Das (2016) on the other hand display a logarithmic dependence on polymer concentration in dilute solution, which is interpreted as arising from the first term in the square brackets of Eq. 7.
It is possible to reproduce the experimental value of with the cylinder friction factor if a constant is assumed. Such behaviour could arise if, for example, the ionic cloud around the polyelectrolyte backbone causes the hydrodynamic cross-sectional radius of the chain to increase with decreasing concentration as .
| Model | ||
|---|---|---|
| Sphere | 4 | |
| Cylinder | 1.7-2.4 | |
| Zimm | 5.2a | 1 |
| Scaling | 1 | 5 |
| Experiment | 1 |
V.2.2 Comparison of dilute and semidilute chain diffusion
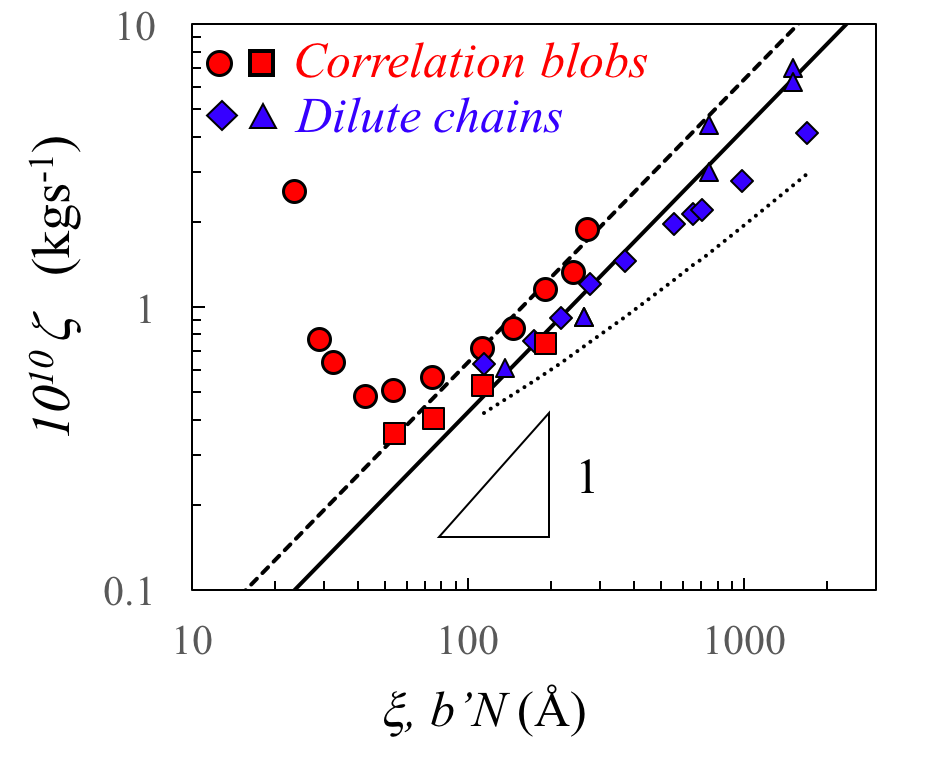
The scaling assumption to calculate polymer dynamics is that chains display dilute-like behaviour (Zimm dynamics) for distances smaller than the correlation length and melt-like behaviour (Rouse dynamics) on larger length-scales. Figure 5 tests this assumption by comparing the friction coefficient of correlation blobs (red symbols) with those of dilute chains of the same length (blue symbols). Both datasets are seen to differ by a factor of , supporting the validity of the scaling theory.
V.3 Calculation of
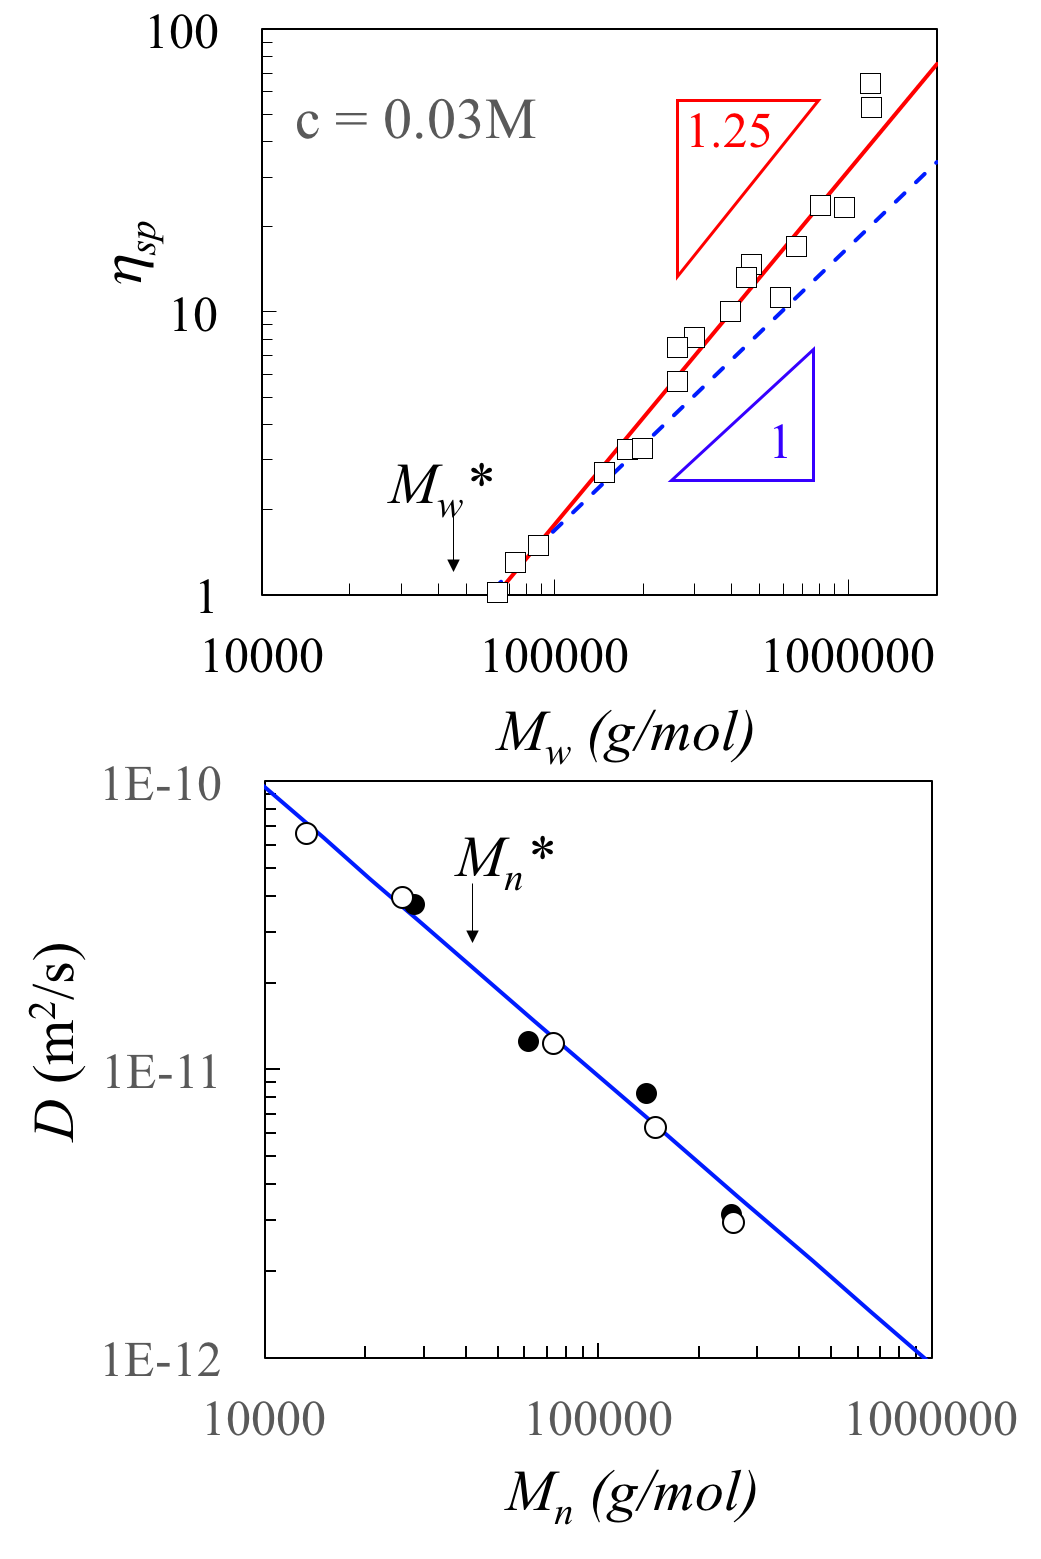
Figure 6a compares the dependence of the specific viscosity on the polymer molar mass with the Rouse prediction of . As discussed in earlier workLopez and Richtering (2018), a power-law of is seen to give a better description of the experimental results over the entire range. An earlier study has shown that this power-law persists well into the dilute region, which is at odds with the scaling assumption of Zimm dynamics in dilute salt-free solution.Lopez (2019a) The diffusion coefficient, plotted as a function of in Fig. 6b, appears to follow the Rouse prediction of , with no apparent change in scaling across the overlap degree of polymerisation. The vs. dataset does not cover a sufficiently broad range of degree of polymerisation to distinguish between a power-law of or . The same dependences are observed at higher concentrations of up to M, see the SI.
V.4 Comparison with models of solvent dynamics
The preceding discussion suggests that the sharp drop in cannot be accounted for by either the influence of entanglements or hydrodynamic corrections to the shape factor .
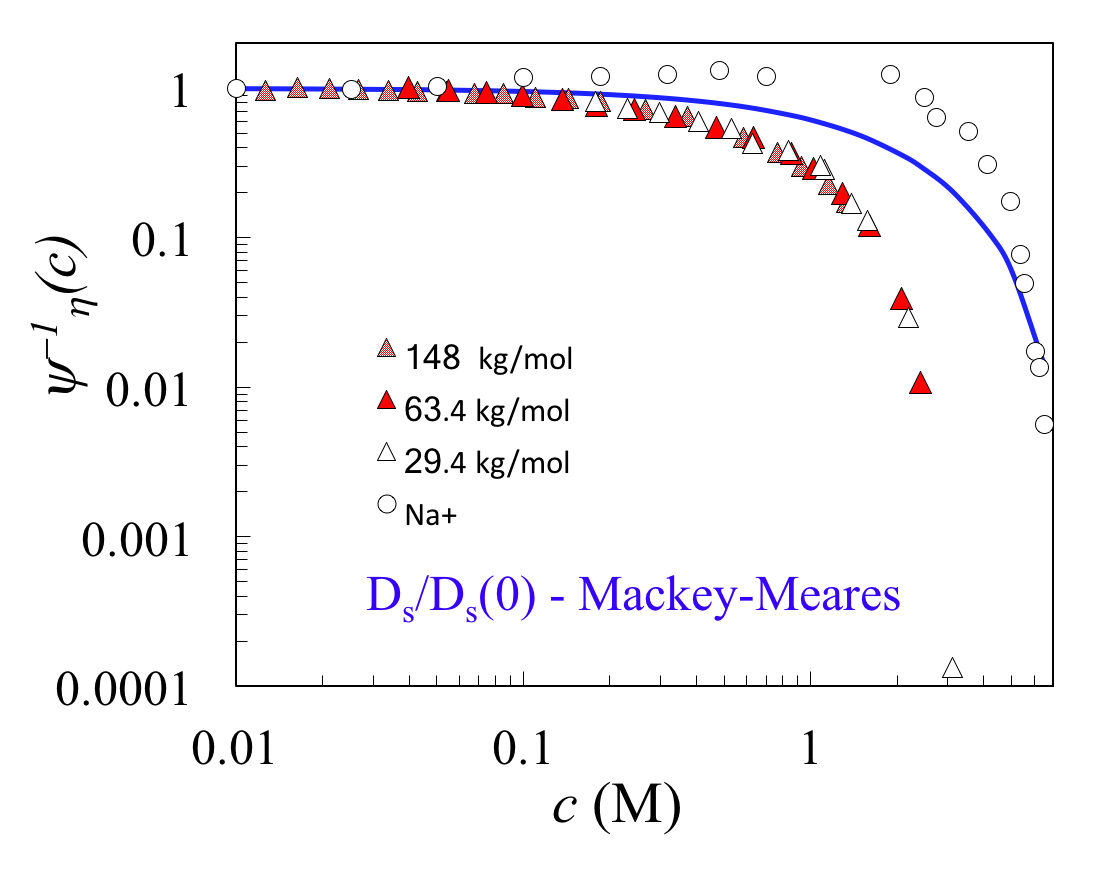
The simplest explanation therefore appears to be a slow down in the solvent diffusion with increasing polymer concentration. This phenomenon has been observed for many polymer solvent systems, and might be particularly strong for polyelectrolytes due to the ordering of water around the ionic groups Quezada et al. (2020); Sappidi, Muralidharan, and Natarajan (2014); Kubincova, Hunenberger, and Krishnan (2020); Schlaich, dos Santos, and Netz (2019). In this scenario the scaling laws outlined in section II.1 need to be applied with . Several theories of solvent diffusion in polymer solutions have been put forward in the literature. Mackie and MearesMackie, Meares, and Rideal (1955) developed an obstruction model which expects the solvent diffusion to depend on on the polymer volume fraction () as:
| (8) |
Equation 8 has been shown to correctly describe the dependence of on polymer concentration for a large number of polymer-solvent pairs, including polyelectrolytesBai et al. (2014).
Fujita introduced a model where the free volume available per molecule is estimated as an additive contribution from solvent and soluteFujita (1991):
| (9) |
where is the total free volume of the solution and and are the free volume of the pure polymer and solvent respectively. Models based on Fujita’s concept of additive free volume predict:
| (10) |
where is often taken to be a constant of order unity. The Vrentas-Duda model gives a similar prediction, but is a function of polymer concentration , where is the density and the subscripts and refer to the polymer and solvent. is a constant specific to each polymer-solvent system.Sturm et al. (2019)
Figure 7 compares the concentration dependence of with Eq. 8. The latter is shown to predict a much weaker dependence of solvent dynamics on concentration than what is observed for NaPSS chains. Free volume models give a similarly weak dependence of the friction coefficient with concentration. The various terms in Eq. 9-10 could in principle be evaluated from the temperature dependence of the viscosity as a function of polymer concentration. Such data have proven useful when interpreting the dynamics of salts, proteins, nanoparticles and polymers in solution.Bhadauriya et al. (2018); Psurek et al. (2008); Cicerone and Douglas (2012); Colby et al. (1991) Unfortunately, with our current setup, evaporation prevents us from measuring the solution viscosity over a wide enough temperature range to evaluate our data according to the procedures outlined in refs Gong et al. (2001); Schneider and Rivin (2010); Colby et al. (1991).
The diffusion coefficient of the sodium counter-ion in salt-free solutions of NaPSS, reported in refs. [126; 127] does not show a concentration dependence up to M, beyond which a sharp drop, similar to that of NaPSS chains is observed. The independence of on concentration up to M supports the idea of a weak concentration dependence of the solvent diffusion.
Other effects, including the influence of coupled chain motion Chen et al. (2019b) or hydrophobic clusteringZhang and van der Vegt (2016) may affect the shape of the function, but we do not have a way of quantifying them at present. At high polymer mass fractions, the dielectric constant of polyelectrolyte solutions varies non-monotonically with concentrationBordi, Cametti, and Colby (2004); Bordi et al. (2002), which is expected to affect polyelectrolyte conformationLiu, Chen, and Chen (2017). This feature, along with a possible breakdown of Debye-Huckel screeningJacinto-Méndez et al. (2018); Matsumoto et al. (2019) may be related to the observed increase in the osmotic coefficient for NaPSS and other polyelectrolytes beyond M,Wang and Bloomfield (1990); Ullner, Qamhieh, and Cabane (2018) concurrent with a change in the scaling of the correlation length from to .Nishida, Kaji, and Kanaya (2001); Lorchat et al. (2014) While these observations suggest a cross-over to a concentrated regime, the conformation of NaPSS displays a monotonic decrease in with increasing polymer concentration up to M, which closely the predictions of the scaling theoryLopez and Richtering (2018).
In summary, the above observations suggest that the monomeric friction factor of NaPSS exhibits a strong concentration dependence beyond which cannot be assigned to a change in solvent dynamics or the influence of entanglements. Interchain friction therefore appears as the most likely cause for the strong exponents observed for the viscosity and diffusion coefficient of NaPSS.
Our findings are consistent with data for sodium polymethacrylate (NaPMA) in non-entangled, salt-free D2O solutionSchipper and Leyte (1999); Not (b), which show a decrease in the single chain diffusion coefficient of of NaPMA relative to that of the solvent for M. The function calculated for their data shows agreement with our results, see the supporting information. Diederichsen et al’s data for the diffusion of polysulfone ionomers (PSU) in DMSODiederichsen, Terrell, and McCloskey (2019); Diederichsen (2019) display qualitatively similar behaviour to the data presented in this paper: the viscosity and diffusion coefficient of PSI display a sharp increase and decrease respectively at high polymer concentrations. These features cannot be fully accounted for by changes in solvent dynamics, as their measurements show that DMSO diffusion slows down only modestly at high polymer concentrations. Entanglement can also be ruled out given the low degree of polymerisation of the PSU chains and the observed exponents of and .
V.5 Estimating chain dimensions from viscosity and diffusion data
The Rouse model relates the viscosity, diffusion and chain dimensions of non-entangled chains as:
| (11) |
where is a factor that accounts for polydispersity effects111If is measured from the initial slope of the PFG-NMR signal (i.e. ), then for semidilute non-entangled solutions. The scaling theory gives the same result as Eq. 11 but with the left hand side multiplied by a factor of 36. Equation 11 has been shown to work within 10-20% accuracy for non-entangled neutral polymers in concentrated solutions and in the melt. Nemoto et al. (1991, 1989)
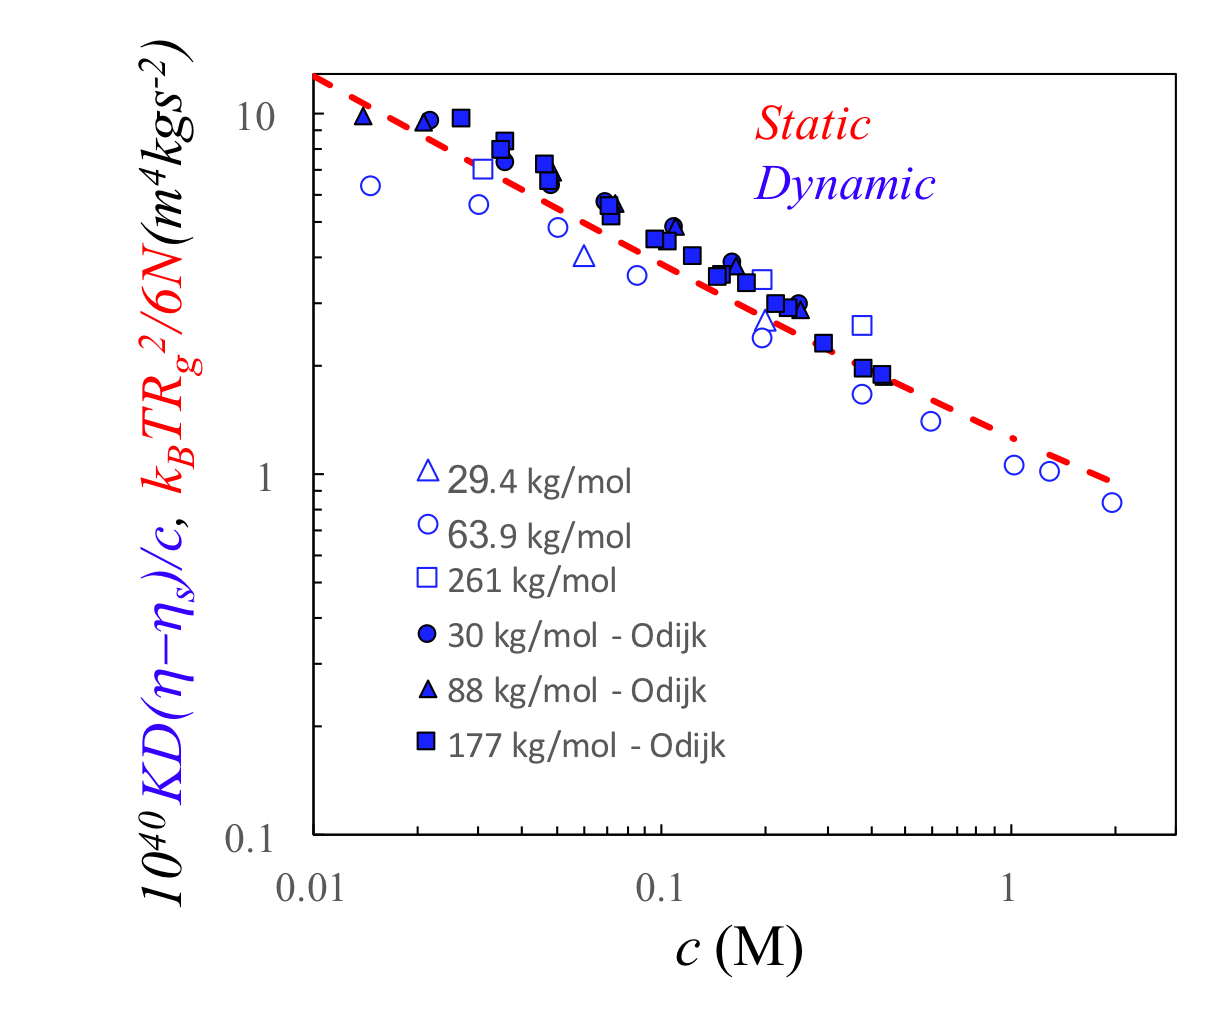
The advantage of Eq. 11 is that it relates static () and dynamic (, ) experimental observables in a way in which the effects of local friction, quantified through parameter , are cancelled out. 222we have multiplied all diffusion coefficients by a factor of 1.2 to account for the fact that the viscosity of D2O is 20% larger than that of H2O at K. Figure 8 compares the chain dimensions of NaPSS calculated from Eq. 9 (blue symbols) with those directly measured by SANS, see ref. 22 for a compilation of the SANS data. Very good agreement is observed between the two methods over the entire concentration range studied, demonstrating the validity of the Rouse model for salt-free polyelectrolytes. Table 3 compares estimates for the chain dimensions of NaPSS using the Rouse model, the scaling formula based on the correlation length and direct measurements by SANS. The three estimates are seen to agree within experimental error.
| Method | (Å2) |
|---|---|
| † | |
| 14 3 | |
| SANS | 12 2 |
VI Conclusions
We have studied the diffusion and viscosity properties of NaPSS in salt-free aqueous solution as a function of degree of polymerisation and concentration. We show that while and depart from scaling predictions, their product does not, suggesting that the observed differences between theory and experiments are due to a concentration dependence of the friction coefficient of correlation blobs. Free volume theoriesFujita (1991) and obstruction modelsMackie, Meares, and Rideal (1955) do not account for this dependence. The friction coefficient of correlation blobs and dilute chains of equivalent length are shown to be nearly identical, in agreement with scaling.Dobrynin, Colby, and Rubinstein (1995) The Rouse model gives a quantitative description of non-entangled polyelectrolyte dynamics, as evidenced by the fact that can be used to calculate chain dimensions in agreement with SANS measurements.
Overall, scaling gives a good description of non-entangled polyelectrolyte dynamics. One exception is the exponent for the molar mass dependence of the specific viscosity in salt-free solution, which deviates from theoretical predictions.Lopez and Richtering (2018) Further, a molecular understanding of the concentration dependence of the friction coefficient is also still lacking.
Acknowledgements
We thank Jack Douglas (NIST, US) for useful comments on the manuscript.
VII References
References
- Horkay, Tasaki, and Basser (2000) F. Horkay, I. Tasaki, and P. J. Basser, “Osmotic swelling of polyacrylate hydrogels in physiological salt solutions,” Biomacromolecules 1, 84–90 (2000).
- Schw rer et al. (2018) F. Schw rer, M. Trapp, X. Xu, O. Soltwedel, J. Dzubiella, R. Steitz, and R. Dahint, “Drastic swelling of lipid oligobilayers by polyelectrolytes: A potential molecular model for the internal structure of lubricating films in mammalian joints,” Langmuir 34, 1287–1299 (2018).
- Ballauff (2018) M. Ballauff, “More friction for polyelectrolyte brushes,” Science 360, 1399–1400 (2018).
- Yethiraj (2009) A. Yethiraj, “Liquid state theory of polyelectrolyte solutions,” The Journal of Physical Chemistry B 113, 1539–1551 (2009).
- Chang, Kim, and Yethiraj (2015) R. Chang, Y. Kim, and A. Yethiraj, “Osmotic pressure of polyelectrolyte solutions with salt: Grand canonical monte carlo simulation studies,” Macromolecules 48, 7370–7377 (2015).
- Muthukumar (2017) M. Muthukumar, “50th anniversary perspective: A perspective on polyelectrolyte solutions,” Macromolecules 50, 9528–9560 (2017).
- Dobrynin and Rubinstein (2005) A. V. Dobrynin and M. Rubinstein, “Theory of polyelectrolytes in solutions and at surfaces,” Progress in Polymer Science 30, 1049–1118 (2005).
- Dedic, Okur, and Roke (2019) J. Dedic, H. Okur, and S. Roke, “Polyelectrolytes induce water-water correlations that result in dramatic viscosity changes and nuclear quantum effects,” Science Advances 5, eaay1443 (2019).
- Chremos and Douglas (2018a) A. Chremos and J. F. Douglas, “Polyelectrolyte association and solvation,” The Journal of chemical physics 149, 163305 (2018a).
- (10) A. Chremos and F. Horkay, “Comparison of neutral and charged polyelectrolyte bottlebrush polymers in dilute salt-free conditions,” MRS Advances , 1–8.
- Morishima et al. (2018) K. Morishima, X. Li, K. Oshima, Y. Mitsukami, and M. Shibayama, “Small-angle scattering study of tetra-poly (acrylic acid) gels,” The Journal of chemical physics 149, 163301 (2018).
- Jia and Muthukumar (2019) D. Jia and M. Muthukumar, “Effect of salt on the ordinary- extraordinary transition in solutions of charged macromolecules,” Journal of the American Chemical Society 141, 5886–5896 (2019).
- Muthukumar (2019) M. Muthukumar, “Collective dynamics of semidilute polyelectrolyte solutions with salt,” Journal of Polymer Science Part B: Polymer Physics 57, 1263–1269 (2019), https://onlinelibrary.wiley.com/doi/pdf/10.1002/polb.24839 .
- Chen, Perazzo, and Stone (2020) G. Chen, A. Perazzo, and H. Stone, “Influence of salt on the viscosity of polyelectrolyte solutions,” PRL (2020).
- Barrat and Joanny (1996) J. Barrat and J. Joanny, “Theory of polyelectrolyte solutions,” Advances in chemical physics 94, 1–66 (1996).
- De Gennes, P.G. et al. (1976) De Gennes, P.G., Pincus, P., Velasco, R.M., and Brochard, F., “Remarks on polyelectrolyte conformation,” J. Phys. France 37, 1461–1473 (1976).
- Pfeuty (1978) P. Pfeuty, “Conformation des polyelectrolytes ordre dans les solutions de polyelectrolytes,” Le Journal de Physique Colloques 39, C2–149 (1978).
- Noda and Takahashi (1996) I. Noda and Y. Takahashi, “Viscoelastic properties of polyelectrolyte solutions,” Berichte der Bunsengesellschaft für physikalische Chemie 100, 696–702 (1996).
- Dobrynin, Colby, and Rubinstein (1995) A. V. Dobrynin, R. H. Colby, and M. Rubinstein, “Scaling theory of polyelectrolyte solutions,” Macromolecules 28, 1859–1871 (1995).
- Liao et al. (2007) Q. Liao, J.-M. Y. Carrillo, A. V. Dobrynin, and M. Rubinstein, “Rouse dynamics of polyelectrolyte solutions: A molecular dynamics study,” Macromolecules 40, 7671–7679 (2007).
- Carrillo and Dobrynin (2011) J.-M. Y. Carrillo and A. V. Dobrynin, “Polyelectrolytes in salt solutions: molecular dynamics simulations,” Macromolecules 44, 5798–5816 (2011).
- Lopez and Richtering (2018) C. G. Lopez and W. Richtering, “Conformation and dynamics of flexible polyelectrolytes in semidilute salt-free solutions,” The Journal of Chemical Physics 148, 244902 (2018).
- Boris and Colby (1998) D. C. Boris and R. H. Colby, “Rheology of sulfonated polystyrene solutions,” Macromolecules 31, 5746–5755 (1998).
- Di Cola et al. (2004) E. Di Cola, N. Plucktaveesak, T. A. Waigh, R. H. Colby, J. S. Tan, W. Pyckhout-Hintzen, and R. K. Heenan, “Structure and dynamics in aqueous solutions of amphiphilic sodium maleate-containing alternating copolymers,” Macromolecules 37, 8457–8465 (2004).
- Lopez and Richtering (2019) C. G. Lopez and W. Richtering, “The viscosity of semidilute and concentrated non-entangled flexible polyelectrolytes in salt-free solution,” The Journal of Physical Chemistry B 123, 5626–5634 (2019).
- Lopez (2019a) C. G. Lopez, “Scaling and entanglement properties of neutral and sulfonated polystyrene,” Macromolecules 52, 9409–9415 (2019a).
- Lopez (2019b) C. G. Lopez, “Entanglement properties of polyelectrolytes in salt-free and excess-salt solutions,” ACS Macro Letters , 979–983 (2019b).
- Stevens and Kremer (1995) M. J. Stevens and K. Kremer, “The nature of flexible linear polyelectrolytes in salt free solution: A molecular dynamics study,” J. Chem. Phys. 103, 1669–1690 (1995).
- Lopez et al. (2016) C. G. Lopez, R. H. Colby, P. Graham, and J. T. Cabral, “Viscosity and scaling of semiflexible polyelectrolyte NaCMC in aqueous salt solutions,” Macromolecules 50, 332–338 (2016).
- Mintis and Mavrantzas (2019) D. G. Mintis and V. G. Mavrantzas, “Effect of ph and molecular length on the structure and dynamics of short poly (acrylic acid) in dilute solution: Detailed molecular dynamics study,” The Journal of Physical Chemistry B 123, 4204–4219 (2019).
- Mintis et al. (2019) D. G. Mintis, M. Dompé, M. Kamperman, and V. G. Mavrantzas, “Effect of polymer concentration on the structure and dynamics of short poly (n, n-dimethylaminoethyl methacrylate) in aqueous solution: A combined experimental and molecular dynamics study,” The Journal of Physical Chemistry B 124, 240–252 (2019).
- Soysa, Dünweg, and Prakash (2015) W. C. Soysa, B. Dünweg, and J. R. Prakash, “Size, shape, and diffusivity of a single Debye-Hückel polyelectrolyte chain in solution,” The Journal of chemical physics 143, 064906 (2015).
- Mantha and Yethiraj (2015) S. Mantha and A. Yethiraj, “Conformational properties of sodium polystyrenesulfonate in water: Insights from a coarse-grained model with explicit solvent,” The Journal of Physical Chemistry B 119, 11010–11018 (2015).
- Xu et al. (2016) G. Xu, S. Luo, Q. Yang, J. Yang, and J. Zhao, “Single chains of strong polyelectrolytes in aqueous solutions at extreme dilution: Conformation and counterion distribution,” The Journal of chemical physics 145, 144903 (2016).
- Gupta and Natarajan (2019) A. K. Gupta and U. Natarajan, “Structure and dynamics of atactic na+-poly (acrylic) acid (paa) polyelectrolyte in aqueous solution in dilute, semi-dilute and concentrated regimes,” Molecular Simulation 45, 876–895 (2019).
- Dou and Colby (2006) S. Dou and R. H. Colby, “Charge density effects in salt-free polyelectrolyte solution rheology,” J. Polym. Sci., Part B: Polym. Phys. 44, 2001–2013 (2006).
- Vagias et al. (2013) A. Vagias, R. Raccis, K. Koynov, U. Jonas, H.-J. Butt, G. Fytas, P. Košovan, O. Lenz, and C. Holm, “Complex tracer diffusion dynamics in polymer solutions,” Physical review letters 111, 088301 (2013).
- Seiffert and Oppermann (2008) S. Seiffert and W. Oppermann, “Diffusion of linear macromolecules and spherical particles in semidilute polymer solutions and polymer networks,” Polymer 49, 4115–4126 (2008).
- Serhatli et al. (2002) E. Serhatli, M. Serhatli, B. M. Baysal, and F. E. Karasz, “Coil–globule transition studies of sodium poly (styrene sulfonate) by dynamic light scattering,” Polymer 43, 5439–5445 (2002).
- Yashiro and Norisuye (2002) J. Yashiro and T. Norisuye, “Excluded-volume effects on the chain dimensions and transport coefficients of sodium poly (styrene sulfonate) in aqueous sodium chloride,” Journal of Polymer Science Part B: Polymer Physics 40, 2728–2735 (2002).
- Sedlák (2017) M. Sedlák, “Poly (alkylacrylic acid) s: solution behavior and self-assembly,” Colloid and Polymer Science 295, 1281–1292 (2017).
- Böhme and Scheler (2007a) U. Böhme and U. Scheler, “Effective charge of polyelectrolytes as a function of the dielectric constant of a solution,” Journal of colloid and interface science 309, 231–235 (2007a).
- Scheler (2009) U. Scheler, “Nmr on polyelectrolytes,” Current opinion in colloid & interface science 14, 212–215 (2009).
- Böhme and Scheler (2007b) U. Böhme and U. Scheler, “Hydrodynamic size and electrophoretic mobility of poly (styrene sulfonate) versus molecular weight,” Macromolecular Chemistry and Physics 208, 2254–2257 (2007b).
- Cao, Wu, and Zhang (2015) Z. Cao, S. Wu, and G. Zhang, “Dynamics of single polyelectrolyte chains in salt-free dilute solutions investigated by analytical ultracentrifugation,” Phys. Chem. Chem. Phys. 17, 15896–15902 (2015).
- Wandrey and Ahmadloo (2016) C. Wandrey and H. Ahmadloo, “Hydrodynamic analysis of synthetic permanently charged polyelectrolytes,” in Analytical Ultracentrifugation (Springer, 2016) pp. 251–268.
- Wang, Ye, and Zhang (2015) X. Wang, X. Ye, and G. Zhang, “Investigation of ph-induced conformational change and hydration of poly (methacrylic acid) by analytical ultracentrifugation,” Soft Matter 11, 5381–5388 (2015).
- Filippov et al. (2013) S. K. Filippov, T. A. Seery, J. Kříž, M. Hruby, P. Černoch, O. Sedláček, P. Kadlec, J. Pánek, and P. Štěpánek, “Collective polyelectrolyte diffusion as a function of counterion size and dielectric constant,” Polymer international 62, 1271–1276 (2013).
- Oostwal and Odijk (1993) M. Oostwal and T. Odijk, “Novel dynamic scaling hypothesis for semidilute and concentrated solutions of polymers and polyelectrolytes,” Macromolecules 26, 6489–6497 (1993).
- Oostwal et al. (1993) M. Oostwal, M. Blees, J. De Bleijser, and J. Leyte, “Chain self-diffusion in aqueous salt-free solutions of sodium poly (styrenesulfonate),” Macromolecules 26, 7300–7308 (1993).
- Schipper, Kassapidou, and Leyte (1996) F. Schipper, K. Kassapidou, and J. Leyte, “Polyelectrolyte effects on counterion self-diffusion,” Journal of Physics: Condensed Matter 8, 9301 (1996).
- Schipper, Hollander, and Leyte (1998) F. Schipper, J. Hollander, and J. Leyte, “The influence of screening of the polyion electrostatic potential on the counterion dynamics in polyelectrolyte solutions,” Journal of Physics: Condensed Matter 10, 9207 (1998).
- Schneider and Rivin (2006) N. Schneider and D. Rivin, “Solvent transport in hydrocarbon and perfluorocarbon ionomers,” Polymer 47, 3119–3131 (2006).
- Senanayake et al. (2019) K. K. Senanayake, N. Shokeen, E. A. Fakhrabadi, M. W. Liberatore, and A. Mukhopadhyay, “Diffusion of nanoparticles within a semidilute polyelectrolyte solution,” Soft matter 15, 7616–7622 (2019).
- Guo et al. (2019a) X. Guo, S. Theissen, J. Claussen, V. Hildebrand, J. Kamphus, M. Wilhelm, B. Luy, and G. Guthausen, “Dynamics of sodium ions and water in swollen superabsorbent hydrogels as studied by 23na-and 1h-nmr,” Macromolecular Chemistry and Physics 220, 1800350 (2019a).
- Guo et al. (2019b) X. Guo, C. Pfeifer, M. Wilhelm, B. Luy, and G. Guthausen, “Structure of superabsorbent polyacrylate hydrogels and dynamics of counterions by nuclear magnetic resonance,” Macromolecular Chemistry and Physics 220, 1800525 (2019b).
- Sozanski et al. (2016) K. Sozanski, A. Wisniewska, T. Kalwarczyk, A. Sznajder, and R. Holyst, “Motion of molecular probes and viscosity scaling in polyelectrolyte solutions at physiological ionic strength,” PloS one 11 (2016).
- LaFemina et al. (2016) N. H. LaFemina, Q. Chen, R. H. Colby, and K. T. Mueller, “The diffusion and conduction of lithium in poly (ethylene oxide)-based sulfonate ionomers,” The Journal of Chemical Physics 145, 114903 (2016).
- Bai et al. (2014) R. Bai, P. J. Basser, R. M. Briber, and F. Horkay, “Nmr water self-diffusion and relaxation studies on sodium polyacrylate solutions and gels in physiologic ionic solutions,” Journal of applied polymer science 131 (2014).
- Dou and Colby (2008) S. Dou and R. H. Colby, “Solution rheology of a strongly charged polyelectrolyte in good solvent,” Macromolecules 41, 6505–6510 (2008).
- Zheng et al. (2018) K. Zheng, K. Chen, W. Ren, J. Yang, and J. Zhao, “Counterion cloud expansion of a polyelectrolyte by dilution,” Macromolecules 51, 4444–4450 (2018).
- Dakhil, Auhl, and Wierschem (2019) H. Dakhil, D. Auhl, and A. Wierschem, “Infinite-shear viscosity plateau of salt-free aqueous xanthan solutions,” Journal of Rheology 63, 63–69 (2019).
- Fouissac, Milas, and Rinaudo (1993) E. Fouissac, M. Milas, and M. Rinaudo, “Shear-rate, concentration, molecular weight, and temperature viscosity dependences of hyaluronate, a wormlike polyelectrolyte,” Macromolecules 26, 6945–6951 (1993).
- Izzo, Cloitre, and Leibler (2014) D. Izzo, M. Cloitre, and L. Leibler, “The viscosity of short polyelectrolyte solutions,” Soft Matter 10, 1714–1722 (2014).
- Bravo-Anaya, Rinaudo, and Mart nez (2016) L. Bravo-Anaya, M. Rinaudo, and F. Mart nez, “Conformation and rheological properties of calf-thymus dna in solution,” Polymers 8, 51 (2016).
- Chen et al. (2019a) T. Chen, X. Fu, L. Zhang, and Y. Zhang, “Viscosity behavior of p(dac-am) with serial cationicity and intrinsic viscosity in inorganic salt solutions,” Polymers 11, 1944 (2019a).
- Chen et al. (2020) T. Chen, X. Fu, S. Ning, and Y. Zhang, “The apparent viscosity of poly(acryloyloxyethyltrimethyl ammonium chloride-acrylamide) with serial molecular weights in the aqueous salt solutions,” Journal of Macromolecular Science, Part A 57, 217–221 (2020).
- Konop and Colby (1999) A. J. Konop and R. H. Colby, “Polyelectrolyte charge effects on solution viscosity of poly (acrylic acid),” Macromolecules 32, 2803–2805 (1999).
- Waigh et al. (2001) T. A. Waigh, R. Ober, C. E. Williams, and J.-C. Galin, “Semidilute and concentrated solutions of a solvophobic polyelectrolyte in nonaqueous solvents,” Macromolecules 34, 1973–1980 (2001).
- Jimenez et al. (2018) L. N. Jimenez, J. Dinic, N. Parsi, and V. Sharma, “Extensional relaxation time, pinch-off dynamics, and printability of semidilute polyelectrolyte solutions,” Macromolecules 51, 5191–5208 (2018).
- Rozanska et al. (2019) S. Rozanska, K. Verbeke, J. Rozanski, C. Clasen, and P. Wagner, “Capillary breakup extensional rheometry of sodium carboxymethylcellulose solutions in water and propylene glycol/water mixtures,” Journal of Polymer Science Part B: Polymer Physics 57, 1537–1547 (2019).
- De and Das (2020) R. De and B. Das, “Concentration, medium and salinity-induced shrinkage/expansion of poly(sodium styrenesulfonate) in 2-ethoxyethanol-water mixed solvent media as probed by viscosimetry,” Journal of Molecular Structure 1199, 126992 (2020).
- Di Cola, Waigh, and Colby (2007) E. Di Cola, T. A. Waigh, and R. H. Colby, “Dynamic light scattering and rheology studies of aqueous solutions of amphiphilic sodium maleate containing copolymers,” Journal of Polymer Science Part B: Polymer Physics 45, 774–785 (2007).
- Turkoz et al. (2018) E. Turkoz, A. Perazzo, C. B. Arnold, and H. A. Stone, “Salt type and concentration affect the viscoelasticity of polyelectrolyte solutions,” Applied Physics Letters 112, 203701 (2018).
- Bercea and Wolf (2018) M. Bercea and B. A. Wolf, “Intrinsic viscosities of polymer blends: Sensitive probes of specific interactions between the counterions of polyelectrolytes and uncharged macromolecules,” Macromolecules 51, 7483–7490 (2018).
- Bercea and Wolf (2019) M. Bercea and B. A. Wolf, “Associative behaviour of κ-carrageenan in aqueous solutions and its modification by different monovalent salts as reflected by viscometric parameters,” International Journal of Biological Macromolecules 140, 661 – 667 (2019).
- Pavlov et al. (2018) G. M. Pavlov, O. A. Dommes, O. V. Okatova, I. I. Gavrilova, and E. F. Panarin, “Spectrum of hydrodynamic volumes and sizes of macromolecules of linear polyelectrolytes versus their charge density in salt-free aqueous solutions,” Phys. Chem. Chem. Phys. 20, 9975–9983 (2018).
- Jimenez, Martínez Narváez, and Sharma (2020) L. N. Jimenez, C. D. V. Martínez Narváez, and V. Sharma, “Capillary breakup and extensional rheology response of food thickener cellulose gum (nacmc) in salt-free and excess salt solutions,” Physics of Fluids 32, 012113 (2020).
- Fuoss (1948) R. M. Fuoss, “Viscosity function for polyelectrolytes,” Journal of Polymer Science 3, 603–604 (1948).
- Fuoss and Strauss (1949) R. M. Fuoss and U. P. Strauss, “The viscosity of mixtures of polyelectrolytes and simple electrolytes,” Annals of the New York Academy of Sciences 51, 836–851 (1949).
- Colby (2010) R. H. Colby, “Structure and linear viscoelasticity of flexible polymer solutions: comparison of polyelectrolyte and neutral polymer solutions,” Rheol. Acta 49, 425–442 (2010).
- Yamaguchi et al. (1992) M. Yamaguchi, M. Wakutsu, Y. Takahashi, and I. Noda, “Viscoelastic properties of polyelectrolyte solutions. 1. zero-shear viscosity,” Macromolecules 25, 470–474 (1992).
- Behra et al. (2019) J. S. Behra, J. Mattsson, O. J. Cayre, E. S. Robles, H. Tang, and T. N. Hunter, “Characterization of sodium carboxymethyl cellulose aqueous solutions to support complex product formulation: A rheology and light scattering study,” ACS Applied Polymer Materials 1, 344–358 (2019).
- Del Giudice et al. (2017) F. Del Giudice, V. Calcagno, V. Esposito Taliento, F. Greco, P. A. Netti, and P. L. Maffettone, “Relaxation time of polyelectrolyte solutions: When -rheometry steps in charge,” Journal of Rheology 61, 13–21 (2017).
- Kujawa et al. (2006) P. Kujawa, A. Audibert-Hayet, J. Selb, and F. Candau, “Effect of ionic strength on the rheological properties of multisticker associative polyelectrolytes,” Macromolecules 39, 384–392 (2006).
- Gong et al. (2001) X. Gong, A. Bandis, A. Tao, G. Meresi, Y. Wang, P. Inglefield, A. Jones, and W.-Y. Wen, “Self-diffusion of water, ethanol and decafluropentane in perfluorosulfonate ionomer by pulse field gradient nmr,” Polymer 42, 6485–6492 (2001).
- Cicerone and Douglas (2012) M. T. Cicerone and J. F. Douglas, “β-relaxation governs protein stability in sugar-glass matrices,” Soft Matter 8, 2983–2991 (2012).
- Andreev et al. (2017) M. Andreev, A. Chremos, J. de Pablo, and J. F. Douglas, “Coarse-grained model of the dynamics of electrolyte solutions,” The Journal of Physical Chemistry B 121, 8195–8202 (2017).
- Andreev et al. (2018) M. Andreev, J. J. de Pablo, A. Chremos, and J. F. Douglas, “Influence of ion solvation on the properties of electrolyte solutions,” The Journal of Physical Chemistry B 122, 4029–4034 (2018).
- Psurek et al. (2008) T. Psurek, C. L. Soles, K. A. Page, M. T. Cicerone, and J. F. Douglas, “Quantifying changes in the high-frequency dynamics of mixtures by dielectric spectroscopy,” The Journal of Physical Chemistry B 112, 15980–15990 (2008).
- Bhadauriya et al. (2018) S. Bhadauriya, X. Wang, P. Pitliya, J. Zhang, D. Raghavan, M. R. Bockstaller, C. M. Stafford, J. F. Douglas, and A. Karim, “Tuning the relaxation of nanopatterned polymer films with polymer-grafted nanoparticles: Observation of entropy–enthalpy compensation,” Nano Letters 18, 7441–7447 (2018).
- Belloni, Borgis, and Levesque (2018) L. Belloni, D. Borgis, and M. Levesque, “Screened coulombic orientational correlations in dilute aqueous electrolytes,” The Journal of Physical Chemistry Letters 9, 1985–1989 (2018).
- Jungwirth and Laage (2018) P. Jungwirth and D. Laage, “Ion-induced long-range orientational correlations in water: Strong or weak, physiologically relevant or unimportant, and unique to water or not?” The Journal of Physical Chemistry Letters 9, 2056–2057 (2018).
- Chen et al. (2018) Y. Chen, N. Dupertuis, H. I. Okur, and S. Roke, “Temperature dependence of water-water and ion-water correlations in bulk water and electrolyte solutions probed by femtosecond elastic second harmonic scattering,” The Journal of Chemical Physics 148, 222835 (2018).
- Mackie, Meares, and Rideal (1955) J. S. Mackie, P. Meares, and E. K. Rideal, “The diffusion of electrolytes in a cation-exchange resin membrane i. theoretical,” Proceedings of the Royal Society of London. Series A. Mathematical and Physical Sciences 232, 498–509 (1955).
- Fujita (1991) H. Fujita, “Notes on free volume theories,” Polymer Journal 23, 1499–1506 (1991).
- Colby et al. (1991) R. H. Colby, L. J. Fetters, W. G. Funk, and W. W. Graessley, “Effects of concentration and thermodynamic interaction on the viscoelastic properties of polymer solutions,” Macromolecules 24, 3873–3882 (1991).
- Tarokh, Karan, and Ponnurangam (2019) A. Tarokh, K. Karan, and S. Ponnurangam, “Atomistic md study of nafion dispersions: Role of solvent and counterion in the aggregate structure, ionic clustering, and acid dissociation,” Macromolecules (2019).
- Sedlak (1996) M. Sedlak, “The ionic strength dependence of the structure and dynamics of polyelectrolyte solutions as seen by light scattering: The slow mode dilemma,” J. Chem. Phys. 105, 10123–10133 (1996).
- Sedlák (1999) M. Sedlák, “What can be seen by static and dynamic light scattering in polyelectrolyte solutions and mixtures?” Langmuir 15, 4045–4051 (1999).
- Sedlák and Amis (1992) M. Sedlák and E. J. Amis, “Concentration and molecular weight regime diagram of salt-free polyelectrolyte solutions as studied by light scattering,” The Journal of chemical physics 96, 826–834 (1992).
- Chremos and Douglas (2018b) A. Chremos and J. F. Douglas, “Competitive solvation effects in polyelectrolyte solutions,” in Gels and Other Soft Amorphous Solids (ACS Publications, 2018) pp. 15–32.
- Narayanan Krishnamoorthy, Holm, and Smiatek (2018) A. Narayanan Krishnamoorthy, C. Holm, and J. Smiatek, “Specific ion effects for polyelectrolytes in aqueous and non-aqueous media: the importance of the ion solvation behavior,” Soft Matter 14, 6243–6255 (2018).
- Not (a) “The samples studied have a sufficiently high degree of polymerisation that the end-to-end distance of the chains is large than the electrostatic blob size of NaPSS 128; 145,” (a).
- Guo et al. (2017) X. Guo, E. Laryea, M. Wilhelm, B. Luy, H. Nirschl, and G. Guthausen, “Diffusion in polymer solutions: Molecular weight distribution by pfg-nmr and relation to sec,” Macromolecular Chemistry and Physics 218, 1600440 (2017).
- Williamson et al. (2017) N. H. Williamson, M. Röding, S. J. Miklavcic, and M. Nydén, “Scaling exponent and dispersity of polymers in solution by diffusion nmr,” Journal of colloid and interface science 493, 393–397 (2017).
- Stejskal and Tanner (1965) E. O. Stejskal and J. E. Tanner, “Spin diffusion measurements: Spin echoes in the presence of a time‐dependent field gradient,” The Journal of Chemical Physics 42, 288–292 (1965).
- Linders et al. (2012) J. Linders, C. Mayer, T. Sekine, and H. Hoffmann, “Pulsed-field gradient nmr measurements on hydrogels from phosphocholine,” The Journal of Physical Chemistry B 116, 11459–11465 (2012).
- Stejskal (1965) E. O. Stejskal, “Use of spin echoes in a pulsed magnetic‐field gradient to study anisotropic, restricted diffusion and flow,” The Journal of Chemical Physics 43, 3597–3603 (1965).
- Tanner and Stejskal (1968) J. E. Tanner and E. O. Stejskal, “Restricted self‐diffusion of protons in colloidal systems by the pulsed‐gradient, spin‐echo method,” The Journal of Chemical Physics 49, 1768–1777 (1968).
- Prabhu et al. (2003) V. Prabhu, M. Muthukumar, G. D. Wignall, and Y. B. Melnichenko, “Polyelectrolyte chain dimensions and concentration fluctuations near phase boundaries,” The Journal of chemical physics 119, 4085–4098 (2003).
- Kassapidou et al. (1997) K. Kassapidou, W. Jesse, M. Kuil, A. Lapp, S. Egelhaaf, and J. Van der Maarel, “Structure and charge distribution in dna and poly (styrenesulfonate) aqueous solutions,” Macromolecules 30, 2671–2684 (1997).
- Tirado and de la Torre (1979) M. M. Tirado and J. G. de la Torre, “Translational friction coefficients of rigid, symmetric top macromolecules. application to circular cylinders,” The Journal of chemical physics 71, 2581–2587 (1979).
- Colby et al. (1997) R. H. Colby, D. C. Boris, W. E. Krause, and J. S. Tan, “Polyelectrolyte conductivity,” J. Polym. Sci., Part B: Polym. Phys. 35, 2951–2960 (1997).
- Bordi, Cametti, and Colby (2004) F. Bordi, C. Cametti, and R. H. Colby, “Dielectric spectroscopy and conductivity of polyelectrolyte solutions,” J. Phys.: Condens. Matter 16, R1423 (2004).
- De and Das (2007) R. De and B. Das, “The effects of concentration, relative permittivity, and temperature on the transport properties of sodium polystyrenesulphonate in 2-ethoxyethanol–water mixed solvent media,” European polymer journal 43, 3400–3407 (2007).
- Ray, De, and Das (2016) D. Ray, R. De, and B. Das, “Thermodynamic, transport and frictional properties in semidilute aqueous sodium carboxymethylcellulose solution,” The Journal of Chemical Thermodynamics 101, 227–235 (2016).
- Xu, Yang, and Zhao (2018) G. Xu, J. Yang, and J. Zhao, “Molecular weight dependence of chain conformation of strong polyelectrolytes,” The Journal of chemical physics 149, 163329 (2018).
- Chen et al. (2019b) K. Chen, K. Zheng, G. Xu, J. Yang, and J. Zhao, “Diffusive motion of single polyelectrolyte molecules under electrostatic repulsion,” Macromolecules 52, 3925–3934 (2019b).
- Quezada et al. (2020) G. R. Quezada, J. H. Saavedra, R. E. Rozas, and P. G. Toledo, “Molecular dynamics simulations of the conformation and diffusion of partially hydrolyzed polyacrylamide in highly saline solutions,” Chemical Engineering Science 214, 115366 (2020).
- Sappidi, Muralidharan, and Natarajan (2014) P. Sappidi, S. S. Muralidharan, and U. Natarajan, “Conformations and hydration structure of hydrophobic polyelectrolyte atactic poly (ethacrylic acid) in dilute aqueous solution as a function of neutralisation,” Molecular Simulation 40, 295–305 (2014).
- Kubincova, Hunenberger, and Krishnan (2020) A. Kubincova, P. H. Hunenberger, and M. Krishnan, “Interfacial solvation can explain attraction between like-charged objects in aqueous solution,” The Journal of Chemical Physics 152, 104713 (2020).
- Schlaich, dos Santos, and Netz (2019) A. Schlaich, A. P. dos Santos, and R. R. Netz, “Simulations of nanoseparated charged surfaces reveal charge-induced water reorientation and nonadditivity of hydration and mean-field electrostatic repulsion,” Langmuir 35, 551–560 (2019).
- Sturm et al. (2019) D. R. Sturm, R. P. Danner, J. D. Moser, and S.-W. Chiu, “Application of the vrentas–duda free-volume theory of diffusion below the glass-transition temperature: Application to hypromellose acetate succinate–solvent systems,” Journal of Applied Polymer Science 136, 47351 (2019).
- Schneider and Rivin (2010) N. Schneider and D. Rivin, “Steady state analysis of water vapor transport in ionomers,” Polymer 51, 671–678 (2010).
- Fernandez-Prini and Philipp (1976) R. Fernandez-Prini and M. Philipp, “Tracer diffusion coefficients of counterions in homo-and heteroionic poly (styrenesulfonate) resins,” The Journal of Physical Chemistry 80, 2041–2046 (1976).
- Prini and Lagos (1964) R. F. Prini and A. Lagos, “Tracer diffusion, electrical conductivity, and viscosity of aqueous solutions of polystyrenesulfonates,” Journal of Polymer Science Part A: Polymer Chemistry 2, 2917–2928 (1964).
- Zhang and van der Vegt (2016) R. Zhang and N. F. van der Vegt, “Study of hydrophobic clustering in partially sulfonated polystyrene solutions with a systematic coarse-grained model,” Macromolecules 49, 7571–7580 (2016).
- Bordi et al. (2002) F. Bordi, R. H. Colby, C. Cametti, L. De Lorenzo, and T. Gili, “Electrical conductivity of polyelectrolyte solutions in the semidilute and concentrated regime: the role of counterion condensation,” The Journal of Physical Chemistry B 106, 6887–6893 (2002).
- Liu, Chen, and Chen (2017) L. Liu, W. Chen, and J. Chen, “Shape and diffusion of circular polyelectrolytes in salt-free dilute solutions and comparison with linear polyelectrolytes,” Macromolecules 50, 6659–6667 (2017).
- Jacinto-Méndez et al. (2018) D. Jacinto-Méndez, M. Villada-Balbuena, S. G. Cruz y Cruz, and M. D. Carbajal-Tinoco, “Static structure of sodium polystyrene sulfonate solutions obtained through a coarse-grained model,” Molecular Physics 116, 2244–2253 (2018).
- Matsumoto et al. (2019) A. Matsumoto, F. Del Giudice, R. Rotrattanadumrong, and A. Q. Shen, “Rheological scaling of ionic-liquid-based polyelectrolytes in ionic liquid solutions,” Macromolecules 52, 2759–2771 (2019).
- Wang and Bloomfield (1990) L. Wang and V. A. Bloomfield, “Osmotic pressure of polyelectrolytes without added salt,” Macromolecules 23, 804–809 (1990), http://pubs.acs.org/doi/pdf/10.1021/ma00205a018 .
- Ullner, Qamhieh, and Cabane (2018) M. Ullner, K. Qamhieh, and B. Cabane, “Osmotic pressure in polyelectrolyte solutions: cell-model and bulk simulations,” Soft matter 14, 5832–5846 (2018).
- Nishida, Kaji, and Kanaya (2001) K. Nishida, K. Kaji, and T. Kanaya, “High concentration crossovers of polyelectrolyte solutions,” J. Chem. Phys. 114, 8671–8677 (2001).
- Lorchat et al. (2014) P. Lorchat, I. Konko, J. Combet, J. Jestin, A. Johner, A. Laschewski, S. Obukhov, and M. Rawiso, “New regime in polyelectrolyte solutions,” EPL (Europhysics Letters) 106, 28003 (2014).
- Schipper and Leyte (1999) F. J. M. Schipper and J. Leyte, “Mass transport in polyelectrolyte solutions,” Journal of Physics: Condensed Matter 11, 1409 (1999).
- Not (b) “We assume their NaPMA is non -entangled given its low degree of polymerisation .” (b).
- Diederichsen, Terrell, and McCloskey (2019) K. M. Diederichsen, R. C. Terrell, and B. D. McCloskey, “Counterion transport and transference number in aqueous and nonaqueous short-chain polyelectrolyte solutions,” The Journal of Physical Chemistry B 123, 10858–10867 (2019).
- Diederichsen (2019) K. M. Diederichsen, High Transference Number Polymer-Based Electrolytes for Lithium Batteries, Ph.D. thesis, UC Berkeley (2019).
- Note (1) If is measured from the initial slope of the PFG-NMR signal (i.e. ), then for semidilute non-entangled solutions.
- Nemoto et al. (1991) N. Nemoto, M. Kishine, T. Inoue, and K. Osaki, “Self-diffusion and viscoelasticity of linear polystyrene in entangled solutions,” Macromolecules 24, 1648–1654 (1991).
- Nemoto et al. (1989) N. Nemoto, T. Kojima, T. Inoue, M. Kishine, and T. Hirayama, “Self-diffusion and tracer-diffusion coefficient and viscosity of concentrated solutions of linear polystyrenes in dibutyl phthalate,” Macromolecules 22, 3793–3798 (1989).
- Note (2) We have multiplied all diffusion coefficients by a factor of 1.2 to account for the fact that the viscosity of D2O is 20% larger than that of H2O at K.
- Carrillo and Dobrynin (2010) J.-M. Y. Carrillo and A. V. Dobrynin, “Detailed molecular dynamics simulations of a model napss in water,” The Journal of Physical Chemistry B 114, 9391–9399 (2010).