A Pilot Study of Catching High- GRBs and Exploring Circumburst Environment in the Forthcoming SVOM Era
Abstract
Rapid spectroscopy of GRB afterglows is an important and hard task. Based on the archival XS-GRB spectral database, we here perform a pilot study on the afterglow’s spectroscopy in the forthcoming SVOM era in two aspects. At first, our simulation indicates that the color acquired from the SVOM/VT blue and red channels is effective in discriminating between low- () and distant GRB candidates until . Secondly, by doubling the sample size, we find that the previously proposed global photoionization response of the circumburst gas to the prompt emission (i.e., the CIV/CII- relationship) is roughly confirmed, although the confirmation is dissatisfactory at the large end. We believe that this issue can be further addressed in the SVOM era by larger spectroscopy sample, thanks to its capability of rapid identification of optical candidates of afterglow and its anti-solar pointing strategy.
keywords:
gamma ray bursts: general — techniques: photometric — techniques: spectroscopic — methods: statistical1 Introduction
Long gamma-ray bursts (LGRBs), which are believed to originate from the core-collapse of young massive stars (; e.g., Woosley & Bloom 2006; Hjorth & Bloom 2012 and references therein), are the most powerful explosions occurring in the universe. Because of their extreme high luminosities, GRBs can be detected and studied from local up to high redshifts (e.g., Salvaterra et al. 2009; Tanvir et al. 2009). So far, GRB 090429B with a photometric redshift of (Cucchiara et al. 2011) is the most distant one reported in the literature. Up to date, there are only 9 Swift GRBs at . Other high- () GRBs include GRB 050904, GRB 080913, GRB 090423 and GRB 140515A (e.g., Tagliaferri et al. 2005; Greiner et al. 2009; Tanvir et al. 2009; Melandri et al. 2015).
SVOM is a China-France satellite mission dedicated to the detection and study of GRBs (Wei et al. 2016), which is scheduled to be launched by the beginning of 2022. The on-board payloads of SVOM are able to detect GRBs in soft/hard -rays in near-real time, and to rapidly identify soft X-ray/optical counterparts or candidates in minutes. A on-ground VHF network evenly distributed on Earth under the satellite track is used to receive (refined) GRB’s position and main characteristics in near-real time. This capability combined with its anti-solar pointing strategy allows the GRBs, especially high- ones, detected by SVOM to be follow-up observed in spectroscopy rapidly by ground-based large telescopes.
Rapid follow-up in spectroscopy of GRBs is in fact quite important in 1) discovery of high- GRBs through a redshift measurement; 2) exploring structure and evolution of early universe through a study of reionization and cosmic star formation history; and 3) examining the properties of the progenitors from the response of the circumburst gas to the central engine. In this paper, we perform a pilot study on the spectroscopic follow-up in the SVOM era by focusing on the following two aspects: 1) the capability of rapid identification of optical candidates of high- GRB; and 2) an updated global photoionization response of circumburst gas to GRB prompt emission (Wang et al. 2018) that is believed to be intensively addressed by the SVOM mission.
The paper is organized as follows. Section 2 describes the conception and payloads of the SVOM mission in brief, by focusing on the detection of high- GRBs. The capability of identifying optical candidates of high- GRBs is predicted in Section 3. Section 4 presents a updated global photoionization response of GRB’s local environment to the prompt emission. A summary and perspective is shown in the last section.
2 Profile and Instruments of SVOM
We here briefly describe the profile and instruments of SVOM, and refer the readers to the White Paper given in Wei et al. (2016) for the details of the SVOM mission. The two wide-filed on-board instruments: the soft -ray imager ECLAIRs and the Gamma-Ray Monitor (GRM) are designed to observe GRB prompt emission in 4-150 keV and 15-5000 keV energy bands, respectively. With a field-of-view (FoV) of 2sr and a sensitivity of (5 detection level in 1000 s), a total of 60-70 GRBs per year can be triggered by ECLAIRs, and 4-5% of these GRBs are expected to have a redshift (Godet et al. 2014b; Cordier et al. 2015).
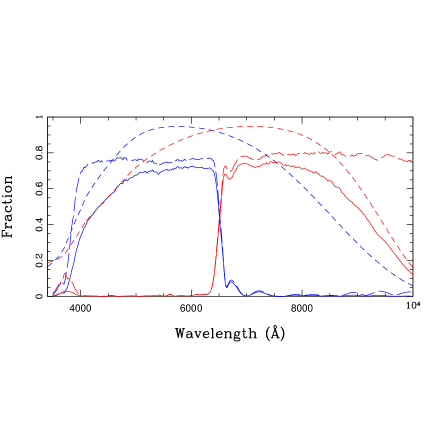
The two on-board narrow-field instruments: the Micro-channel X-ray Telescope (MXT, Gotz et al. 2014) and Visible Telescope (VT) are responsible for follow-up observations of the afterglows in X-ray and optics, respectively. VT is a Ritchey-Chretien telescope with a 44 cm diameter and a -ratio of 9. Its limiting magnitude is down to for a 300s exposure. The FoV of VT is about , covering the ECLAIR’s error box in most cases. With a dichroic beam splitter, a GRB afterglow can be observed by VT in the two channels, one in blue and the another in red, simultaneously. The blue channel has a wavelength range from 0.4 to 0.65m, and the red one from 0.65 to 1.0m. Figure 1 shows the normalized total throughput curves of the two channels, along with the corresponding transmittance of the filters and the quantum efficiency (QE) of the two E2V frame-transfer CCDs. A back-illuminated thick CCD is used for the red channel to enhance the QE. More detailed description on the calibration and determination of the throughput curves can be found in Qiu et al. (in preparation).
3 Capability of Identifying of High- GRB Candidates: Color vs. Redshift
In addition to high- quasars and galaxies (e.g., Fan et al. 2006; Bouwens et al. 2011a,b), the detection and follow-up spectroscopy of high- GRBs is a powerful tool in understanding the structure and evolution of high- universe. On one hand, the short life-time of the massive progenitors makes LGRBs a natural tracer of cosmic star formation history (e.g., Vangioni et al. 2015; Wang et al. 2015; Petitjean et al. 2016), although some studies based on GRBs lead to an over-estimation of star formation rate in the high- universe (e.g., Wang & Dai 2009; Robertson & Ellis 2012; Wang 2013a). On the other hand, the spectroscopy of LGRBs with enables us to explore the reionization by ascertaining not only the faint end slope of the galaxy luminosity function in the era of reionization but also the escape fraction of the ionizing radiation. For instance, based on four LGRBs, Chornock et al. (2014) reported some hints of a low value of escape fraction in early universe.
The color provided by the simultaneous observations in the two channels in principle enables VT to provide a rapid identification of candidates of high- GRBs with a sub-arcsecond position accuracy, which is quite essential for subsequent rapid spectroscopy taken by ground large facilities. We here provide a quantified prediction on how to select high- GRB candidates based on the color.
3.1 The VLT/X-shooter Spectroscopic Sample of GRB Afterglows
We start our simulations with the X-shooter GRB afterglow legacy sample (XS-GRB, Selsing et al. 2019). The sample in total contains spectra of 103 individual Swift GRB afterglows that have been promptly observed with the ESO Very Large Telescope (VLT)/X-shooter cross-dispersed echelle spectrograph (Vernet et al. 2011) within 48 hours after the onset of the GRBs until 2017-03-31. For a majority of the GRBs, the spectroscopy have been obtained by the X-shooter spectrograph by the UVB, VIS, and NIR-arms, which provides a spectral wavelength region from 3000Å to 2.48m. The spectral resolutions are 4350, 7450 and 5300 for the UVB, VIS and NIR-arm, respectively.
Because VT works in the wavelength range from 0.4 to 1.0m, we select a sub-sample of GRBs from the XS-GRB sample by requiring the signal-to-noise ratio (S/N) of single pixel in the VIS arm is larger than 1.0. This selection results in a sub-sample of 66 individual GRBs. The redshift of the sub-sample ranges from 0.156 to 5.91. A spectral dataset with a wavelength range from 3500Å to 1.1m in the observer frame are obtained for the 66 individual GRBs by a combination of the UVB, VIS, and NIR-arms. The combined spectra are then smoothed by a boxcar of 10pixels to enhance the S/N ratio. The telluric A-band (7600-7630Å) and B-band (around 6860Å) features due to molecules are removed from the combined spectra by a linear interpolation.
3.2 Color vs. Redshift
With the pre-determined throughput curves of the two channels of VT, the corresponding two broad-band AB magnitudes ( and for the blue and red channels, respectively) of the afterglow of each of the selected 66 GRBs are calculated according to the definition (Fukugita et al. 1996)
| (1) |
where is the specific flux density of the object in the unit of , and the total throughput at frequency .
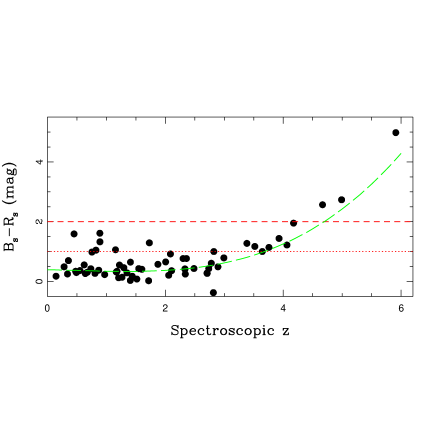
The simulated colors are plotted against the spectroscopic redshifts in Figure 2 for the 66 GRBs. One can learn from the figure that 1) the color is insensitive to redshift for the burst with . This is quite reasonable because the Lyman break at is out of the wavelength coverage of the two channels of VT, and the color is mainly determined by the powerlaw slope of the afterglow; 2) due to the gradually redshifted Lyman break, the color increase from to steeply with when increases from up to . The vs. relationship can be parameterized by a three-order polynomial , where . The best-fit curve is overplotted in Figure 2 by a long-dashed line, and the corresponding values of are listed in Table 1; 3) there are a few of low- outliers with large values (). By examining their spectra one-by-one by eyes, we find that the outliers are all resulted from their red spectra that is most likely due to the heavy local extinction (e.g., Kruhler et al. 2011a; and references therein). Even though it is widely accepted that the dust up to pc away from the central engine within the beaming angle (e.g., Deng et al. 2010) can be completely destroyed by the high energy photons coming from the reverse shock (e.g., Waxman & Draine 2000; Dai et al. 2001; Perna et al. 2003), the observed extinction in the optical afterglow is possibly resulted from the dust outside of the initial beaming angle when the jet expands significantly (Liang et al. 2003).
Given our simulations based on the archival spectral database, we can draw a conclusion that a color of can be adopted as an effective way for selecting high- GRBs candidates with , while a contamination due to local dusty bursts must be taken into account when a bluer demarcation of is adopted for selecting GRB candidates with .
| (1) | (2) | (3) | (4) |
4 An Updated Global Photoionization Response to GRB Prompt Emission
As aforementioned in the first section, ground-based spectroscopic follow-up observations of GRB afterglow can greatly benefit from SVOM both because of its capability of rapid identification of optical candidates and because of its anti-solar pointing strategy. In addition to determine the redshifts, the afterglow spectra of GRBs enable us to study the properties of both medium at GRB local environment and intervening absorption clouds located between the host galaxy and the observer (e.g., Butler et al. 2003; Savaglio et al. 2003; Prochaska et al. 2006, 2007; Kawai et al. 2006; Totani et al. 2006; Thone et al. 2007; Tejos et al. 2007, 2009; Vreeswijk et al. 2007; D’Elia et al. 2009, 2010; Vergani et al. 2009; Wang 2013b; Kruhler et al. 2015). The study of the circumburst environment can also in fact afford us some hint of GRB’s progenitors.
Stemmed from some previous theoretical and observational studies and based on only 14 GRBs, Wang et al. (2018 and references therein) proposed a global photoionization response of the circumburst gas to GRB prompt emission, i.e., a relationship between the line ratio CIV1549/CII1335 and either or . The CIV/CII line ratio traces the ionization ratio of the interstellar medium (ISM) illuminated by a GRB, and () the (specific) photon luminosity of the prompt emission.
In this section, we re-examine the CIV/CII- relation by doubling the size of the previously used sample by supplementing the bursts extracted from the XS-GRB spectroscopy database. After acquiring reported values of both and from the literature, there are in total 14 bursts listed in the XS-GRB sample for subsequent spectral analysis. We start our line profile modeling with a spectral smoothing with a boxcar of 10pixels to enhance S/N ratio, since only equivalent widths (EWs) of the absorption features are needed in our study. We then model each of the CII/CII1335 features by a single Gaussian absorption profile by the SPECFIT (Kriss 1994) in the IRAF package111IRAF is distributed by the National Optical Astronomical Observatories, which are operated by the Association of Universities for Research in Astronomy, Inc., under cooperative agreement with the National Science Foundation.. Each CIV1548, 1550 doublet is reproduced by two Gaussian functions, except for the two cases GRB 120119A and GRB 1501301B, where only a total EW of the CIV1548, 1550 doublet can be obtained. Columns (1) and (2) in Table 2 list the identification and the reported redshift for the 14 GRBs, respectively. The measured EWs of both CII/CII1335 feature and CIV1548, 1550 doublet in the rest-frame are tabulated in Columns (3), (4) and (5) in the table. Columns (6) and (7) are the rest-frame isotropic prompt luminosity () and peak energy () adopted from the literature (Column (8)). All the errors reported in the table correspond to the 1 significance level after taking into account the proper error propagation. For the measured EWs, the uncertainties reported in Table 2 only include the statistical errors resulting from the spectral fitting.
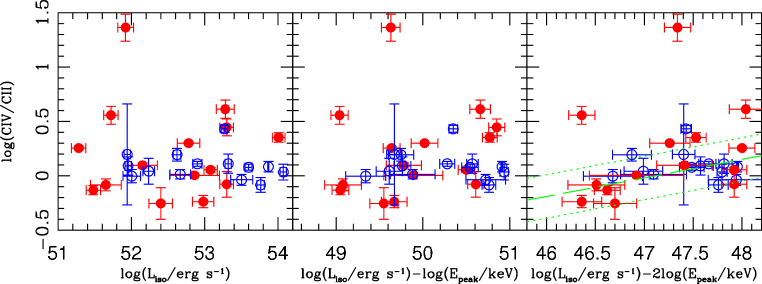
Figure 3 shows updated dependence of CIV/CII line ratio on both (right panel) and (middle panel) by combining the current XS-GRB sample and the sample previously used in Wang et al. (2018). The line ratio is also plotted against in the left panel in the same figure. After excluding the five bursts with a upper limit of EW(CII), there are in total 28 bursts used in the current study. One can see clearly from the figure there is no dependence of the line ratio on . Although there seems to be a clear deviation at the large () end, the dependence is confirmed and reinforced by the current study with enlarged sample for the bursts with (), where and are in units of and keV, respectively. We here argue that the deviation could be resulted from a wide distribution of the gamma-ray photons of the prompt emission, although is a useful indication of the typical photon energy (e,g, Geng et al. 2018).
In the CIV/CII versus plot, after excluding the two outliers with extremely large CIV/CII line ratios, a non-parametric statistical test yields a Kendall’s and a Z-value of 2.627 at a significance level with a probability of null correlation of . We model the linear relationship as according to the D’Agostini fitting method (D’Agostini 2005, see also in, e.g., Guidorzi et al. 2006; Amati et al. 2008), where is the extra Gaussian scatter. The updated optimal values obtained by the maximum likelihood method results in a relationship
| (2) |
with an extra scatter of . The best-fitted relationship is overplotted in Figure 3. Compared to our previous study in Wang et al. (2018), the current enlarged sample results in a much shallow dependence because of the deviation at the large end, although the intrinsic scatter is almost not changed.
A poor correlation can be obtained for the dependence of the line ratio on . The same statistics yields and a Z-value of 1.689 at a significance level with a probability of null correlation of .
| GRB | EW(CII/CII) | EW(CIV) | EW(CIV) | References | |||
|---|---|---|---|---|---|---|---|
| Å | Å | Å | keV | ||||
| (1) | (2) | (3) | (4) | (5) | (6) | (7) | (8) |
| 090926A | 2.106 | 1 | |||||
| 111107A | 2.893 | 1 | |||||
| 120119Aa | 1.729 | 2 | |||||
| 120716A | 2.486 | 2 | |||||
| 120815A | 2.359 | 1 | |||||
| 130408A | 3.758 | 1 | |||||
| 130612A | 2.006 | 1 | |||||
| 141028A | 2.332 | 1 | |||||
| 141109A | 2.993 | 1 | |||||
| 150301Ba | 1.517 | 1 | |||||
| 150403A | 2.057 | 2 | |||||
| 151021A | 2.333 | 1 | |||||
| 160625B | 1.406 | 2 | |||||
| 161023A | 2.710 | 2 |
References in the last column: (1) Ghirlanda et al. (2018); (2) Xue et al. (2019)
5 Summary
In this paper, a pilot study on the spectroscopic follow-up of GRB afterglows for the forthcoming SVOM era is performed in two aspects. On one hand, based on the archival XS-GRB spectral database, our simulation indicates that the color obtained from the SVOM/VT blue and red channels is effective for discriminating between GRBs and distant GRB candidates until , although the latter are inevitably contaminated by the local dusty GRBs. The contamination can be greatly reduced if we focus only on GRBs.
On the other hand, by doubling the sample size through the XS-GRB spectral database, the previously proposed global photoionization response of the circumburst gas to the prompt emission (i.e., the CIV/CII- relationship) is roughly confirmed, and the confirmation is dissatisfactory at the large end. We state that thanks to SVOM’s capability of rapid identification of optical candidates of afterglow and its anti-solar pointing strategy, a large spectroscopy sample is expected in the SVOM era to address this issue.
Acknowledgements.
The authors thank the anonymous referee for his/her careful review and helpful suggestions that improved the manuscript. The study is supported by the National Natural Science Foundation of China under grant 11773036 & 11533003, and by the Strategic Pioneer Program on Space Science, Chinese Academy of Sciences, grant Nos. XDA15052600 & XDA15016500. JW is supported by Natural Science Foundation of Guangxi (2018GXNSFGA281007), and by Bagui Young Scholars Program.References
- Amati et al. (2008) Amati, L., Guidorzi, C., Frontera, F., et al. 2008, MNRAS, 391, 577
- Bouwens et al. (2011a) Bouwens, R. J., Illingworth, G. D., Labbe, I., et al. 2011a, Nature, 469, 504
- Bouwens et al. (2011b) Bouwens, R. J.; Illingworth, G. D.; Oesch, P. A., et al. 2011b, ApJ, 737, 90
- Butler et al. (2007) Butler, N. R., Kocevski, D., Bloom, J. S., & Curtis, J. L. 2007, ApJ, 671, 656
- Chornock et al. (2014) Chornock, R., Berger, E., Fox, D. B., et al. 2014, arXiv:1405.7400
- Cordier et al. (2015) Cordier, B., Wei, J., Atteia, J.-L., et al. 2015, arXiv:1512.03323
- Cucchiara et al. (2011) Cucchiara, A., Levan, A. J., Fox, D. B., et al. 2011, ApJ, 736, 7
- D’Agostini (2005) D’Agostini, G. 2005, arXiv:physics/0511182
- Dai et al. (2001) Dai, Z. G., Huang, Y. F., & Lu, T. 2001, MNRAS, 324, L11
- Deng et al. (2010) Deng, W., Huang, Y, -F., & Kong, S. -W. 2010. \raa, 10, 1119
- D’Elia et al. (2009) D’Elia, V., Fiore, F., Perna, R., et al. 2009, A&A, 503, 437
- D’Elia et al. (2010) D’Elia, V., Fynbo, J. P. U., Covino, S., et al. 2010, A&A, 523, 36
- Fan et al. (2006) Fan, X. H., Carilli, C. L., & Keating, B. 2006, ARA&A, 44, 415
- Fukugita et al. (1996) Fukugita, M., Ichikawa, T., Gunn, J. E., Doi, M., Shimasaku, K. & Schneider, D. P. 1996, AJ, 111, 1748
- Geng et al. (2018) Geng, J. J., Huang, Y. F., Wu, X. F. Zhang, B., & Zong, H. S. 2018, ApJS, 234, 3
- Ghirlanda et al. (2018) Ghirlanda, G., Nappo, F., Ghisellini, G., et al. 2018, A&A, 609, 112
- Godet et al. (2014) Godet, O., Nasser, G., Atteia, J.-., et al. 2014b, in Proceedings of the SPIE, Vol. 9144, Space Telescopes and Instrumentation 2014: Ultraviolet to Gamma Ray, 914424
- Gotz et al. (2014) Gotz, D., Osborne, J., Cordier, B., et al. 2014, in Proc. SPIE, Vol. 9144, Space Telescopes and Instrumentation 2014: Ultraviolet to Gamma Ray, 914423
- Greiner et al. (2009) Greiner, J., Kruhler, T., Fynbo, J. P. U., et al. 2009, ApJ, 693, 1610
- Hjorth & Bloom (2012) Hjorth, J., & Bloom, J. S. 2012, in Gamma-Ray Bursts, Vol. 51, ed. C. Kouveliotou, R. A. M. J. Wijers, & S. Woosley (Cambridge: Cambridge Univ. Press), 169
- Kawai et al. (2006) Kawai, N., Kosugi, G., Aoki, K., et al. 2006, Nature, 440, 184
- Kriss (1994) Kriss, G. 1994, Adass, 3, 437
- Kruhler et al. (2011a) Kruhler, T., Greiner, J., Schady, P., et al. 2011, A&A, 534, 108
- Kruhler et al. (2015) Kruhler, T., Malesani, D., Fynbo, J. P. U., et al. 2015, A&A, 581, 125
- Kruhler et al. (2011b) Kruhler, T., Schady, P., Greiner, J., et al. 2011b, A&A, 526, 153
- Liang et al. (2003) Liang, S. L., Dai, Z. G., Huang, Y. F., & Lu, T. 2003, ChJAA, 3, 526
- Melandri et al. (2015) Melandri, A., Bernardini, M. G., D’Avanzo, P., et al. 2015, A&A, 581, 86
- Perna et al. (2003) Perna, R., Lazzati, D., & Fiore, F. 2003, ApJ, 585, 775
- Petitjean et al. (2016) Petitjean, P., Wang, F. Y., Wu, X. F., & Wei, J. J. 2016, Space Science Reviews, 202, 195
- Prochaska et al. (2006) Prochaska, J. X., Chen, H.-W., & Bloom, J. S. 2006, ApJ, 648, 95
- Prochaska et al. (2007) Prochaska, J. X., Chen, H.-W., Bloom, J. S., et al. 2007, ApJS, 168, 231
- Robertson & Ellis (2012) Robertson, B. E., & Ellis, R. S. 2012, ApJ, 744, 95
- Salvaterra et al. (2009) Salvaterra, R., Della Valle, M., Campana, S., et al. 2009, Nature, 461, 1258
- Savaglio et al. (2003) Savaglio, S., Fall, S. M., & Fiore, F. 2003, ApJ, 585, 638
- Selsing et al. (2019) Selsing, J., Malesani, D., Goldoni, P., et al. 2019, A&A, 623, 92
- Tagliaferri et al. (2005) Tagliaferri, G., Antonelli, L. A., Chincarini, G., et al. 2005, A&A, 443, L1
- Tanvir et al. (2009) Tanvir, N. R., Fox, D. B., Levan, A. J., et al. 2009, Nature, 461, 1254
- Tejos et al. (2009) Tejos, N., Lopez, S., Prochaska, J. X., et al. 2009, ApJ, 706, 1309
- Tejos et al. (2007) Tejos, N., Lopez, S., Prochaska, J. X., Chen, H.-W., & Dessauges-Zavadsky, M. 2007, ApJ, 671, 622
- Thone et al. (2007) Thone, C. C., Greiner, J., Savaglio, S., et al. 2007, ApJ, 671, 628
- Totani et al. (2006) Totani, T., Kawai, N., Kosugi, G., et al. 2006, PASJ, 58, 485
- Vangioni et al. (2015) Vangioni, E., Olive, K. A., Prestegard, T., et al. 2015, MNRAS, 447, 2575
- Vergani et al. (2009) Vergani, S. D., Petitjean, P., Ledoux, C., et al. 2009, A&A, 503, 771
- Vernet et al. (2011) Vernet, J., Dekker, H., D’Odorico, S., et al. 2011, A&A, 536, 105
- Vreeswijk et al. (2007) Vreeswijk, P. M., Ledoux, C., Smette, A., et al. 2007, A&A, 468, 83
- Wang (2013a) Wang, F. Y. 2013a, A&A, 556, A90
- Wang (2013b) Wang, J. 2013b, ApJ, 776, 96
- Wang & Dai (2009) Wang, F. Y., & Dai, Z. G. 2009, MNRAS, 400, L10
- Wang et al. (2015) Wang, F. Y., Dai, Z. G., & Liang, E. W. 2015, NewAR, 67, 1
- Wang et al. (2018) Wang, J., Xin, L. P., Qiu, Y. L., Xu, D. W., & Wei, J. Y. 2018, ApJ, 855, 91
- Waxman & Draine (2000) Waxman, E., & Draine, B. T. 2000, ApJ, 537, 796
- Wei et al. (2016) Wei, J. Y., Cordier, B., Antier, S., et al. 2016, arXiv:1610.0689
- Woosley & Bloom (2006) Woosley, S. E., & Bloom, J. S. 2006, ARA&A, 44, 507
- Xue et al. (2019) Xue, L., Zhang, F. W., & Zhu, S. -Y. 2019, ApJ, 876, 77