Abstract
The recent worldwide outbreak of the novel coronavirus (COVID-19) has opened up new challenges to the research community. Artificial intelligence (AI) driven methods can be useful to predict the parameters, risks, and effects of such an epidemic. Such predictions can be helpful to control and prevent the spread of such diseases. The main challenges of applying AI is the small volume of data and the uncertain nature. Here, we propose a shallow long short-term memory (LSTM) based neural network to predict the risk category of a country. We have used a Bayesian optimization framework to optimize and automatically design country-specific networks. The results show that the proposed pipeline outperforms state-of-the-art methods for data of 180 countries and can be a useful tool for such risk categorization. We have also experimented with the trend data and weather data combined for the prediction. The outcome shows that the weather does not have a significant role. The tool can be used to predict long-duration outbreak of such an epidemic such that we can take preventive steps earlier.
keywords:
COVID-19; trend prediction; optimized neural networkxx \issuenum1 \articlenumber5 \historyReceived: 11 August 2020; Accepted: 11 September 2020; Published: date \updatesyes \TitleNeural Network Based Country Wise Risk Prediction of COVID-19 \AuthorRatnabali Pal 1\orcidA, Arif Ahmed Sekh 2\orcidA, Samarjit Kar 3 and Dilip K. Prasad 1,*\orcidA \AuthorNamesFirstname Lastname, Firstname Lastname and Firstname Lastname \corresCorrespondence: dilip.prasad@uit.no
1 Introduction
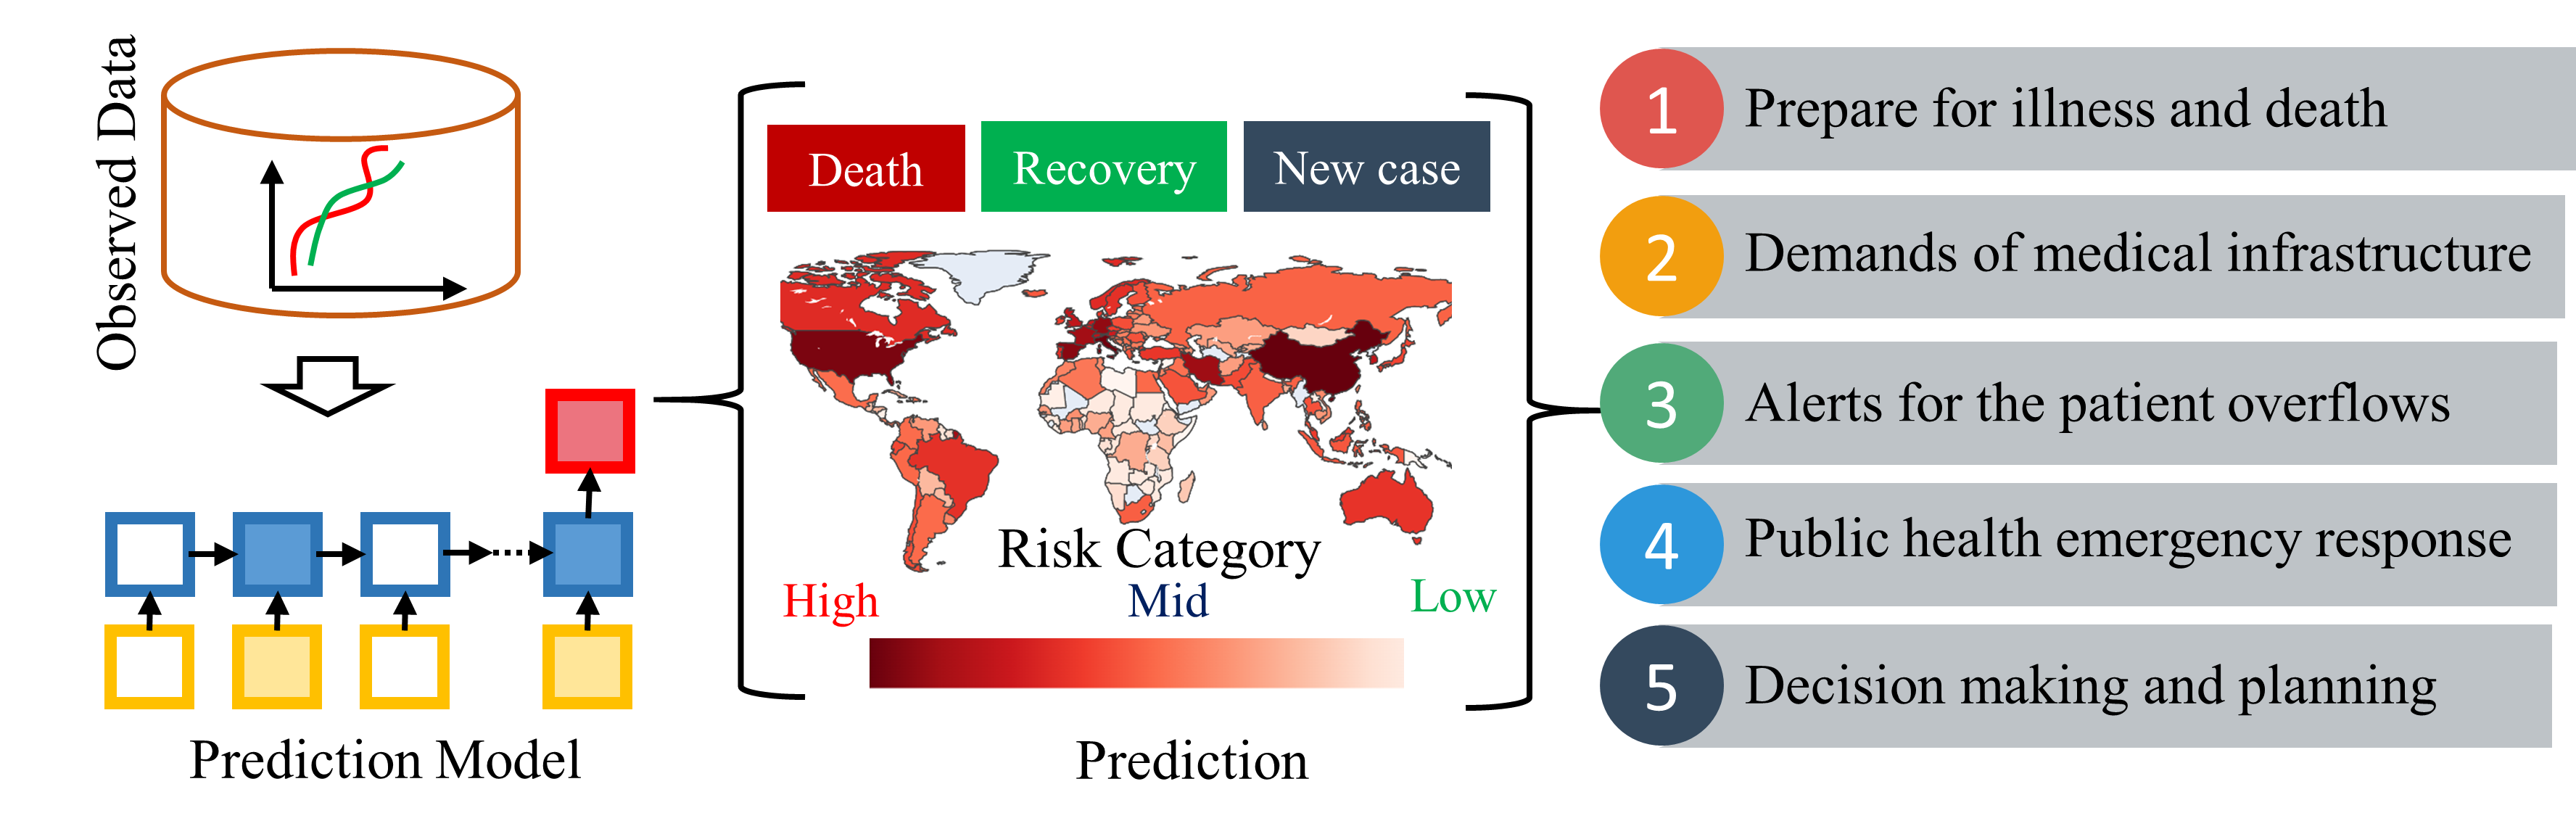
The novel coronavirus (COVID-19) hit our blue planet and became an ongoing global pandemic Wu et al. (2020). In a little over six months since the virus was first spotted in mainland China, it has spread to more than 180 countries, infected more than 18.4 million people, and taken more than 692,000 lives as reported in the first week of August 2020. As governments and health organizations scramble to contain the spread of coronavirus, they need all the help they can get, including from artificial intelligence (AI). Though the current AI technologies are far from replicating human intelligence, they are proving to be helpful in tracking the outbreak, diagnosing patients, disinfecting areas, and speeding up the process of finding a cure for COVID-19. Forecasting is a collection of quantitative, probabilistic statements based on historical observation. It is a process of predicting unobserved events and trends. Population health monitoring and forecasting, including epidemiological outbreaks may not have any clinical utility but can be useful tool for planning, decision making and prevention (see Figure 1).
The early prediction of epidemics will benefit governments and health-care departments to enable a timely response to outbreaks. It will minimize the impact and ensure the use of resources in a planed manner. For many contagious diseases, location specific prediction of the trend is useful to minimize the risk of spread at community level by limiting social gatherings and imposing travel restrictions. Similarly, strategy makers utilize infectious disease forecasts towards prepare medical and economic preparedness. The forecasting of social impact Cheong and Jones (2020) is also useful for long-term strategy makers.
In the last few years, AI methods have been successfully applied to various predictive tasks such as stock value Akita et al. (2016), sales Ali and Lee (2018) and weather Xiao and Ai (2018) prediction, as well as predicting epidemic spread Lu et al. (2019). Prediction techniques also proved to be useful in many healthcare applications. Lin et al. Lin et al. (2020) shows how the prediction of ambulance demand provides great value to emergency service providers.
In this paper, we have proposed an AI-guided method to predict long-term country-specific risk of coronavirus. The primary challenges of this problem are:
Small dataset: Majority of machine learning (ML) algorithms demand a large volume of data for training. Notably, the COVID-19 dataset is less than a year-long and it is difficult to design accurate AI methods to train on such small volume of data.
Uncertain data: The virus is quite new to the researchers and the majority of the parameters that can be used to predict the outbreak and risk factors are unknown. It is observed that the trend is also different in different countries. Hence, a generic AI tool may not be suitable for tracking all trends. It is also noted state-of-the-art deep neural networks fail because of the uncertainty in the data. This observation encourages us to design shallow and country-specific optimized neural networks.
Data fusion: In many articles, it is claimed that the weather has a role in the outbreak of the virus. Most of the research works are shown in a country-specific manner Tosepu et al. (2020); Gupta et al. (2020); Şahin (2020). A systematic analysis of worldwide different weather parameters and the outbreak status can be useful for better understanding the relation.
Here, we have proposed to use the local data trend with a shallow Long Short-Term Memory (LSTM) based neural network combined with a fuzzy rule based system to predict long term risk of a country (Figure 1). The country-specific neural networks are optimized using Bayesian optimization.
2 Related Works
We note three communities of the related work: (A) AI in epidemic research, (B) research works on COVID-19, and (C) multivariate regression in AI. These are discussed below:
(A) AI based epidemic researches: Real-time epidemic-forecasting attracts several researchers due to the emerging applicability of the method. Jia et al. Jia et al. (2019) proposed a neural network for predicting the outbreak of hand-foot-mouth diseases. Hamer et al. Hamer et al. (2020) used ML algorithms to predict spatio-temporal epidemic spread of pathological diseases. AI tools for predicting outbreak in cardiovascular diseases Mezzatesta et al. (2019); Jhuo et al. (2019), influenza Kumar et al. (2020), and epidemic diarrhea Machado et al. (2019) is also proposed. A review of the application of AI for such a prediction is reported in Philemon et al. (2019). A collective learning based approach Abdulkareem et al. (2020) is proposed to identify individual risk. In the last few years, machine learning analysis was used to predict epidemiological characteristics of the Ebola virus (EBOV) outbreak in West Africa Forna et al. (2019) and the risk of Nipah virus Dallatomasina et al. (2015). Plowright et al. Plowright et al. (2019) proposed a surveillance method to monitor Nipah virus in India. Recently, Seetah et al. Seetah et al. (2020) proposed a method for predicting future Rift Valley fever virus outbreaks. The majority of the algorithms use a combined decision-making application using statistical and machine learning methods to predict future growth based on past incident data.
(B) Researches on COVID-19: The recent COVID-19 outbreak has motivated many researchers to help and find a way to recover from the pandemic. Rao et al. Rao and Vazquez (2020) proposed methods to detect COVID-19 patients using a mobile phone. Yan et al. Yan et al. (2020) built a predictive model to identify early detection of high-risk patients before their health status is transformed from mild to critically ill. In recent times, numerous research articles have been published on epidemic prediction of the coronavirus pandemic Peng et al. (2020); Zhao et al. (2020); Chen et al. (2020); Li et al. (2020); Hilton and Keeling (2020); Kastner et al. (2020); Jia et al. (2020); Zhao et al. (2020); Zeng et al. (2020); Buizza (2020). Researchers designed new paradigms of AI-driven tools Fong et al. (2020); Santosh (2020) that combine ML algorithms and different modalities of data. An improved adaptive neuro-fuzzy inference system (ANFIS) methodology is proposed in Al-qaness et al. (2020). The algorithm is based on an enhanced flower pollination algorithm (FPA) by using the salp swarm algorithm (SSA) to estimate confirmed cases in the next 10 days. Li et al. Li et al. (2020) developed a regression model to calculate the exponential growth of COVID-19 infection based on the total number of daily diagnoses cases outside China. Analysts in Araujo and Naimi (2020) obtained projections from 10 familiar machine learning and statistical ecological niche models against the large-scale climatology variation.
(C) Multivariate Regression in AI: The key point in time series study Dong and Sun (2019) is forecasting. Time series analysis for business prediction helps to forecast the probable future values of a practical field in the industry Moews et al. (2019); Thomas (2019); Lorenzo and Olivas (2019); Bandara et al. (2019). The method is also applicable in the health domain to predict the health condition of a person on the last diagnosis dataCui et al. (2019). The method uses a feature attention mechanism to predict future health risks. Oh et al. Oh et al. (2018) use a combination of convolutional neural network (CNN) and LSTM for automated diagnosis of arrhythmia. The input electrocardiogram signal is processed using CNN and processed using LSTM to handle variable length signal. A multiple regression predictive model Ho et al. (2019) was used to predict patient volume in the hospital emergency departments. The authors used Google trend for forecasting. Other health areas such as antibiotic resistance outbreaks Jiménez et al. (2020) and influenza outbreaks Tapak et al. (2019); Su et al. (2019) utilized multivariate regression models. Different algorithms such as deep neural network Ochodek et al. (2020); Hu et al. (2020), long short-term memory model (LSTM) Wen et al. (2019) and gated recurrent unit (GRU)-based model Yuan et al. (2019) have been successfully applied in various forecasts. The methods rely on specific-less estimation error and running time on data sets with characteristics of multivariate, sequential and time-series data.
Gap bridged by our method: The main challenge of predicting the long term risk of a country is solved by designing dynamic shallow recurrent neural network (RNN) which is optimized for an individual country, and combining fuzzy rules for inference. It is reported in Santosh (2020) that designing a custom network based on input data is a suitable solution. This observation inspired us to design an optimized network for each country. The problem of insufficient data is solved by choosing an optimized shallow network and the problem of predicting local trends is solved by optimizing the neural networks for individual countries. This introduces a new way to predict an epidemic outbreak and correlate with the risk of a country. In many research works Tosepu et al. (2020); Gupta et al. (2020); Şahin (2020), correlation of weather with the virus spread is indicated. We have analyzed using Spearman’s rank correlation coefficient analysis and ordinary least squares (OLS) regression and found that the prediction of new cases, recovery, and death does not depend on the weather. The proposed neural models perform similar (or better in some cases) without the weather data.
3 Proposed Model
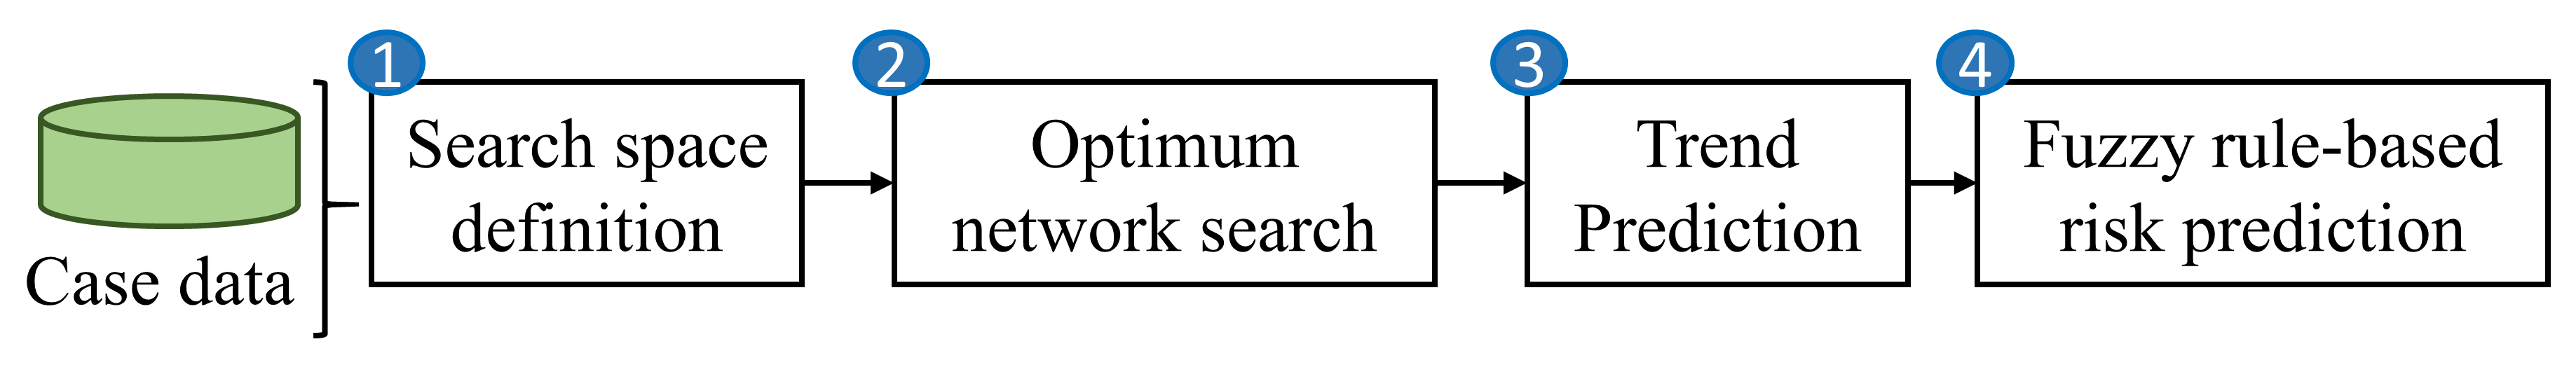
The proposed framework consists of four modules as shown in Figure 2. The modules are (1) search space definition module, (2) network search module, (3) local trend prediction, and (4) a fuzzy rule-based risk assessment module. We first discuss the background of RNN and then these modules below:
3.1 Background
We propose to use a shallow long short-term memory (LSTM) with a few layers. LSTM is also a variation of RNN like GRU. Fundamentally, an RNN handles the sequence by having a recurrent hidden state whose activation at each time is dependent on the state at the previous time. Formally, for a set of input , the RNN estimates its hidden state by
| (1) |
where is the nonlinear function. The hidden states are updated by
| (2) |
where is a bounded function. A general RNN estimates the conditional probability of each input state as
| (3) |
LSTM is adaptive and estimates dependencies of different time scales. The commonly used RNN variations such as LSTM use gate and memory cells for sequence prediction. Initially, LSTM initiates with a forget gate layer that uses a sigmoid function combined with the previous hidden layer and the current input as:
| (4) |
where is weight and is the bias. A hypertangent layer () is represented by a tanh cell as:
| (5) |
This information is passed to the next cell as:
| (6) |
where also a sigmoid function. Finally, this information passed to the next hidden layers as:
| (7) |
where is also a sigmoid function known as the output gate. The graphical representation of LSTM is presented in Figure 3.

We have used a similar structure of LSTM module as the building blocks of the proposed system.
3.2 Search Space Definition
Each country has a different trend and demands a neural network with different parameter setup. The input data is fixed for all countries that contain three main concerns for the risk categorization. Number of cases (), number of deaths (), and number of recoveries (). The number of active cases () is calculated by . The learning algorithm (here LSTM) is defined by a set of parameters. Let be a set of hyperparameters of the learning algorithm and be domains of the parameters, known as the search space. Table 1 summarized the parameters and the search space used in our method.
| Parameter | Description | Distribution/Selection | Values |
|---|---|---|---|
| Learning rate | Minimum learning rate | Log uniform | 1 to 1 10-7 |
| Hidden layers | Number of layers in the network | Discrete numeric | 1 to 20 |
| Hidden state | Number of memory cell in each layer | Discrete numeric | 1 to 200 |
| Activation | Activation in each layer | Category | {ReLU,sigmoid,tanh} |
| Batch size | Batch size during training | Discrete numeric | 2 to 10 |
| Dropout | Dropout size before dense layer | Log uniform | 0 to 0.5 |
3.3 Network Search
Let be different hyperparameters of a learning algorithm and be domains of the parameters as defined earlier. The dataset () is divided into train () and test (). The hyperparameter space is . Training data is trained on . The test error is the error on of the parameter . The hyperparameter is optimized for a given dataset () by minimizing:
| (8) |
We have considered root-mean-square error (RMSE) on validation set to chose best architecture. Hence, the problem can be defined as:
| (9) |
In general, the problem of hyper-parameter search can be very expensive as we need to train and evaluate the dataset for each combination of parameters. Searching algorithms such as random search and grid search are better than manual setup but computationally expensive when we have a large volume dataset and a wide hyper-parameter search space. These methods do not consider the previous outcome to choose the next set of parameters, hence they spend most of the time evaluating bad parameters. In our case, the RMSE of a set of parameters () is estimated by the conditional probability . The method selects the set of hyper-parameters that performs the best according to the probability. First, individual COVID-19 trend is used to automatically design the desired neural network. Next, the network optimized for an individual country is used to predict the number of cases (), the number of deaths (), and the number of recoveries (). These data are used in the next module to decide the risk of the country.
3.4 Fuzzy Rule-Based Risk Categorization
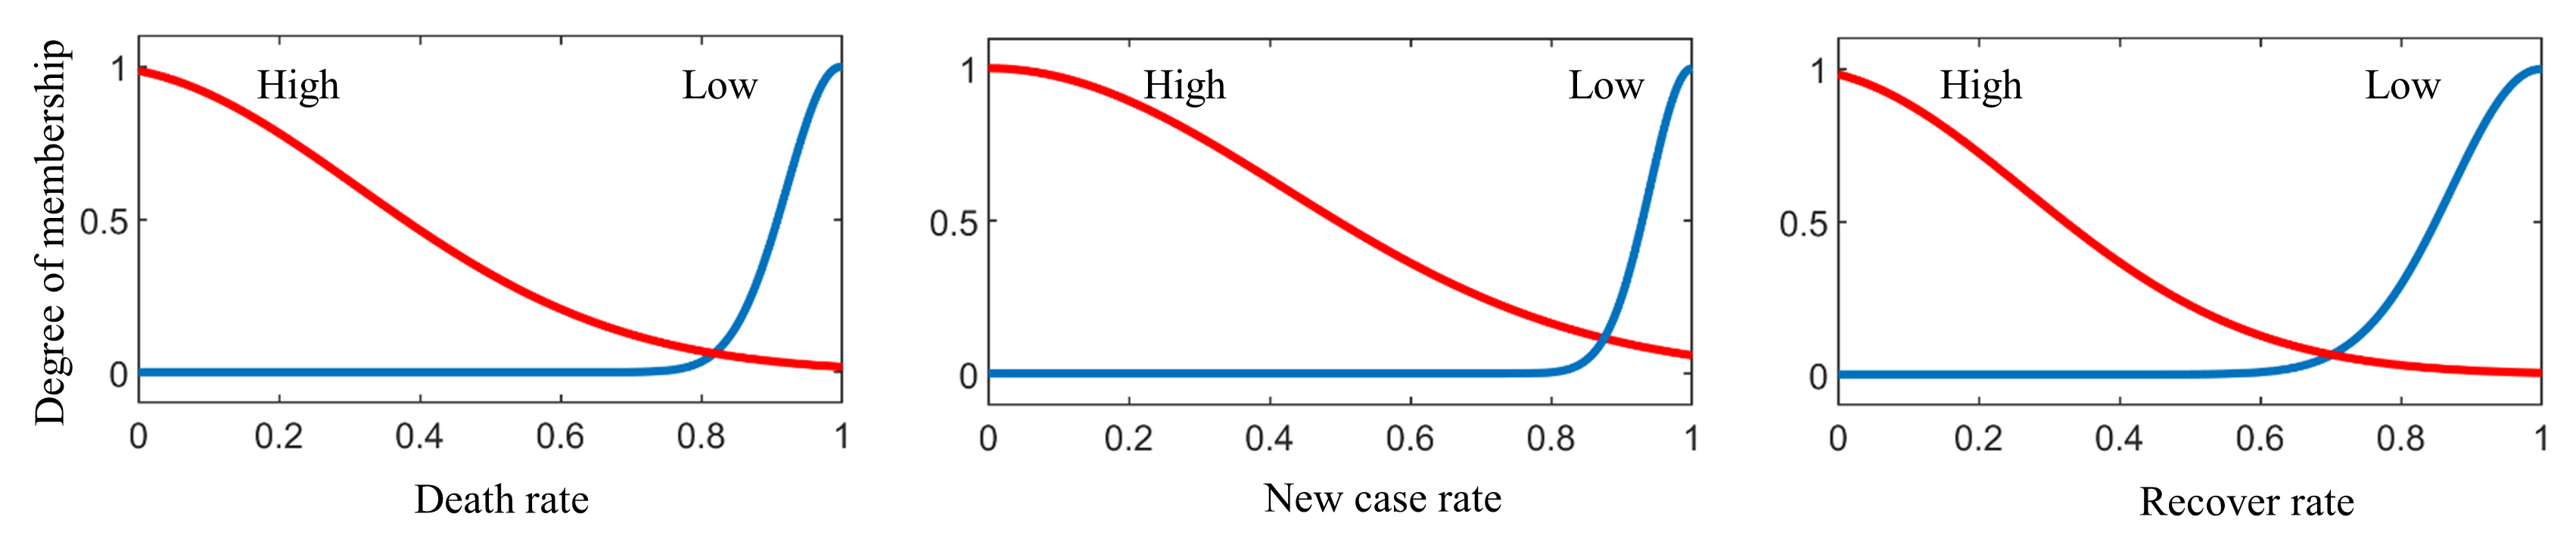
The prediction of , , and is used to predict the risk for the country. We define 3 categories of risks (1) high risk (HR), (2) medium risk (MR), (3) recovering (RE). First, we calculate the death rate, the rate of new cases, and the recovery rate as:
| (10) |
| (11) |
| (12) |
Next, three Gaussian fuzzy membership functions are defined to represent the risk measurement of these parameters as shown in Figure 4. The final class of the risk is estimated my imposing rules defined in Table 2.
| Death rate | Case rate | Recovery rate | Decision |
|---|---|---|---|
| High | High | Low | HR |
| Low | High | Low | HR |
| High | High | High | HR |
| Low | High | High | HR |
| High | Low | High | MR |
| High | Low | Low | MR |
| Low | Low | Low | MR |
| Low | Low | High | RE |
4 Results and Discussion
We conducted various experiments using different baseline algorithms and our proposed method. We have extensively analyzed the results from different perspectives. First, we present the effectiveness of the feature selection method. Next, we discuss the results of proposed network optimization, and we compare the method with the baselines. Finally, we conclude the article with our findings.
4.1 Dataset
We used the dataset (https://github.com/datasets/covid-19) that included date, country, the number of confirmed cases, the number of recovered cases, and the total number of deaths. We combined this data with weather data (https://darksky.net/) consisting of humidity, dew, ozone, perception, maximum temperature, minimum temperature, and UV for analyzing the effect of weather. We considered mean and standard deviation over different cities of a country. The data spanned the duration 22-01-2020 to 02-08-2020.
4.2 Network Optimization
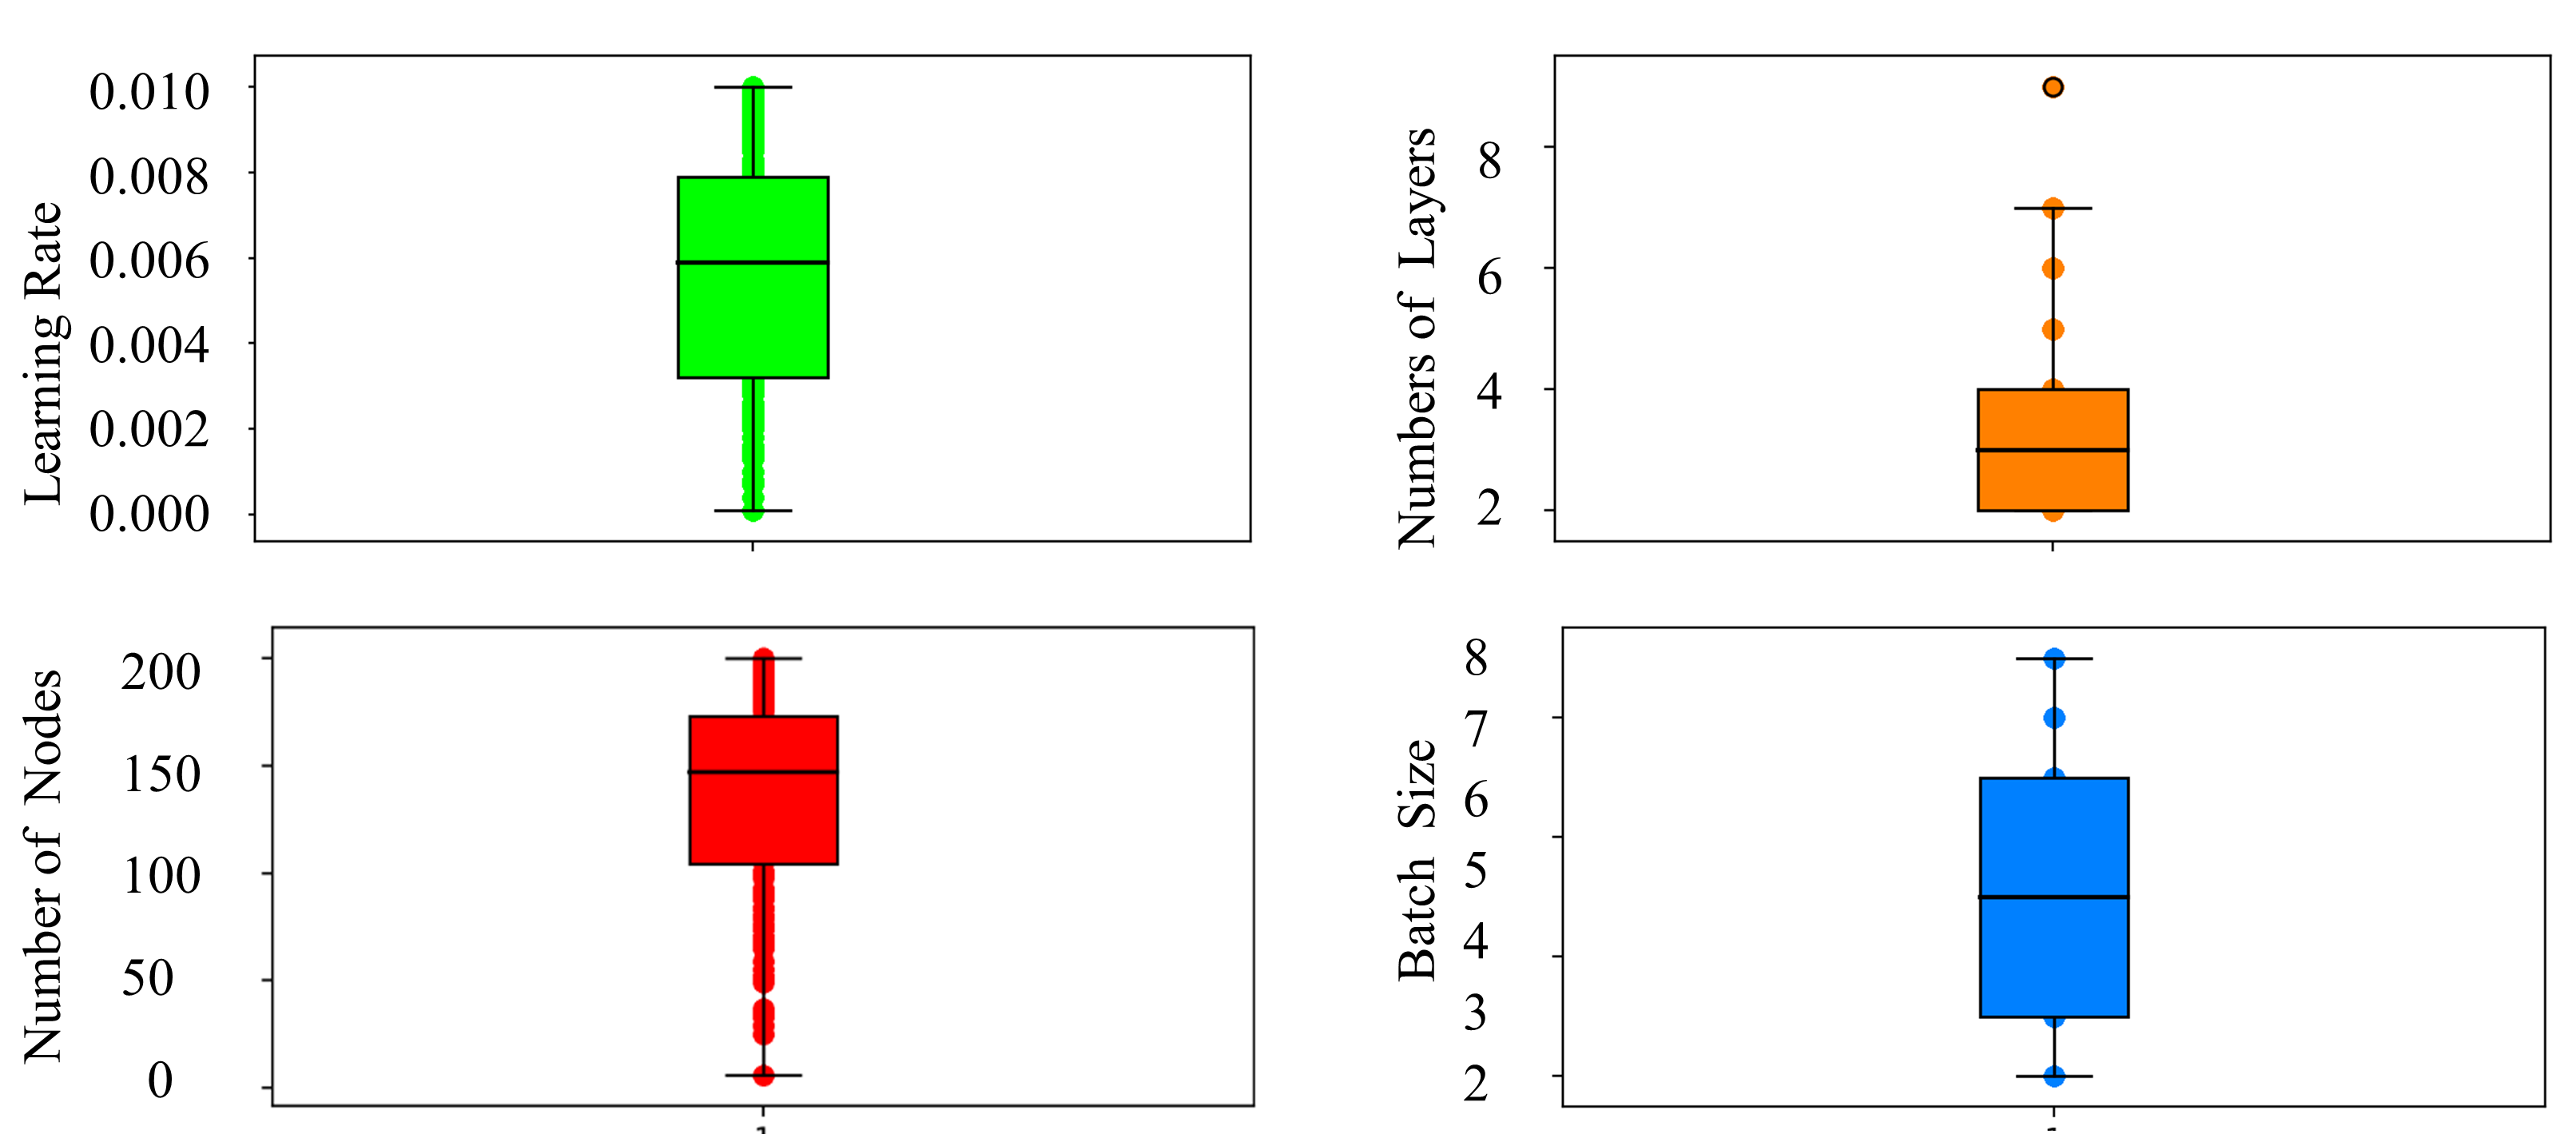
We used 300 iterations with Gaussian noise with variance 0.01 added to the data. The data of the last 25 days were used for validation and the rest were used for training. Each network generated by Bayesian optimization was trained using a maximum of 5000 iterations. We used 100 epoch delay on validation loss for early stopping. We used 300 iterations during optimization. During optimization, RMSE was minimized over the validation set. The data of each country were individually used to generate the country-specific optimized network. It was observed that majority of the optimal networks comprised of only a few layers and hidden units with ReLU activation. The distribution of the parameters over all the generated networks is shown in Figure 5. The dropout was chosen as zero most of the time.
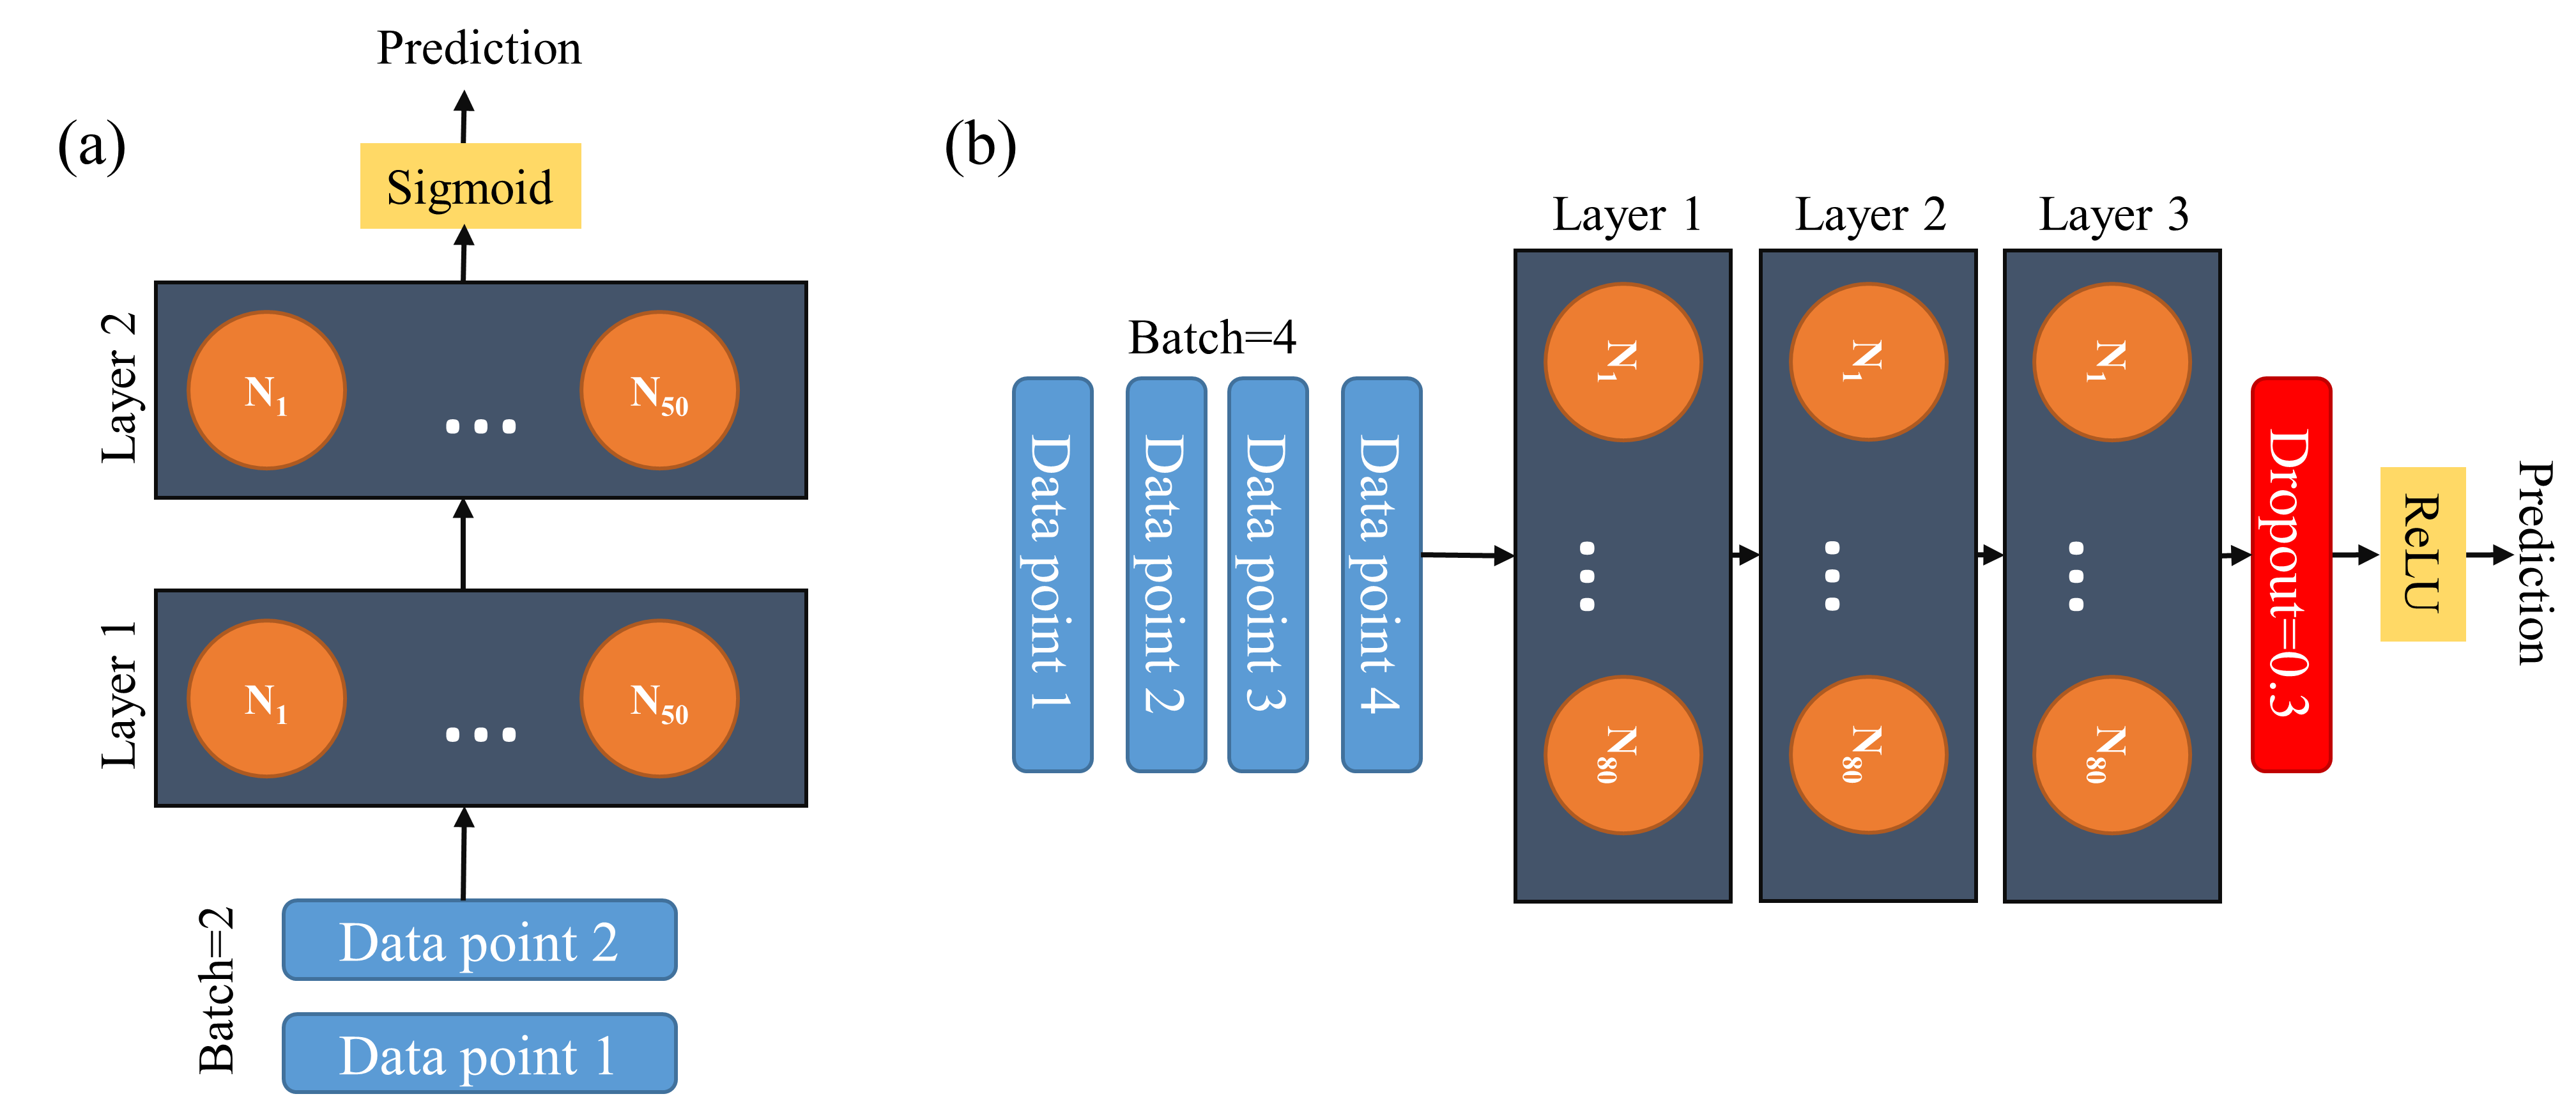
As the proposed solution generated different models for different data (countries), they had different numbers of layers, hidden units, activation functions, batch sizes, and learning rates, individually optimized for each one of them. Figure 6 shows two examples of such LSTMs.
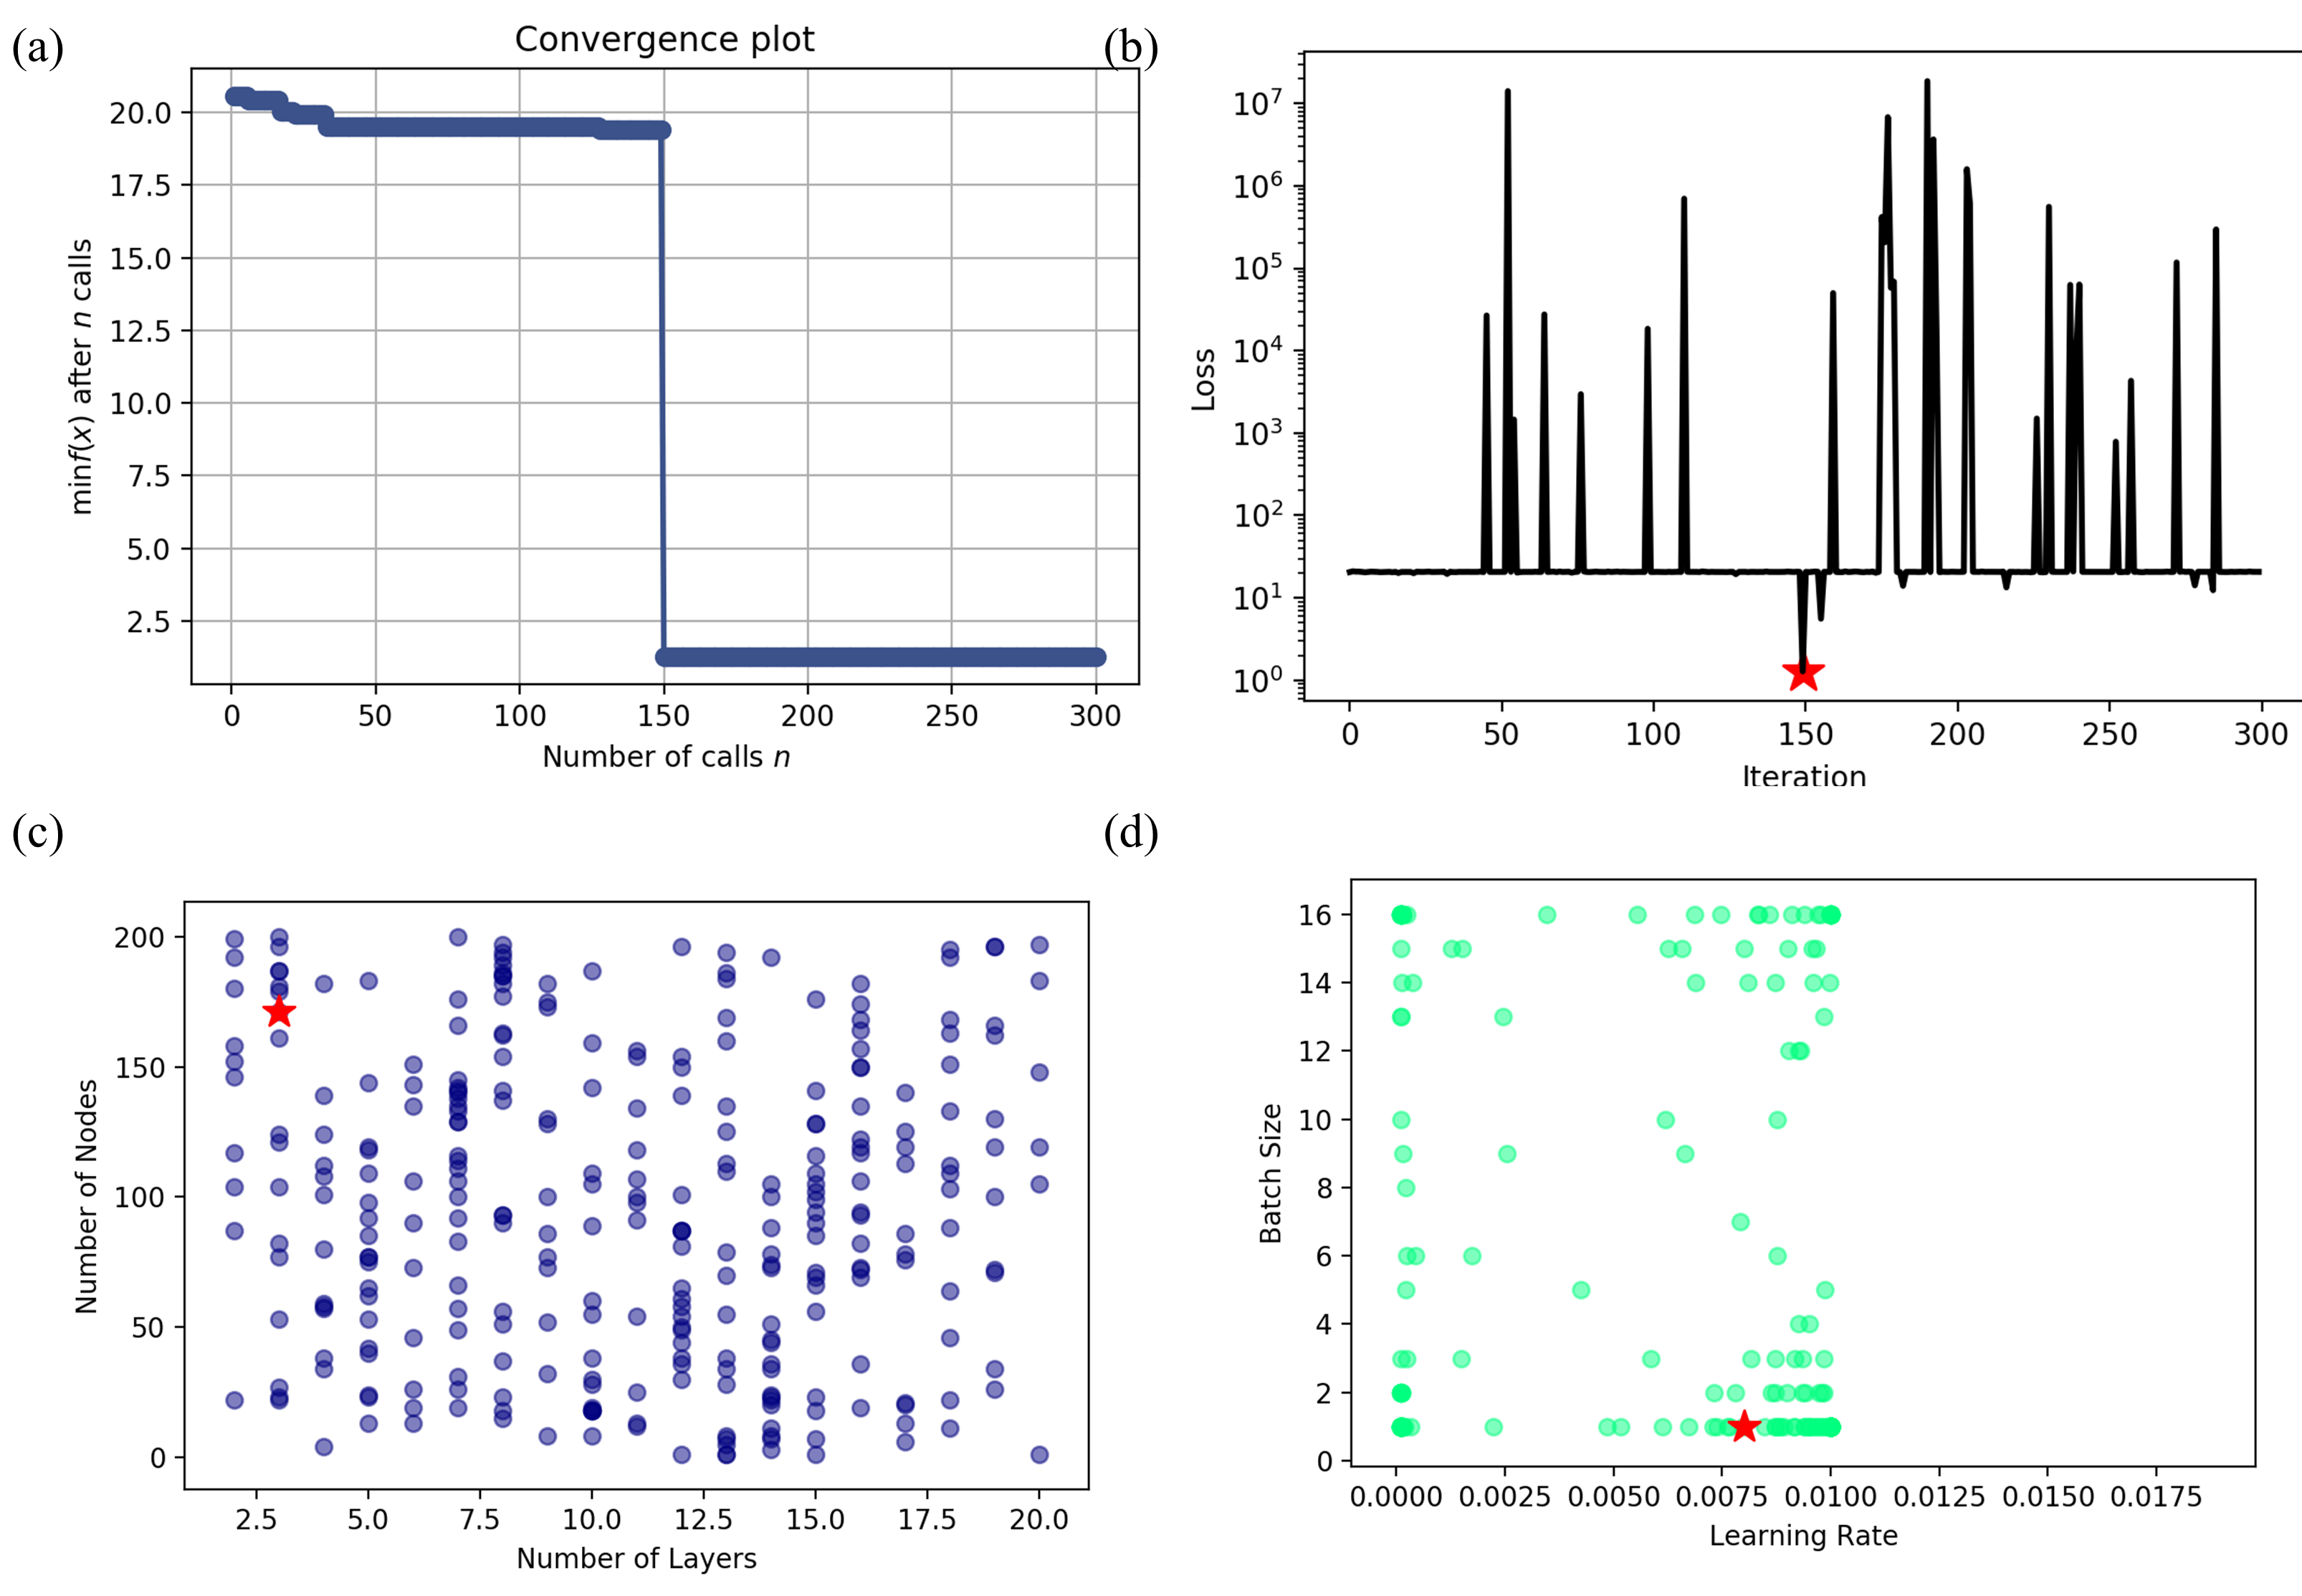
Case study (USA): Here we discuss the optimization output of the network trained for the USA dataset. The optimization ended with a network containing three hidden layers with 171 hidden nodes in each layer. The network’s hyperparameters derived after optimization were as follows: learning rate 0.0002, zero dropout, batch size 6 and ReLU activation method. Figure 7a showed minimum RMSE over iterations, (b) shows different RMSE over iterations. In (c), (d) the distribution of the number of layers and hidden units and the distribution of learning rate and batch size are shown, respectively.
4.3 Training
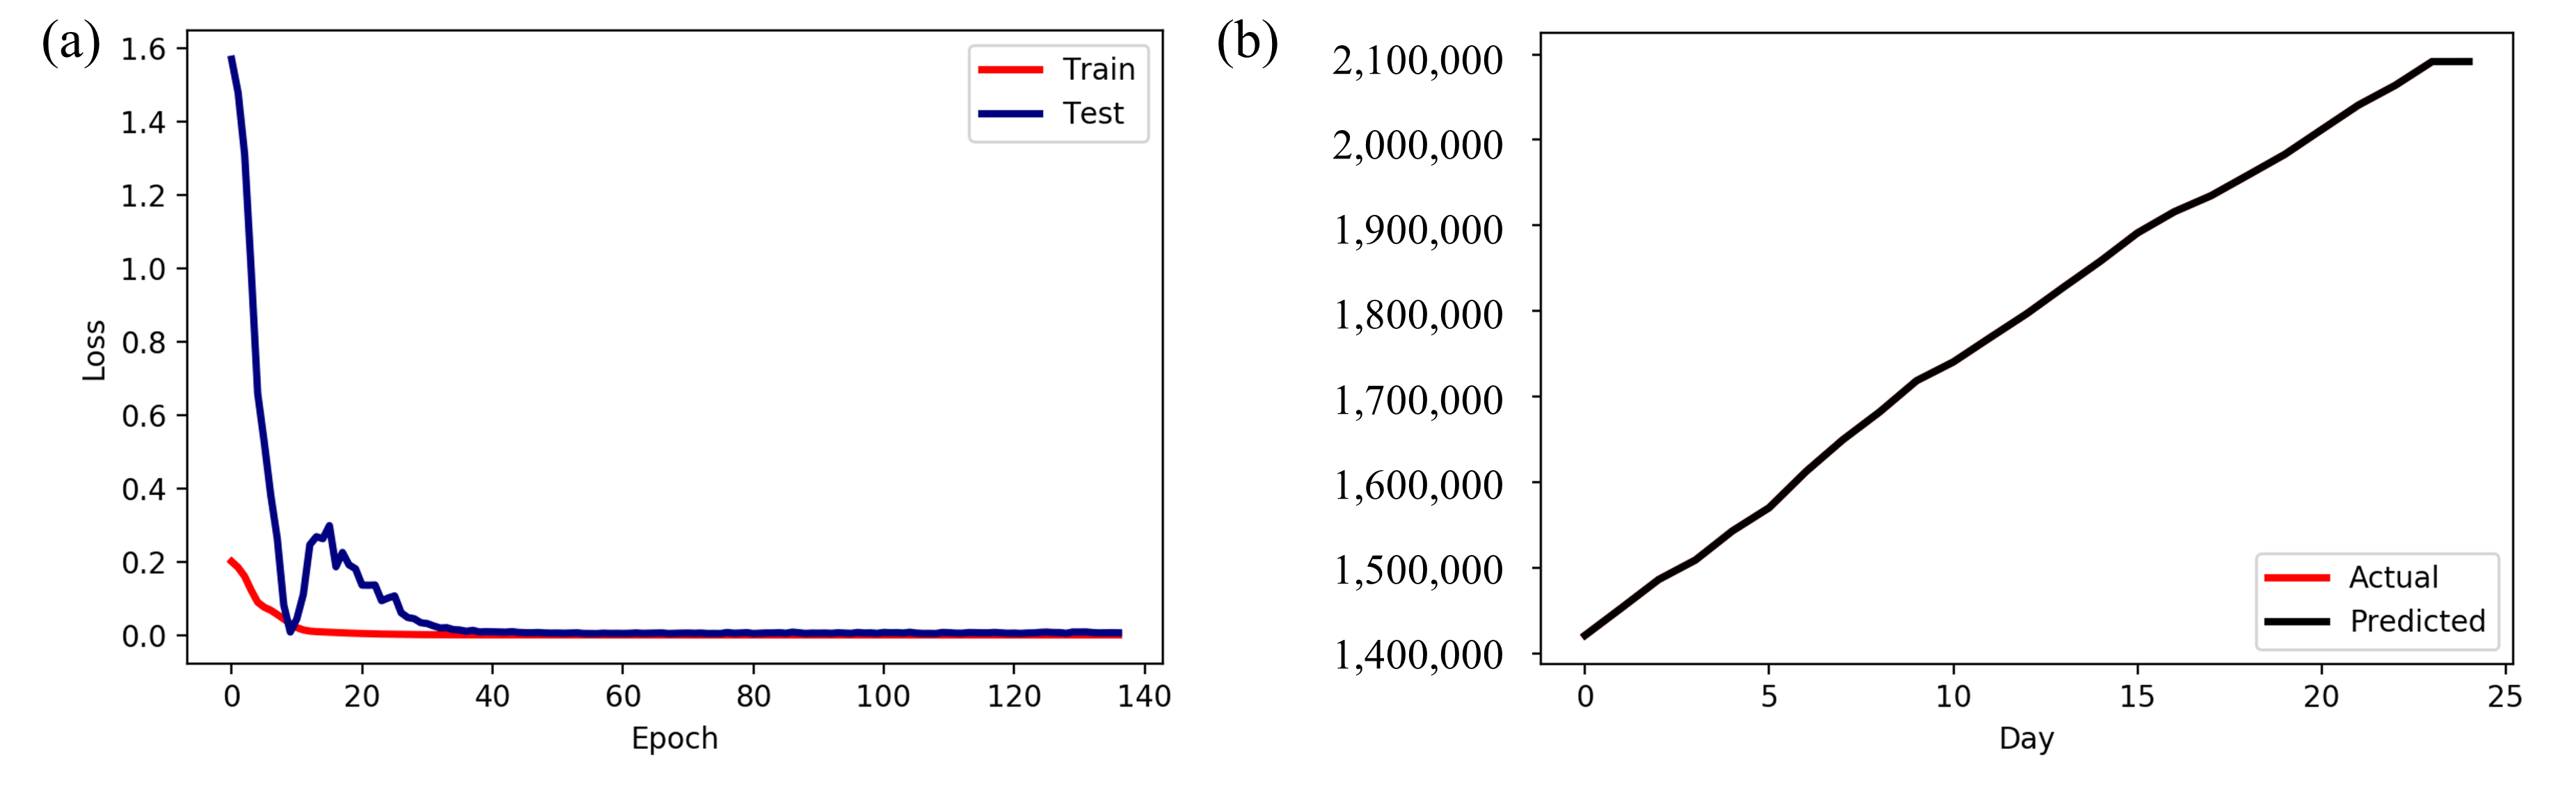
Each country-specific network was trained using its own case data. Although during optimization, the network was validated by predicting active cases, the same network was used to predict death, recovery, and the current number of cases. The networks were trained using a maximum of 5000 epochs combined with the early stopping mechanism used during optimization. The data of the last 25 days were used for test and the rest were used for training. Figure 8 shows the training loss over epochs and active case prediction using the network optimized for USA. It is noted that the loss lowered during training over epochs as it converged to a small value.
4.4 Prediction Accuracy
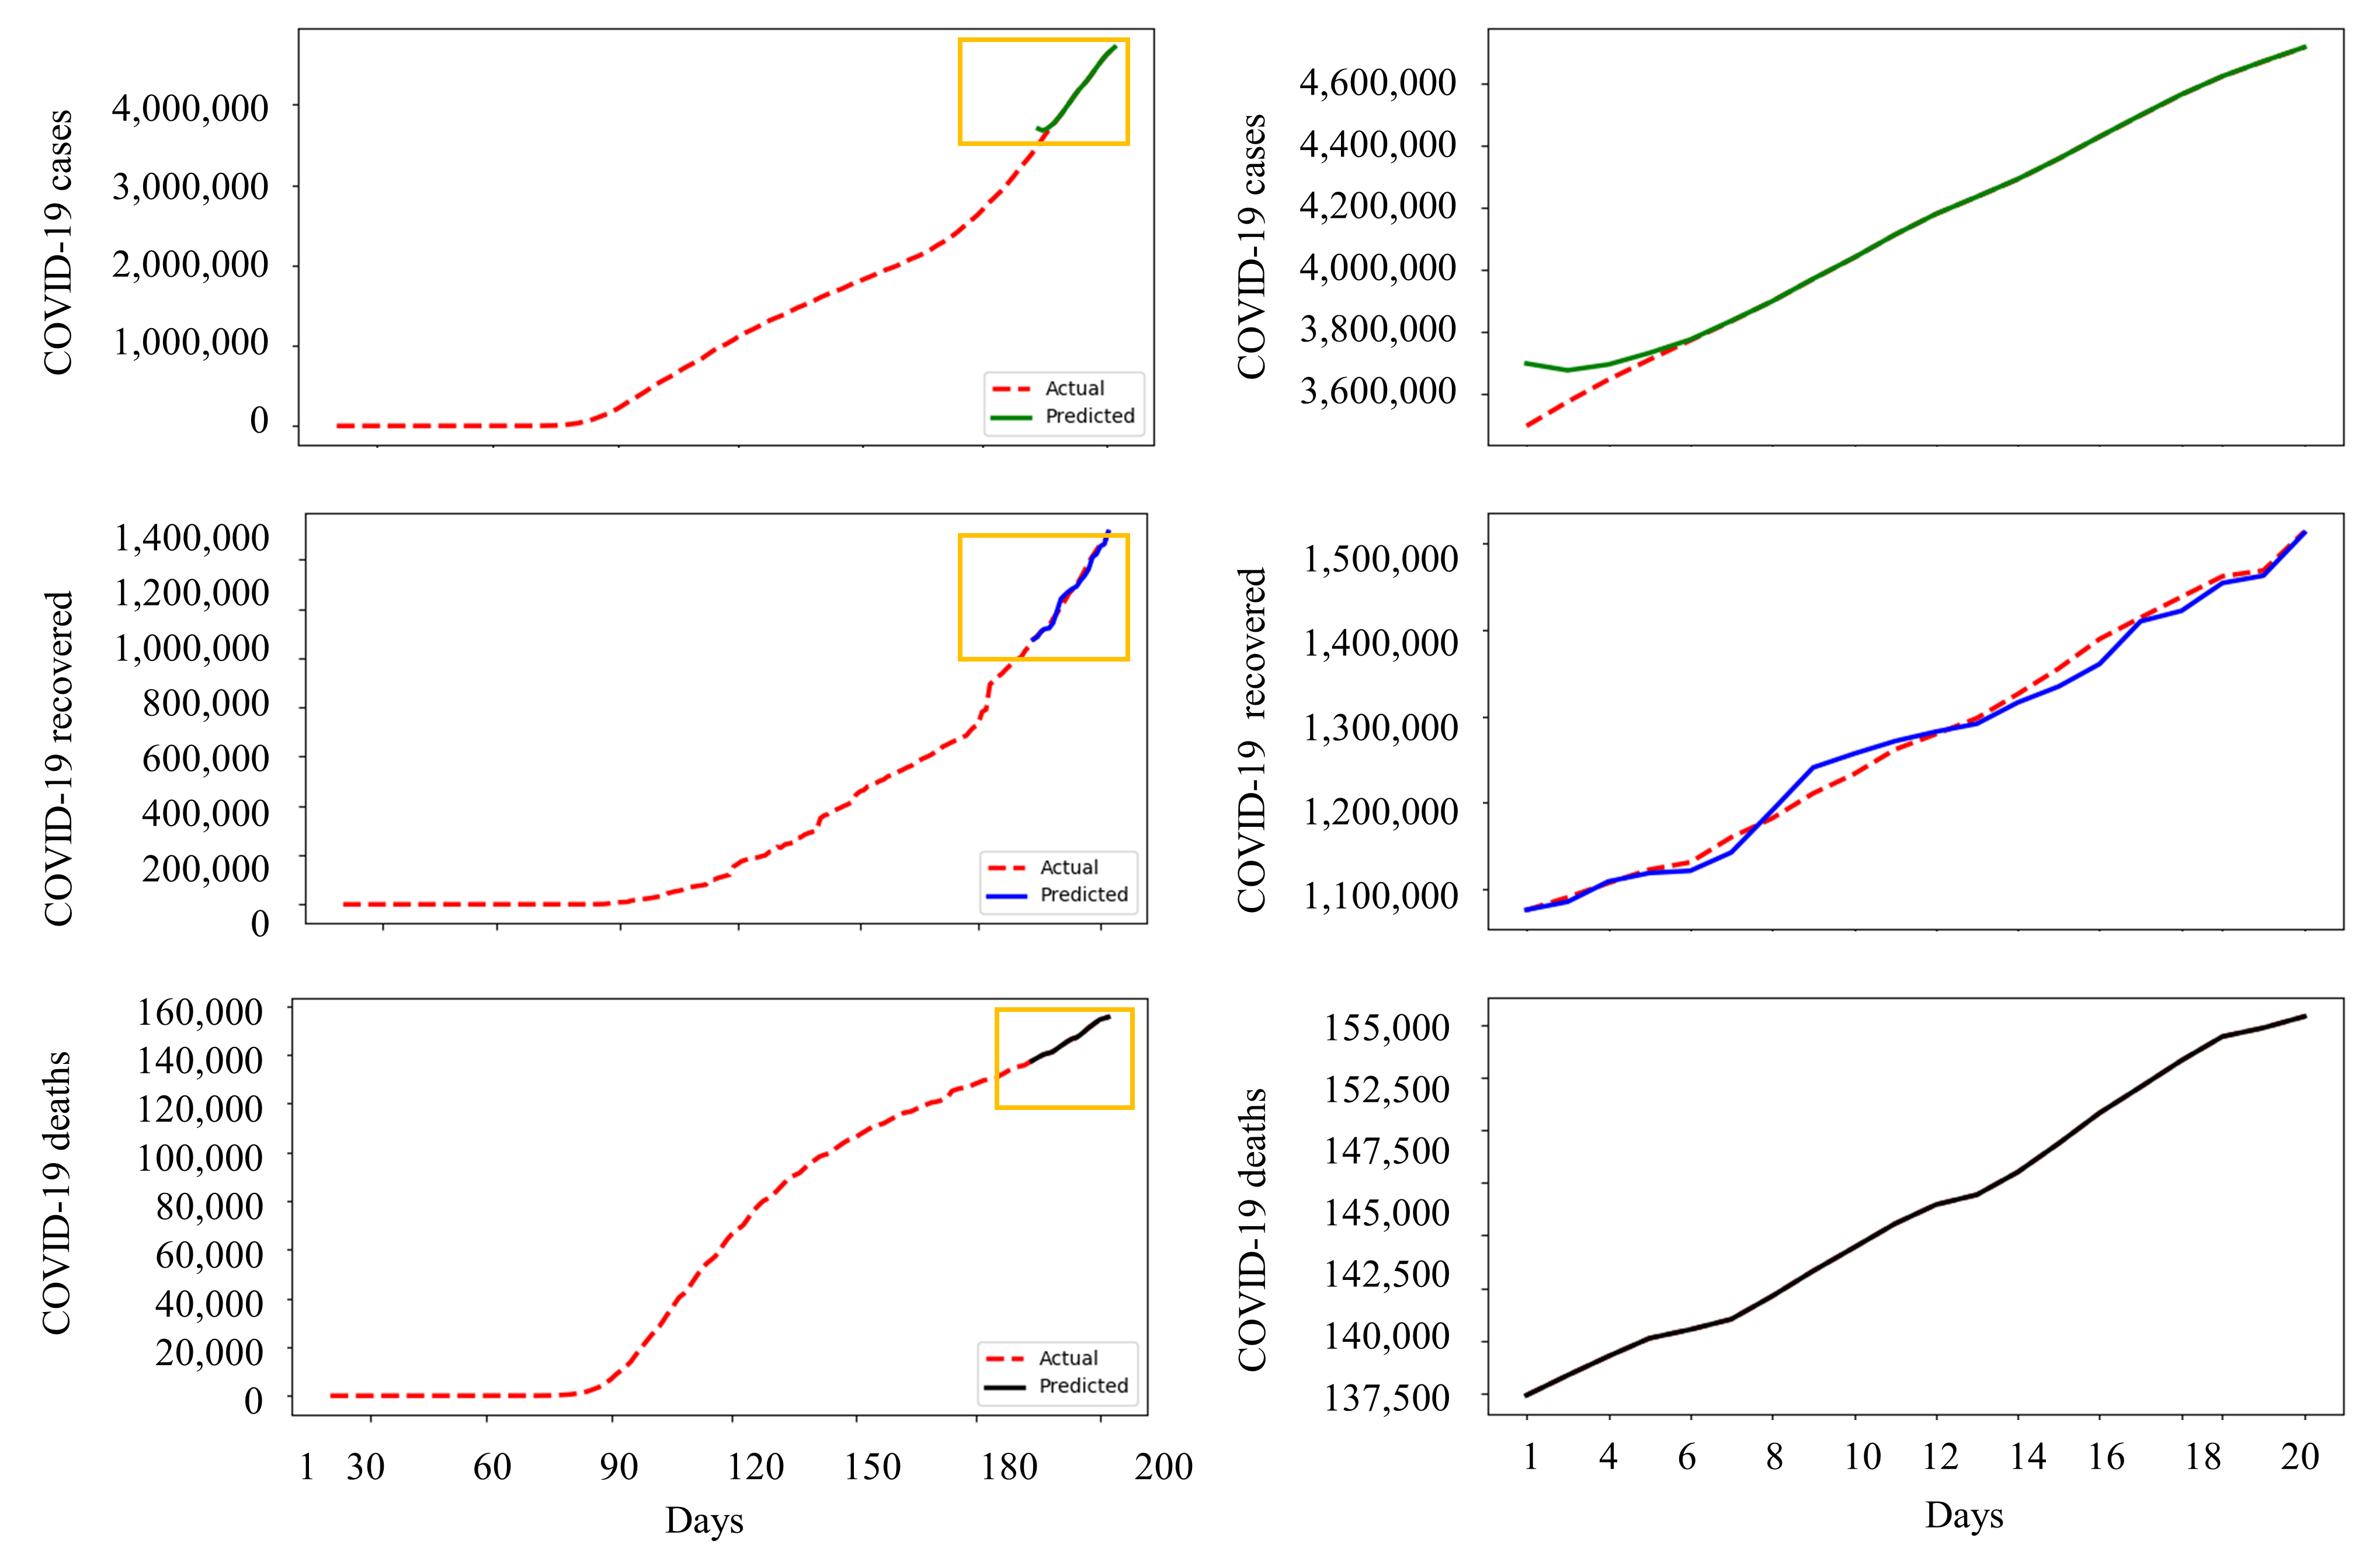
Here we discuss the prediction accuracy of the proposed method. The final fuzzy-rule based classification depended on death rate, case rate, and recovery rate. The suitable model chosen for each country was trained to predict these three values. We calculated root-mean-square error (RMSE) on the validation data to evaluate the methods. We compared using baseline algorithms such as linear regression, lasso linear regression, ridge regression. A single model was used to predict the values of all the countries. It is observed that such methods performed very poorly due to the small dataset. We also compared the method with some advanced neural networks such as a variation of LSTM combined with a fully convolutional network Karim et al. (2019), a variation of residual RNN Goel et al. (2017), and GRU Althelaya et al. (2018). It is also noted that very deep networks also failed to predict accurately using such a small dataset. Bayesian optimized shallow GRU performs closer to our method. The results are summarized in Table 3. Example results on USA trend prediction are shown in Figure 9 for numbers of active cases, recovered cases and deaths.
| RMSE | |||
|---|---|---|---|
| Method | COVID-19 Cases | Recovered | Death |
| Liner Regression | 2705.6 | 856.6 | 427.2 |
| Lasso Linear Regression | 1905.9 | 333.4 | 175.3 |
| Ridge Regression | 2307.5 | 614.2 | 213.3 |
| Elastic Net Hans (2011) | 2307.3 | 2105.9 | 300.2 |
| LSTM-FCNS Karim et al. (2019) | 2605.4 | 1305.3 | 269.5 |
| Recidual RNN Goel et al. (2017) | 2905.4 | 1109.5 | 242.3 |
| GRU Althelaya et al. (2018) | 2605.3 | 923.0 | 163.5 |
| GRU+Baysian | 1275.0 | 422.9 | 100.2 |
| Proposed | 1103.5 | 329.0 | 101.9 |
4.5 Risk Classification Accuracy
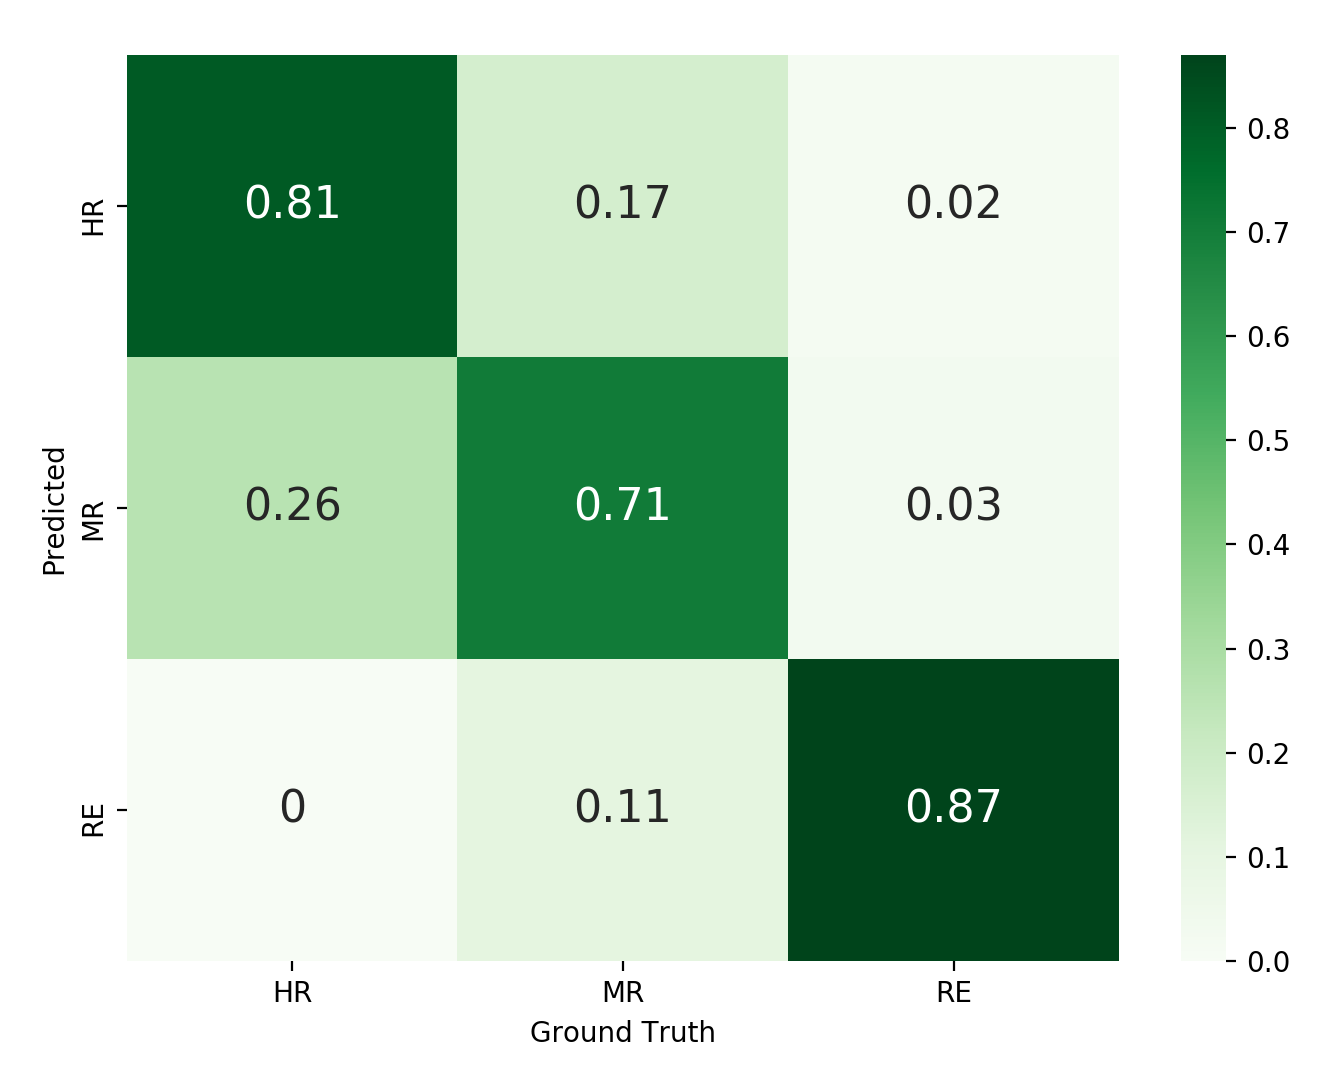
A fuzzy rule-based method was used to classify the risk of each country into three classes as discussed earlier (HR, MR, and RE). We predicted the risk classes for 25 days ahead. The accuracy was calculated in a state-of-the-art manner using a manual ground truth extracted from the trend data. Figure 10 shows the confusion matrix of the classification accuracy over 180 countries. It is observed that the method produced relatively lower accuracy of predicting MR class due to the incorrect trend rate prediction. We achieved 77.6% average accuracy over all the country-specific datasets. Table 4 lists a few countries that are classified as high risk, low, and in recovering stage based on the prediction of August 2020.
| High Risk (HR) | Low Risk (LR) | Recovering (RE) |
|---|---|---|
| India | Slovakia | Greenland |
| USA | Malta | Uruguay |
| Russia | Denmark | Zimbabwe |
| Brazil | Switzerland | Japan |
| Mexico | Germany | Norway |
4.6 Implementation and Computational Cost
The method was implemented using Python 3.6 combined in Anaconda environment. The Baysian optimization was implemented using open-source scikit-optimize library. The fitness function took the set of hyperparameters as the input and the validation loss was considered as faintness value. Minimum loss was considered as the most fitted model. Finally, the optimized properties of the network was used to design the LSTM using Tensorflow framework. The fuzzy rules were implemented using simple if-then rules. All the experiments were carried out in Intel(R) Xeon(R) Gold 6154 CPU with 128 GB of RAM and NVIDIA Quadro RTX 6000 GPU of capacity 24 GB. The method utilizes 72 computational hours for feature selection, network optimization, training, and evaluating the method.
4.7 The Effect of Weather
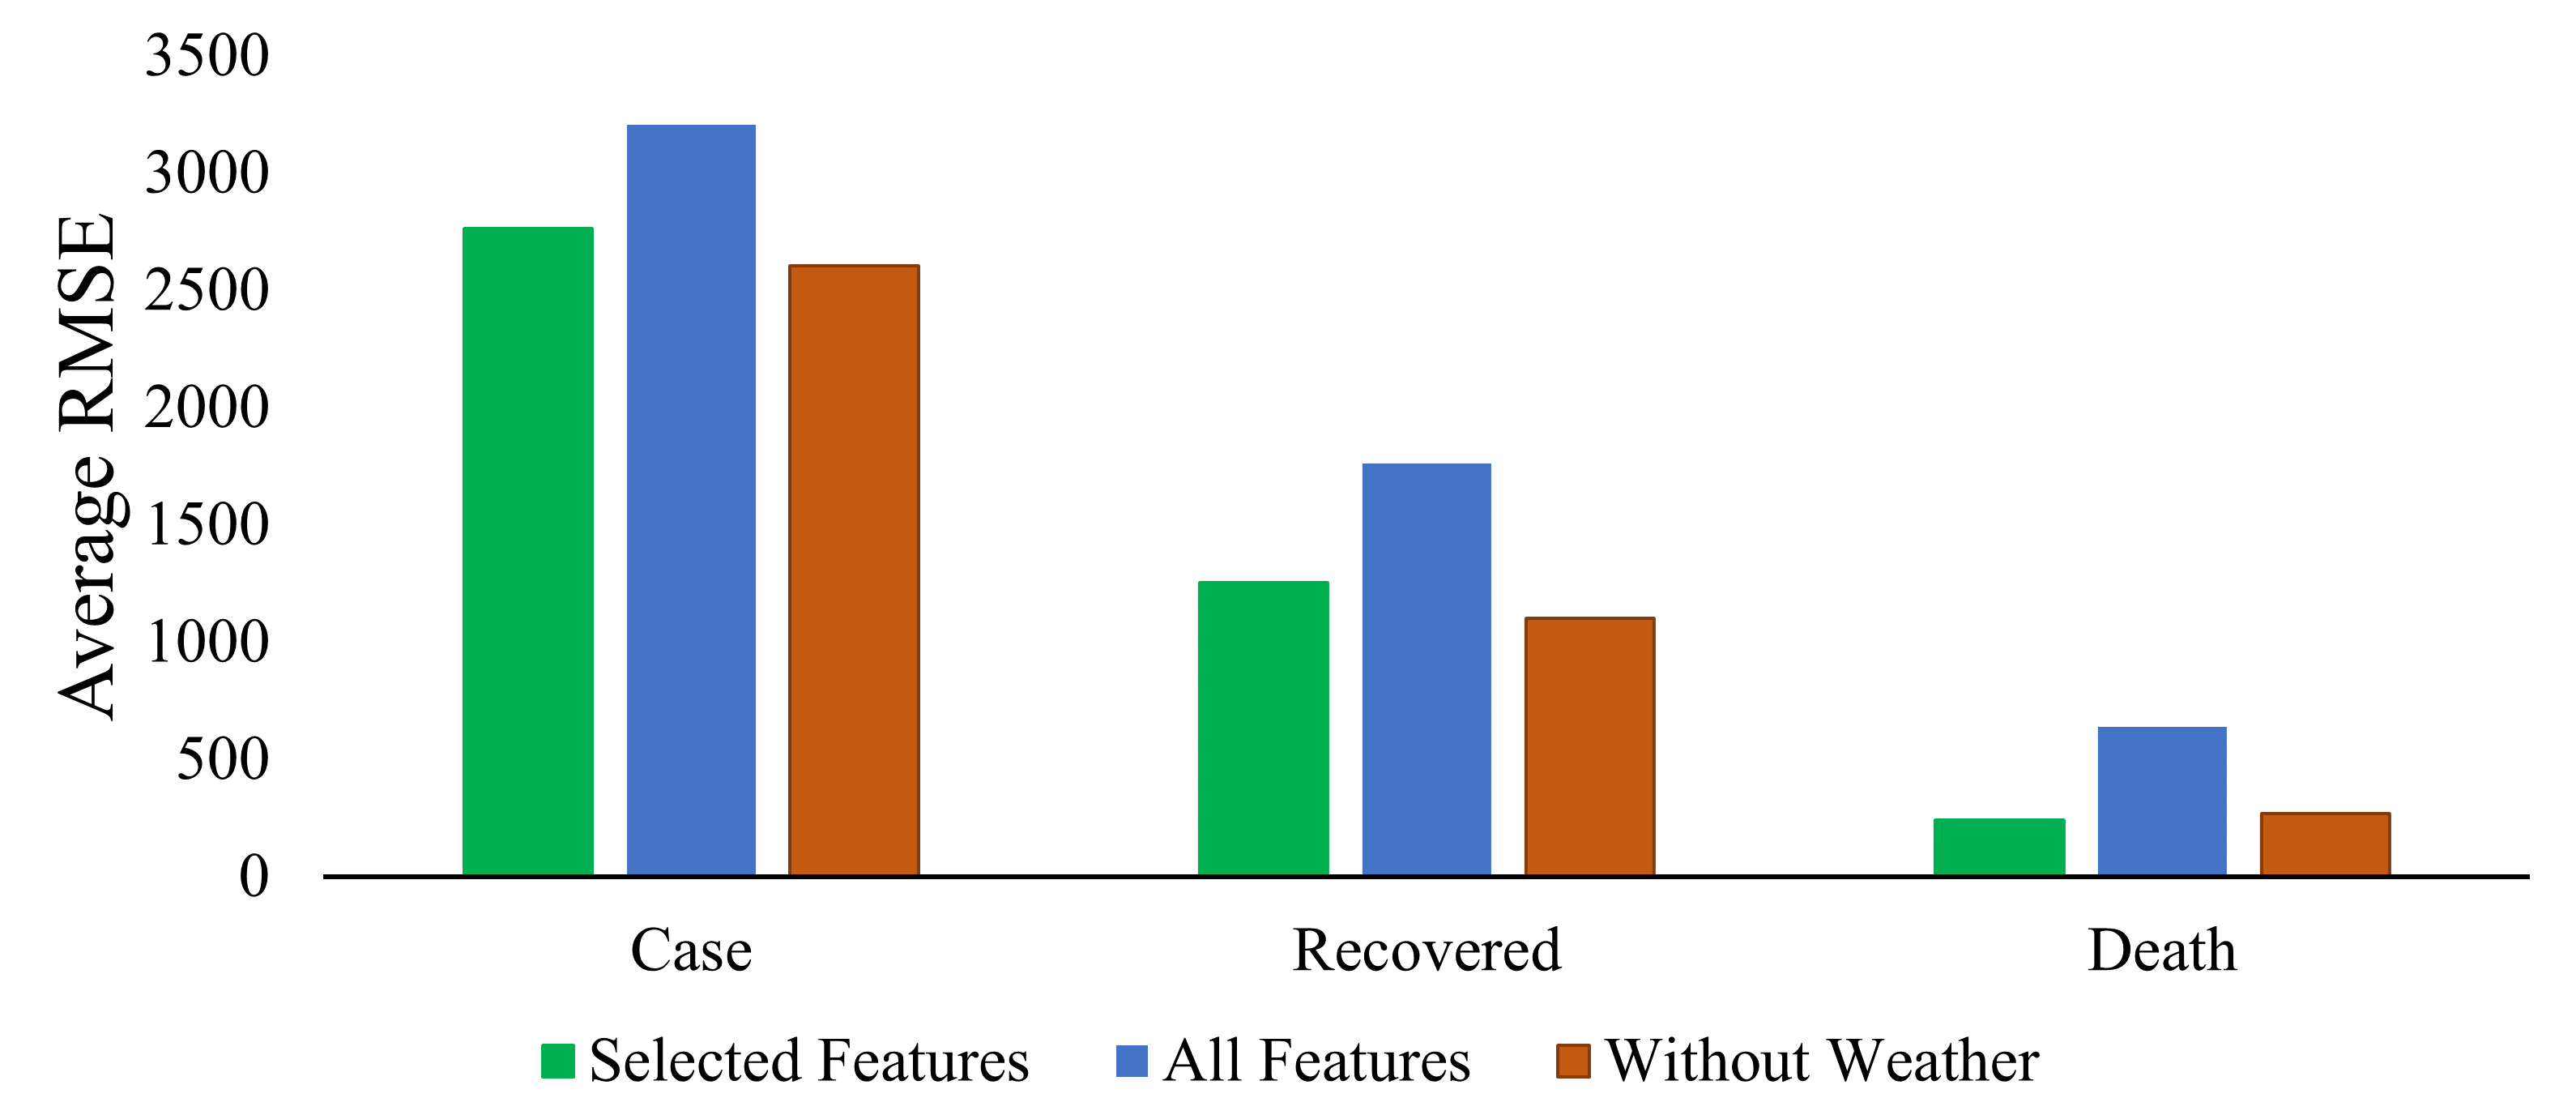
To understand the effect of weather, we experimented with combining weather data. The weather data consisted of UV, minimum temperature, maximum temperature, perception, ozone, dew, and humidity. We took the mean and standard deviation for each feature. First, we combined the trend data and weather data and apply the network optimization method. Next, the optimized network was used to train and validate the results. We have verified the effect by (A) extracting the Pearson correlation coefficient among variables, (B) feature selection using ordinary least squares (OLS) regression from the combined data and finding optimized neural network, and (C) using all the features in combined data and applying the proposed method. Figure 11A shows the average Pearson correlation of all the countries among different weather data and trend. It is observed that the trend data (active case) were not significantly correlated with the different weather parameters (see the last row, i.e., yellow border). Figure 11B shows the distribution of Pearson correlation over different countries. It is noted that the weather parameters were not correlated or varied significantly. It may be possible that all the features were not linked with the prediction variable. The data contained three main concerns for the risk categorization of a country. Number of cases (), number of deaths (), and number of recoveries (). The number of active cases () was calculated by . Features were selected by backward elimination method. We calculated the p-value of all features with using ordinary least squares (OLS) regression. We employ a threshold (0.4) for choosing features. Algorithm 1 demonstrates the method. Figure 11C shows the number of times the features are selected by the countries. It is observed that choosing a lower threshold (bottom row) almost discarded all the weather data by most of the countries. Figure 12 shows the average accuracy using the proposed OLS-based feature selection, combined weather features, and without weather data. It is noted that the prediction accuracy was almost similar with and without weather data.

5 Conclusions
In this paper, we have proposed a Bayesian optimization guided shallow LSTM for predicting the country-specific risk of the novel coronavirus (COVID-19). We have used the trend data to predict different parameters for the risk classification task. We also propose to use country-specific optimized network for accurate prediction and noted that this is suitable when we have a small and uncertain dataset. Combining the overall optimized LSTMs, we also note that a shallow network performs better compared to a deep neural networks. The method can be useful to predict the long-duration risk of an epidemic like COVID-19. We have also analyzed the prediction performance combining the weather data. We observed that the prediction model performs similarly without the weather data. We have shared the dataset used in this work at the project page (https://covid19prediction.github.io/)
In the future, we plan to explore a combination of different modalities of data such as flight, travelers, business, tourists, etc. The method can also be used to predict the economical effects of such epidemics.
conceptualization, R.P. and A.A.S.; methodology, R.P. and D.K.P.; software, R.P.; validation, S.K., D.K.P. and A.A.S.; formal analysis, investigation, resources, and data curation, R.P.; writing—original draft preparation, R.P.; writing—review and editing, A.A.S., D.K.P., and S.K.; visualization, A.A.S.; supervision, A.A.S. All authors have read and agreed to the published version of the manuscript.
There is no funding reported for the research. The resources and publication supports are provided by UiT The Arctic University of Norway.
The authors declare no conflict of interest.
References
References
- Wu et al. (2020) Wu, F.; Zhao, S.; Yu, B.; Chen, Y.M.; Wang, W.; Song, Z.G.; Hu, Y.; Tao, Z.W.; Tian, J.H.; Pei, Y.Y.; et al. A new coronavirus associated with human respiratory disease in China. Nature 2020, 579, 265–269.
- Cheong and Jones (2020) Cheong, K.H.; Jones, M.C. Introducing the 21st Century’s New Four Horsemen of the Coronapocalypse. BioEssays 2020, 2000063, doi:10.1002/bies.202000063.
- Akita et al. (2016) Akita, R.; Yoshihara, A.; Matsubara, T.; Uehara, K. Deep learning for stock prediction using numerical and textual information. In Proceedings of the 2016 IEEE/ACIS 15th International Conference on Computer and Information Science (ICIS), Okayama, Japan, 26–29 June 2016; pp. 1–6.
- Ali and Lee (2018) Ali, M.; Lee, Y. CRM Sales Prediction Using Continuous Time-Evolving Classification. In Proceedings of the Thirty-Second AAAI Conference on Artificial Intelligence, New Orleans, LA, USA, 2–7 February 2018.
- Xiao and Ai (2018) Xiao, F.; Ai, Q. Data-driven multi-hidden markov model-based power quality disturbance prediction that incorporates weather conditions. IEEE Trans. Power Syst. 2018, 34, 402–412.
- Lu et al. (2019) Lu, Y.; Wang, S.; Wang, J.; Zhou, G.; Zhang, Q.; Zhou, X.; Niu, B.; Chen, Q.; Chou, K.C. An epidemic avian influenza prediction model based on google trends. Lett. Org. Chem. 2019, 16, 303–310.
- Lin et al. (2020) Lin, A.X.; Ho, A.F.W.; Cheong, K.H.; Li, Z.; Cai, W.; Chee, M.L.; Ng, Y.Y.; Xiao, X.; Ong, M.E.H. Leveraging Machine Learning Techniques and Engineering of Multi-Nature Features for National Daily Regional Ambulance Demand Prediction. Int. J. Environ. Res. Public Health 2020, 17, 4179.
- Tosepu et al. (2020) Tosepu, R.; Gunawan, J.; Effendy, D.S.; Lestari, H.; Bahar, H.; Asfian, P. Correlation between weather and Covid-19 pandemic in Jakarta, Indonesia. Sci. Total. Environ. 2020, 725, 138436.
- Gupta et al. (2020) Gupta, S.; Raghuwanshi, G.S.; Chanda, A. Effect of weather on COVID-19 spread in the US: A prediction model for India in 2020. Sci. Total. Environ. 2020, 728, 138860.
- Şahin (2020) Şahin, M. Impact of weather on COVID-19 pandemic in Turkey. Sci. Total. Environ. 2020, 728, 138810.
- Jia et al. (2019) Jia, W.; Li, X.; Tan, K.; Xie, G. Predicting the outbreak of the hand-foot-mouth diseases in China using recurrent neural network. In Proceedings of the 2019 IEEE International Conference on Healthcare Informatics (ICHI), Xi’an, China, 10–13 June 2019; pp. 1–4.
- Hamer et al. (2020) Hamer, W.B.; Birr, T.; Verreet, J.A.; Duttmann, R.; Klink, H. Spatio-Temporal Prediction of the Epidemic Spread of Dangerous Pathogens Using Machine Learning Methods. ISPRS Int. J. Geo-Inf. 2020, 9, 44.
- Mezzatesta et al. (2019) Mezzatesta, S.; Torino, C.; De Meo, P.; Fiumara, G.; Vilasi, A. A machine learning-based approach for predicting the outbreak of cardiovascular diseases in patients on dialysis. Comput. Methods Programs Biomed. 2019, 177, 9–15.
- Jhuo et al. (2019) Jhuo, S.L.; Hsieh, M.T.; Weng, T.C.; Chen, M.J.; Yang, C.M.; Yeh, C.H. Trend Prediction of Influenza and the Associated Pneumonia in Taiwan Using Machine Learning. In Proceedings of the 2019 International Symposium on Intelligent Signal Processing and Communication Systems (ISPACS), Taipei, Taiwan, 3–6 December 2019; pp. 1–2.
- Kumar et al. (2020) Kumar, S.V.; Suresh, V.; Reddy, B.D.K.; Reddy, Y.J. Outbreak Predictions in Healthcare Domain using Machine learning & Artificial Intelligence. TEST Eng. Manag. 2020, 82, 11395–11400.
- Machado et al. (2019) Machado, G.; Vilalta, C.; Recamonde-Mendoza, M.; Corzo, C.; Torremorell, M.; Perez, A.; VanderWaal, K. Identifying outbreaks of Porcine Epidemic Diarrhea virus through animal movements and spatial neighborhoods. Sci. Rep. 2019, 9, 1–12.
- Philemon et al. (2019) Philemon, M.D.; Ismail, Z.; Dare, J. A Review of Epidemic Forecasting Using Artificial Neural Networks. Int. J. Epidemiol. Res. 2019, 6, 132–143.
- Abdulkareem et al. (2020) Abdulkareem, S.A.; Augustijn, E.W.; Filatova, T.; Musial, K.; Mustafa, Y.T. Risk perception and behavioral change during epidemics: Comparing models of individual and collective learning. PLoS ONE 2020, 15, e0226483.
- Forna et al. (2019) Forna, A.; Nouvellet, P.; Dorigatti, I.; Donnelly, C. Case fatality ratio estimates for the 2013–2016 West African Ebola epidemic: Application of Boosted Regression Trees for imputation. Int. J. Infect. Dis. 2019, 79, 128.
- Dallatomasina et al. (2015) Dallatomasina, S.; Crestani, R.; Sylvester Squire, J.; Declerk, H.; Caleo, G.M.; Wolz, A.; Stinson, K.; Patten, G.; Brechard, R.; Gbabai, O.B.M.; et al. Ebola outbreak in rural West Africa: Epidemiology, clinical features and outcomes. Trop. Med. Int. Health 2015, 20, 448–454.
- Plowright et al. (2019) Plowright, R.K.; Becker, D.J.; Crowley, D.E.; Washburne, A.D.; Huang, T.; Nameer, P.; Gurley, E.S.; Han, B.A. Prioritizing surveillance of Nipah virus in India. PLoS Negl. Trop. Dis. 2019, 13, e0007393.
- Seetah et al. (2020) Seetah, K.; LaBeaud, D.; Kumm, J.; Grossi-Soyster, E.; Anangwe, A.; Barry, M. Archaeology and contemporary emerging zoonosis: A framework for predicting future Rift Valley fever virus outbreaks. Int. J. Osteoarchaeol. 2020, doi:10.1002/oa.2862.
- Rao and Vazquez (2020) Rao, A.S.S.; Vazquez, J.A. Identification of COVID-19 Can be Quicker through Artificial Intelligence framework using a Mobile Phone-Based Survey in the Populations when Cities/Towns Are Under Quarantine. Infect. Control. Hosp. Epidemiol. 2020, 41, 826–830.
- Yan et al. (2020) Yan, L.; Zhang, H.T.; Xiao, Y.; Wang, M.; Sun, C.; Liang, J.; Li, S.; Zhang, M.; Guo, Y.; Xiao, Y.; et al. Prediction of criticality in patients with severe Covid-19 infection using three clinical features: A machine learning-based prognostic model with clinical data in Wuhan. medRxiv 2020, doi:10.1101/2020.02.27.20028027.
- Peng et al. (2020) Peng, L.; Yang, W.; Zhang, D.; Zhuge, C.; Hong, L. Epidemic analysis of COVID-19 in China by dynamical modeling. arXiv 2020, arXiv:2002.06563.
- Zhao et al. (2020) Zhao, S.; Lin, Q.; Ran, J.; Musa, S.S.; Yang, G.; Wang, W.; Lou, Y.; Gao, D.; Yang, L.; He, D.; et al. Preliminary estimation of the basic reproduction number of novel coronavirus (2019-nCoV) in China, from 2019 to 2020: A data-driven analysis in the early phase of the outbreak. Int. J. Infect. Dis. 2020, 92, 214–217.
- Chen et al. (2020) Chen, B.; Shi, M.; Ni, X.; Ruan, L.; Jiang, H.; Yao, H.; Wang, M.; Song, Z.; Zhou, Q.; Ge, T. Data Visualization Analysis and Simulation Prediction for COVID-19. arXiv 2020, arXiv:2002.07096.
- Li et al. (2020) Li, M.; Chen, J.; Deng, Y. Scaling features in the spreading of COVID-19. arXiv 2020, arXiv:2002.09199.
- Hilton and Keeling (2020) Hilton, J.; Keeling, M.J. Estimation of country-level basic reproductive ratios for novel Coronavirus (COVID-19) using synthetic contact matrices. medRxiv 2020, doi:2020.02.26.20028167 .
- Kastner et al. (2020) Kastner, J.; Wei, H.; Samet, H. Viewing the Progression of the Novel Corona Virus (COVID-19) with NewsStand. arXiv 2020, arXiv:2003.00107.
- Jia et al. (2020) Jia, L.; Li, K.; Jiang, Y.; Guo, X. Prediction and analysis of Coronavirus Disease 2019. arXiv 2020, arXiv:2003.05447.
- Zhao et al. (2020) Zhao, X.; Liu, X.; Li, X. Tracking the spread of novel coronavirus (2019-nCoV) based on big data. medRxiv 2020, doi:10.1101/2020.02.07.20021196 .
- Zeng et al. (2020) Zeng, T.; Zhang, Y.; Li, Z.; Liu, X.; Qiu, B. Predictions of 2019-ncov transmission ending via comprehensive methods. arXiv 2020, arXiv:2002.04945.
- Buizza (2020) Buizza, R. Probabilistic prediction of COVID-19 infections for China and Italy, using an ensemble of stochastically-perturbed logistic curves. arXiv 2020, arXiv:2003.06418.
- Fong et al. (2020) Fong, S.J.; Li, G.; Dey, N.; Crespo, R.G.; Herrera-Viedma, E. Finding an accurate early forecasting model from small dataset: A case of 2019-ncov novel coronavirus outbreak. Int. J. Interact. Multimed. Artif. Intell. 2020, 6, 51–61.
- Santosh (2020) Santosh, K. AI-Driven Tools for Coronavirus Outbreak: Need of Active Learning and Cross-Population Train/Test Models on Multitudinal/Multimodal Data. J. Med Syst. 2020, 44, 1–5.
- Al-qaness et al. (2020) Al-qaness, M.A.; Ewees, A.A.; Fan, H.; Abd El Aziz, M. Optimization Method for Forecasting Confirmed Cases of COVID-19 in China. J. Clin. Med. 2020, 9, 674.
- Li et al. (2020) Li, Y.; Liang, M.; Yin, X.; Liu, X.; Hao, M.; Hu, Z.; Wang, Y.; Jin, L. COVID-19 Epidemic Outside China: 34 Founders and Exponential Growth. medRxiv 2020, doi:10.1101/2020.03.01.20029819 .
- Araujo and Naimi (2020) Araujo, M.B.; Naimi, B. Spread of SARS-CoV-2 Coronavirus likely to be constrained by climate. medRxiv 2020, doi:10.1101/2020.03.12.20034728.
- Dong and Sun (2019) Dong, M.; Sun, J. Partial Discharge Detection on Aerial Covered Conductors Using Time-Series Decomposition and Long Short-term Memory Network. arXiv 2020, arXiv:1907.03378.
- Moews et al. (2019) Moews, B.; Herrmann, J.M.; Ibikunle, G. Lagged correlation-based deep learning for directional trend change prediction in financial time series. Expert Syst. Appl. 2019, 120, 197–206.
- Thomas (2019) Thomas, K. Time Series Prediction for Stock Price and Opioid Incident Location. Ph.D. Thesis, Arizona State University: Tempe, AZ, USA, 2019.
- Lorenzo and Olivas (2019) Lorenzo, A.; Olivas, J.A. Some Considerations on the Use of AI Techniques for Prediction and Forecasting in Political Elections and Stock Market. In Proceedings of the International Conference on Artificial Intelligence (ICAI), Jinan, China, 30 July–2 August 2019; Budapest, Hungary, 2019; pp. 403–407.
- Bandara et al. (2019) Bandara, K.; Shi, P.; Bergmeir, C.; Hewamalage, H.; Tran, Q.; Seaman, B. Sales demand forecast in e-commerce using a long short-term memory neural network methodology. In Proceedings of the International Conference on Neural Information Processing, Sydney, NSW, Australia, 12–15 December 2019; pp. 462–474.
- Cui et al. (2019) Cui, Y.; Hou, H.; Sheng, G.; Jiang, X.; He, M.; Jiang, G.; Chi, J.; Tong, J. A prediction method for power transformer state parameters based on feature attention mechanism. In Proceedings of the 2019 IEEE PES Asia-Pacific Power and Energy Engineering Conference (APPEEC), Macao, China, 1–4 December 2019; pp. 1–5.
- Oh et al. (2018) Oh, S.L.; Ng, E.Y.; San Tan, R.; Acharya, U.R. Automated diagnosis of arrhythmia using combination of CNN and LSTM techniques with variable length heart beats. Comput. Biol. Med. 2018, 102, 278–287.
- Ho et al. (2019) Ho, A.F.W.; To, B.Z.Y.S.; Koh, J.M.; Cheong, K.H. Forecasting Hospital Emergency Department Patient Volume Using Internet Search Data. IEEE Access 2019, 7, 93387–93395.
- Jiménez et al. (2020) Jiménez, F.; Palma, J.; Sánchez, G.; Marín, D.; Palacios, F.; López, L. Feature Selection based Multivariate Time Series Forecasting: An Application to Antibiotic Resistance Outbreaks Prediction. Artif. Intell. Med. 2020, 104, 101818.
- Tapak et al. (2019) Tapak, L.; Hamidi, O.; Fathian, M.; Karami, M. Comparative evaluation of time series models for predicting influenza outbreaks: Application of influenza-like illness data from sentinel sites of healthcare centers in Iran. BMC Res. Notes 2019, 12, 353.
- Su et al. (2019) Su, K.; Xu, L.; Li, G.; Ruan, X.; Li, X.; Deng, P.; Li, X.; Li, Q.; Chen, X.; Xiong, Y.; et al. Forecasting influenza activity using self-adaptive AI model and multi-source data in Chongqing, China. EBioMedicine 2019, 47, 284–292.
- Ochodek et al. (2020) Ochodek, M.; Kopczyńska, S.; Staron, M. Deep learning model for end-to-end approximation of COSMIC functional size based on use-case names. Inf. Softw. Technol. 2020, 123, 106310.
- Hu et al. (2020) Hu, F.; Zhu, Y.; Liu, J.; Li, L. An efficient Long Short-Term Memory model based on Laplacian Eigenmap in artificial neural networks. Appl. Soft Comput. 2020, 91, 106218.
- Wen et al. (2019) Wen, S.; Wang, Y.; Tang, Y.; Xu, Y.; Li, P.; Zhao, T. Real-Time Identification of Power Fluctuations Based on LSTM Recurrent Neural Network: A Case Study on Singapore Power System. IEEE Trans. Ind. Inform. 2019, 15, 5266–5275.
- Yuan et al. (2019) Yuan, J.; Wang, H.; Lin, C.; Liu, D.; Yu, D. A novel GRU-RNN network model for dynamic path planning of mobile robot. IEEE Access 2019, 7, 15140–15151.
- Karim et al. (2019) Karim, F.; Majumdar, S.; Darabi, H.; Harford, S. Multivariate lstm-fcns for time series classification. Neural Netw. 2019, 116, 237–245.
- Goel et al. (2017) Goel, H.; Melnyk, I.; Banerjee, A. R2N2: Residual recurrent neural networks for multivariate time series forecasting. arXiv 2017, arXiv:1709.03159.
- Althelaya et al. (2018) Althelaya, K.A.; El-Alfy, E.S.M.; Mohammed, S. Stock market forecast using multivariate analysis with bidirectional and stacked (LSTM, GRU). In Proceedings of the 2018 21st Saudi Computer Society National Computer Conference (NCC), Riyadh, Saudi Arabia, 25–26 April 2018; pp. 1–7.
- Hans (2011) Hans, C. Elastic net regression modeling with the orthant normal prior. J. Am. Stat. Assoc. 2011, 106, 1383–1393.