1\Yearpublication2020\Yearsubmission2019\Month0\Volume999\Issue0\DOIasna.202000000
BG-1784 Sofia, Bulgaria
Flickering of the jet-ejecting symbiotic star MWC 560
Abstract
We analyse optical photometric data of short term variability (flickering) of the accreting white dwarf in the jet-ejecting symbiotic star MWC 560. The observations are obtained in 17 nights during the period November 2011 - October 2019. The colour-magnitude diagram shows that the hot component of the system becomes redder as it gets brighter. For the flickering source we find that it has colour , temperature in the range K, and radius . We find a strong correlation (correlation coefficient 0.76, significance ) between B band magnitude and the average radius of the flickering source – as the brightness of the system increases the size of the flickering source also increases. The estimated temperature is similar to that of the bright spot of cataclysmic variables. In 2019 the flickering is missing, and the B-V colour of the hot component becomes bluer.
keywords:
accretion, accretion discs – (stars:) novae, cataclysmic variables – binaries: symbiotic – stars: individual: MWC 5601 Introduction
The symbiotic stars are wide binaries with long orbital periods (from 100 days to 100 years) in which material is transferred from an evolved red giant star to an white dwarf or a neutron star (Mikołajewska 2012). The symbiotic star MWC 560 (V694 Mon) was identified as an emission line object at the Mount Wilson observatory spectroscopic surveys (Merrill & Burwell 1943). The spectroscopic observations of MWC 560 in 1984 showed that its an extraordinary symbiotic star with absorption extending out to km s-1 at H and higher members of the Balmer series (Bond et al. 1984). In early 1990 the outflow velocities reached 6000 – 7000 km s-1 (Tomov et al. 1990; Szkody, Mateo & Schmeer 1990). Tomov et al. (1990) proposed that the observed absorptions are caused by a collimated outflow along the line of sight – a low-energy analog of the jets of the microquasar SS 433. The outflow may be a highly-collimated baryon-loaded jet (Schmid et al. 2001) or a wind from the polar regions (Lucy, Knigge & Sokoloski 2018). MWC 560 is considered to be a non-relativistic analog of the quasars not only because of its jets, but also to the resemblance of its emission lines to that of the low-redshift quasars (Zamanov & Marziani 2002) and the absorption lines to that of the broad absorption lines quasars (Lucy et al. 2018). The orbital period of the binary is thought to be d (Gromadzki et al. 2007) although recently Munari et al. (2016) supposed that it could be considerably shorter, d.
Systematic searches for flickering variability in symbiotic stars and related objects (Dobrzycka, Kenyon & Milone 1996; Sokoloski, Bildsten & Ho 2001; Gromadzki et al. 2006; Angeloni et al. 2013) have shown that optical flickering is a rarely detectable phenomenon in symbiotic stars. Among more than 200 symbiotic stars known, only in 11 objects flickering activity is visible. A flickering variability of MWC 560 of up to 0.2 mag on timescale of a few minutes was first reported by Bond et al. (1984). The amplitude is in the range 0.1 – 0.7 mag and the detected quasi-periods are from 11 to 160 min (Tomov et al. 1996). The intra-night variability was a persistent feature till 2018, when the variability on time-scale of minutes became undetectable (Goranskij et al. 2018).
Here, we report quasi-simultaneous observations of the flickering variability of the jet-ejecting symbiotic star MWC 560 (most of them in the two optical bands – B and V) and analyze the colour changes, temperature and radius of the flickering source and their response to the brightness variations.
2 Observations and data analysis
The observations were performed with four telescopes equipped with CCD cameras:
-
•
the 2.0 m telescope of the National Astronomical Observatory (NAO) Rozhen, Bulgaria (Bonev & Dimitrov 2010)
-
•
the 50/70 cm Schmidt telescope of NAO Rozhen
-
•
the 60 cm telescope of NAO Rozhen
-
•
the 60 cm telescope of the Belogradchik Observatory, Bulgaria (Strigachev & Bachev 2011)
The data reduction was done with IRAF (Tody 1993) following standard recipes for processing of CCD images and aperture photometry. A few comparison stars from the list of Henden & Munari (2006) and APASS DR9 have been used. The typical photometric errors are 0.007 mag in U-band, 0.005 mag in B-band, and 0.004 mag in V-band.
Three examples of our data are given on Fig. 1. On the left panel (20110210) are plotted UBVRI data. The amplitude in U-band is 0.47 mag, in B-band - 0.34 mag, in V-band - 0.32 mag, in R-band - 0.23 mag, in I-band – 0.07 mag. The amplitude of the flickering is decreasing to longer wavelengths, mainly due to the increasing contribution of the red giant, which is the dominating source in infrared bands. In the middle panel (20170222), the light curves of MWC 560 in B- and V-bands are plotted together with the calculated B-V colour. The right panel are UBV data obtained on 20191025 when the flickering is missing. If it exists at all its amplitude in UBV is mag.


| Date | telescope | bands | UT start - UT-end | detection | |
|---|---|---|---|---|---|
| yyyymmdd | |||||
| 20091114 | 2.0 Roz | U | 23:59 – 01:27 | yes | |
| 50/70 Sch | B | 00:21 – 01:32 | yes | ||
| 60 Bel | V | 00:22 – 01:27 | yes | ||
| 60 Roz | R | 00:14 – 01:34 | yes | ||
| 20100111 | 2.0 Roz | U, V | 23:31 – 01:04 | yes | |
| 50/70 Sch | B | 23:28 – 01:10 | yes | ||
| 60 Roz | R, I | 23:13 – 01:01 | yes | ||
| 20100315 | 60 Roz | V, I | 18:00 – 19:15 | yes | |
| 20100317 | 60 Roz | V, I | 18:08 – 19:14 | yes | |
| 20101229 | 2.0 Roz | U | 22:55 – 01:28 | yes | |
| 60 Bel | V, R | 22:10 – 01:30 | yes | ||
| 60 Roz | B, I | 21:53 – 01:31 | yes | ||
| 20110210 | 2.0 Roz | U | 19:18 – 22:43 | yes | |
| 60 Roz | B, I | 19:07 – 22:45 | yes | ||
| 60 Bel | V, R | 19:20 – 22:41 | yes | ||
| 20110211 | 60 Roz | U, B | 19:35 – 22:59 | yes | |
| 60 Bel | V, R, I | 19:34 – 23:01 | yes | ||
| 20110212 | 60 Roz | U, B, V, R, I | 20:25 – 22:47 | yes | |
| 20120321 | 60 Bel | B, V, R | 18:27 – 20:20 | yes | |
| 20120323 | 60 Bel | B, V, R, I | 18:06 – 20:15 | yes | |
| 20130303 | 60 Bel | B, V, R, I | 19:35 – 21:10 | yes | |
| 20130305 | 60 Bel | B, V, R, I | 18:37 – 20:31 | yes | |
| 20131129 | 60 Roz | B, V, R, I | 00:26 – 03:31 | yes | |
| 20151118 | 60 Bel | B, V, R, I | 02:10 – 04:19 | yes | |
| 20160402 | 60 Bel | B, V | 18:12 – 19:25 | yes | |
| 20160405 | 50/70 Sch | B | 17:40 – 19:11 | yes | |
| 20170222 | 60 Bel | B, V | 22:37 – 00:09 | yes | |
| 20180124 | 50/70 Sch | B, V, R, I | 22:18 – 22:50 | yes | |
| 20191022 | 50/70 Sch | B, V | 00:17 – 03:49 | no | |
| 20191025 | 50/70 Sch | U, B, V | 00:59 – 03:19 | no | |
| 20200201 | 50/70 Sch | B | 19:50 – 21:15 | no |
| date | mean(B) | min(B) | max(B) | mean(V) | min(V) | max(V) | ||
|---|---|---|---|---|---|---|---|---|
| YYYYMMDD | [mag] | [mag] | [mag] | [mag] | [mag] | [mag] | ||
| 20091114 | 39 | 11.8557 | 11.799 | 11.921 | 11.2766 | 11.240 | 11.329 | |
| 20100111 | 52 | 11.5749 | 11.410 | 11.715 | 11.0412 | 10.894 | 11.163 | |
| 20101229 | 360 | 10.1520 | 10.040 | 10.245 | 9.6801 | 9.587 | 9.778 | |
| 20110210 | 477 | 10.3856 | 10.224 | 10.580 | 9.9110 | 9.747 | 10.108 | |
| 20110211 | 186 | 10.4426 | 10.331 | 10.568 | 9.9949 | 9.899 | 10.116 | |
| 20110212 | 143 | 10.3205 | 10.205 | 10.460 | 9.8805 | 9.776 | 10.018 | |
| 20120321 | 70 | 10.6389 | 10.496 | 10.752 | 10.1055 | 9.9440 | 10.205 | |
| 20120323 | 93 | 10.9392 | 10.776 | 11.079 | 10.4181 | 10.227 | 10.577 | |
| 20130303 | 100 | 10.8227 | 10.755 | 10.888 | 10.3261 | 10.247 | 10.394 | |
| 20130305 | 79 | 11.0507 | 10.880 | 11.191 | 10.5484 | 10.385 | 10.662 | |
| 20131129 | 75 | 10.9839 | 10.764 | 11.134 | 10.5579 | 10.331 | 10.696 | |
| 20151118 | 87 | 10.1774 | 10.032 | 10.420 | 9.6246 | 9.481 | 9.813 | |
| 20160402 | 88 | 9.3861 | 9.202 | 9.535 | 8.7897 | 8.605 | 8.953 | |
| 20170222 | 110 | 10.1601 | 10.055 | 10.276 | 9.6060 | 9.508 | 9.725 | |
| 20180124 | 27 | 10.2431 | 10.134 | 10.299 | 9.8144 | 9.716 | 9.868 | |
| 20191022 | 207 | 9.2703 | 9.254 | 9.293 | 8.9272 | 8.909 | 8.950 | |
| 20191025 | 114 | 9.2885 | 9.273 | 9.311 | 8.9387 | 8.917 | 8.967 |


We have 17 nights with simultaneous observations in B and V bands
during the period July 2008 - October 2019.
The colour is calculated for 2307 points in total.
During our observations the brightness of MWC 560 was:
,
,
,
with mean B = 10.28, mean V = 9.81, mean B-V = 0.47.
When the flickering exists, its
peak-to-peak amplitude in B band is in the range 0.13 - 0.39 mag.
3 Parameters of the system
GAIA DR2 (Gaia Collaboration et al. 2018) gives for MWC560 parallax , which corresponds to a distance d=2830 pc. Schmid et al. (2001) derived distance kpc, which agrees with the GAIA value.
Schmid et al. (2001) estimated interstellar extinction E(B-V)=0.15 mag from 2200 Å feature and for the mass donor spectral type M5.5 III. Slightly different values are given earlier by Zhekov et al. (1996) – M4.5 III and E(B-V)=0.23 mag. Most likely the extinction is in the range in the light of the NaD absorption and dust maps (Lucy et al. 2020). Houdashelt, Wyse & Gilmore (2001) give for M5.5 III giant colours B-V=1.55 and V-I=2.7.
For the red giant, Zhekov et al. (1996) estimated mag, which is in agreement with the long term light curve of MWC 560 (Doroshenko, Goranskij & Efimov 1993). With the above colour and extinction, this give for the red giant mag. Using J and K-band data from 2MASS All Sky Catalog (J=6.452, K=5.069) and the extinction law from Savage & Mathis (1979), we obtain AJ = 0.13 and AK = 0.06. Koornneef (1983) gives an intristic colours V-K = 6.7 and V-J = 5.43 for an M5.5 III star. Using these parameters, we derive mV = 12.23 and mV = 12.19 using J and K-band respectively.
Hereafter, we assume for the red giant component of MWC 560, and . These magnitudes are used in Sect. 4 to estimate the colours of the hot component.
4 Variability in B and V bands
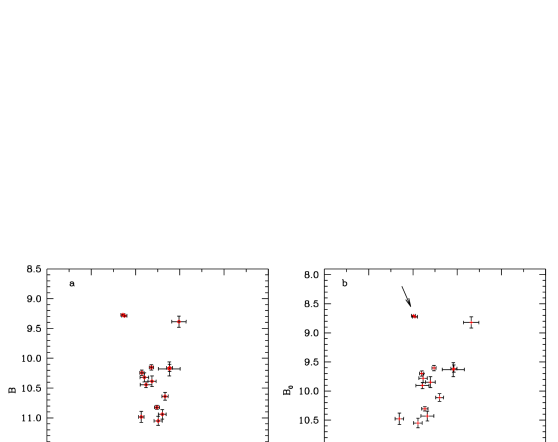
In Fig.4 we plot B versus V band magnitude. In the left panel (Fig. 4a) are the observed magnitudes of MWC 560. In the right panel (Fig. 4b) are the de-reddened magnitudes of the hot component (e.g. the red giant contribution is subtracted using the magnitudes given in Sect. 3).
In Fig.4 we plot colour-magnitude diagrams. The colour-magnitude diagram is quite different from that of the cataclysmic variable AE Aqr (see Fig.3 in Zamanov et al. 2017) but it is similar to that of the recurrent nova RS Oph (see Fig. 3,4,5 in Zamanov et al. 2018). In the case of AE Aqr all the data occupy a well defined strip. Here such a strip is not visible, although the observations from each night are placed on a specific position on the diagram. This indicates that the flickering behaviour of MWC 560 has a similar mechanism to that of RS Oph, but different than that of AE Aqr.
In Fig.4 we plot the calculated mean values for each night (one night – one point). The error bars correspond to the standard deviation of the run. The left panel is the observed, the right panel is the hot component (red giant contribution subtracted). On Fig.4a, it can be seen that the colour of the system is in the range , without clear tendency to become redder or bluer when the brightness changes.
However, there is a correlation between the mean colour and magnitude of the hot component. When we use the 15 points, when the flickering exists we calculate Pearson correlation coefficient 0.91, Spearman’s (rho) rank correlation 0.88, the statistical significance . This indicates that the hot component becomes redder as it gets brighter.
When we use all 17 points including the two nights without flickering this correlation weakens: Pearson correlation coefficient 0.58, Spearman’s (rho) rank correlation 0.45 . This indicates that the missing flickering is connected with violation of colour - brightness relation of the accretion disc and/or probably changes in its structure/geometry.
5 Flickering light source
Bruch (1992) proposed that the light curve of a white dwarf with flickering can be separated into two parts – constant light and variable (flickering) source. Following his recipe, we calculate the flux of the flickering light source as , where is the average flux during the run and is the minimum flux during the run (corrected for the typical error of the observations). An expansion of the method is proposed by Nelson et al. (2011). They suggest to use the , where is the maximum flux during the run. In fact, the method of Bruch (1992) evaluates the average brightness of the flickering source, while that of Nelson et al. (2011) – its maximal brightness. and have been calculated for each band, using the values given in Table 2 and the calibration for a zero magnitude star erg cm-2 s-1 Å-1, Å, erg cm-2 s-1 Å-1 and Å as given in Spanish virtual observatory Filter Profile Service (Rodrigo et al. 2018, see also Bessell 1979).
It is worth noting that while the calculated colours of the hot component depend on the assumed red giant brightness, the parameters of the flickering source are independent on the red giant parameters.
Using method of Bruch (1992), we find that in B band the flickering light source contributes about 12% of the average flux of the system, with . In V band its average contribution is 11%, with .
Using method of Nelson et al. (2011), we find that in B band the flickering light source contributes about 22% of the maximal flux of the system, with . In V band its is about 21%, with .
From the amplitude - flux relation (rms-flux relation) e.g. Scaringi et al. (2015), we expect that the luminosity of the flickering source will increase as the brightness increases. However, it is not a priori clear which parameter – temperature or radius (or both), increases.
In Table 3 are given the dereddened colour of the flickering source and , T1 and T2 - temperature of the flickering source, R1 and R2 - radius the flickering source.
In the calculations we assume that the flickering source is continuum dominated. In principle, it is possible that the flickering involves both continuum and lines. However, the search for rapid spectral variability related to the flickering in MWC 560 shows that there are no changes higher than a few per cent level in the optical lines in spite of 0.35 mag flickering in B band (Tomov et al. 1995). Our simultaneous 5-colour photometry shows that the flickering source is well approximated with black body in the UBVRI bands (Zamanov et al. 2011b). The observations of the near-UV flickering, show that near-UV spectral morphology remained constant so the near-UV flickering must have originate in a variable continuum (Lucy et al. 2020). Bearing in mind the above, as well the discussion in Sect. 6.2 of Sokoloski et al. (2001) about the difficulty of producing rapid variability from the nebular emission, we adopt that the flickering of MWC 560 is continuum dominated and reflects the physical origin of the variations in the accretion disc around the white dwarf.
5.1 B-V colour and temperature of the flickering source
The calculated de-reddened colours of the flickering light source are given in Table 3, where is calculated using and , while is calculated using and . Typical error is mag.
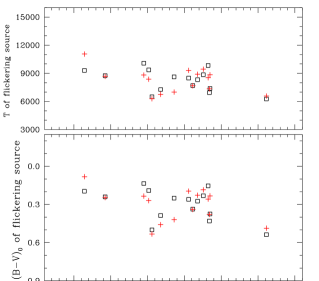
In Fig.6 we plot versus . The solid line represents . To check for a systematic shift between the two methods we performed linear least-squares approximation in one-dimension , when both x and y data have errors. We obtain and . A Kolmogorov-Smirnov test gives Kolmogorov-Smirnov statistic 0.07 and significance level 0.99. It means that both methods give similar results and there is not a systematic shift. The average difference between them is mag, which is comparable with the accuracy of our estimations. In Fig.6, we plot versus the average B band magnitude. We do not detect a statistically significant correlation between the colour of the flickering source and the brightness of the system.
We calculate the temperature of the flickering source using its dereddened colours and the colours of the black body (Straizys, Sudzius & Kuriliene 1976). is calculated using , and is calculated using . The two methods give similar results for the temperature of the flickering source as well as for . The average values are and .
5.2 Radius and luminosity of the flickering source
The radius of the flickering source is calculated using the derived temperature (Sect. 5.1), the B-band magnitude and assuming that it is spherically symmetric. We obtain and . In Fig. 7 we plot and versus the average B band magnitude. It is seen that radius of the flickering source increases when the brightness of the system increases.
The luminosity of the flickering source is calculated using the derived temperature and the radius given in Table 3: , where is the Stefan-Boltzmann constant. We obtain 10.4 , and 22 .
We found a strong correlation between the average B band magnitude and with Pearson correlation coefficient 0.765, Spearman’s (rho) rank correlation 0.761, significance . The correlation between B and is weaker. There are also strong correlations between B and – Pearson 0.785, Spearman 0.782, , as well as between B and – Pearson 0.79, Spearman’s 0.80, .
| date | T1 | R1 | T2 | R2 | |||||
|---|---|---|---|---|---|---|---|---|---|
| YYYYMMDD | [K] | [] | [K] | [] | |||||
| 20091114 | 0.1958 | 9302 | 1.24 | 0.0821 | 11053 | 1.28 | |||
| 20100111 | 0.2400 | 8750 | 2.27 | 0.2461 | 8674 | 3.55 | |||
| 20101229 | 0.3744 | 7380 | 5.14 | 0.2323 | 8846 | 5.38 | |||
| 20110210 | 0.3365 | 7696 | 5.94 | 0.3391 | 7674 | 8.41 | |||
| 20110211 | 0.2604 | 8495 | 3.85 | 0.1952 | 9310 | 4.57 | |||
| 20110212 | 0.2743 | 8321 | 4.46 | 0.2277 | 8904 | 5.43 | |||
| 20120321 | 0.2503 | 8621 | 3.25 | 0.4199 | 7001 | 7.92 | |||
| 20120323 | 0.5001 | 6499 | 5.88 | 0.5325 | 6297 | 9.76 | |||
| 20130303 | 0.3870 | 7275 | 3.29 | 0.4591 | 6756 | 5.67 | |||
| 20130305 | 0.1355 | 10082 | 2.24 | 0.2348 | 8815 | 4.42 | |||
| 20131129 | 0.1907 | 9366 | 2.71 | 0.2699 | 8376 | 5.55 | |||
| 20151118 | 0.1537 | 9829 | 4.50 | 0.2575 | 8531 | 7.65 | |||
| 20160402 | 0.5379 | 6263 | 13.63 | 0.4870 | 6581 | 18.74 | |||
| 20170222 | 0.4304 | 6935 | 6.57 | 0.3784 | 7347 | 8.13 | |||
| 20180124 | 0.2319 | 8851 | 2.64 | 0.1845 | 9444 | 4.13 |


6 Discussion
During the last decades, MWC 560 underwent three optical brightenings - 1990, 2010-2011 and 2016. Multiwavelength observations (including optical, ultraviolet, X-ray and radio data) in the last years as well as a model accounting for the similarities and the differences between the brightening events is presented by Lucy et al. (2020). The observations of the intranight variability during the 1990 outburst are presented and analysed in Tomov et al. (1996) and Zamanov et al. (2011a). The present data set covers the period 2009 – 2019. The long term light curve (Doroshenko et al. 1993; Leibowitz & Formiggini 2015) indicates that during our observations MWC 560 was on average 3-4 times brighter in the optical bands than before 1989.
Random fluctuations of the brightness are observed throughout diverse classes of objects that accrete material onto a compact object (white dwarf, neutron star or black hole) – cataclysmic variables, X-ray binaries, Active Galactic Nuclei. Photoelectric observations identified the flickering as a common characteristic of the accreting white dwarfs in cataclysmic variables (e.g. Mumford 1966, Henize 1949, Robinson 1973). The flickering appears as stochastic light variations on time-scales of about 10 minutes with amplitude from a few mag to more than one magnitude. Three different places are considered as source of flickering from accreting white dwarfs – the accretion disc itself, its outer edge (bright spot), and its inner edge (boundary layer).
6.1 Bright spot
The temperature and the size of the bright spot are derived for a few cataclysmic variables. For OY Car, Wood et al (1989) calculated temperature in the range 8600 – 15000 K; Zhang & Robinson (1987) for U Gem - K; Robinson, Nather & Patterson (1978) give K for the bright spot in WZ Sge. For IP Peg three estimates exist: Marsh (1988) – K, Ribeiro et al. (2007) – 6000-10000 K, Copperwheat et al. (2010) – 7000 - 13000 K. The temperature of the optical flickering source of MWC 560 is in the range K (see Sect.4.1), which is similar to the temperature of the bright spot of cataclysmic variable stars.
The bright spot is produced by the impact of the stream on the outer parts of the accretion disc. In case of Roche-lobe overflow this stream is coming from the inner Lagrangian point . If the red giant in MWC 560 does not fill its Roche lobe, the white dwarf accretes material from its wind. In this case accretion cone and accretion wake will be formed, e.g. Fig. 4 of Ahmad, Chapman & Kondo (1983). The stream formed in the accretion wake should be similar to that formed from Roche-lobe overflow. The luminosity of the bright spot is approximately (Shu 1976; Elsworth & James 1982):
| (1) |
where is the mass accretion rate and is the inward component of the stream’s velocity at the impact with the disc. Eq. 1 indicates that when the mass accretion rate increases, the luminosity of the spot also must increase. In addition, our results (Sect. 5.2) indicate that when the mass accretion rate increases the radius of the bright spot (if it is the source of flickering) also increases, while its temperature remains almost constant.
6.2 Temperature in the accretion disc
The broad-band variability is often attributed to (i) inward propagating fluctuations driven by stochastic variability in the angular momentum transport mechanism (Lyubarskii 1997); (ii) turbulence, vortexes in the disc (e.g. Dobrotka et al. 2010; Kurbatov & Bisikalo 2017); (iii) spiral structures in the disc (e.g. Baptista & Bortoletto 2008). The timescales of changes of the overall structure of the accretion disc are longer compared to the local fluctuating processes in the flow that can generate the flickering. In this way the dynamical time scale variability of the flickering light source do not change the overall structure of the accretion disc. Considering the entire disc structure, the temperature in the disc can be approximated with the radial temperature profile of a steady-state accretion disc (e.g. Frank, King & Raine 2002):
| (2) |
is the radial distance from the white dwarf. We assume and cm (Zamanov, Gomboc, & Latev 2011; Lucy et al. 2020) and mass accretion rate of about yr-1 (Schmid et al. 2001).
Using the parameters for MWC 560, a temperature K (the temperature of the flickering light source as given in Table 3) should be achieved at a distance from the white dwarf. If the accretion disc itself is the place for the origin of the flickering of MWC 560, then it comes at distance from the white dwarf.
6.3 Boundary layer
The boundary layer between the white dwarf and the inner edge of the accretion disc should have temperature K (e.g. Mukai 2017). The derived temperature of the flickering source is considerably lower than that expected from the boundary layer. If the boundary layer is optically thick, in this case the radius of the flickering source measured in the optical bands (Fig. 7) could represent the radius up to which the emission generated from the boundary layer is reprocessed by the inner parts of the accretion disc and the accretion disc corona.
6.4 Disappearance of the flickering
The first indication that flickering of symbiotic stars disappears sometimes was found for the recurrent nova T CrB (Bianchini & Middleditch 1976). In CH Cyg the flickering was missing for more than 3 years (Stoyanov et al. 2018). In RS Oph the flickering disappeared after the nova outburst and re-appeared 241 days later (Worters et al. 2007). In MWC 560 the flickering was visible in all observations obtained between 1984 and May 2018 (Tomov et al. 1996, Zamanov et al. 2011a,b; Lucy et al. 2020). It disappeared in October 2018 (Goranskij et al. 2018) and is not visible in our observations obtained in October 2019 and February 2020. What can be the reason for disappearance of the flickering :
-
1.
If the source of the flickering is bright spot than it means that for some reason (see Eq. 1). In other words at the impact point, the stream has velocity approximately equal to the velocity of the outer disc edge.
-
2.
If the source of the flickering is the accretion disc, the disappearance means that the stochastic fluctuations disappear and the disc becomes stable (non-fluctuating).
-
3.
Goranskij et al. (2018) proposed that a common envelope is formed due to the transit of the system to a dynamical mode of accretion with an increased rate. The accretion matter filling the Roche lobe of the compact companion blocked the jets and overlapped the direct visibility of the companion, so flickering was deleted.
In MWC 560 at the disappearance of the flickering the hot component becomes bluer, but its brightness in B band remain high (see Fig. 4b, where the arrow indicates the observations without flickering). This could be an indication that the accretion disc becomes smaller and/or hotter.
In X-rays MWC 560 is type, i.e. with two X-ray thermal components – soft and hard (Luna et al. 2013). The soft emission is most likely produced in a colliding-wind region, and the hard emission is most likely produced in boundary layer between accretion disc and white dwarf. The changes in the X-ray emission can give us clues why the flickering disappeared.
7 Conclusions
We report quasi-simultaneous observations of the flickering variability of the jet-ejecting symbiotic star MWC 560 in 17 nights during the period November 2011 - October 2019. The colour-magnitude diagram, B versus B-V, shows that when the flickering exists, the hot component of the system becomes redder as it gets brighter.
For the flickering source we find that it has colour in the range , temperature in the range K, and radius in the range . The estimated temperature is similar to that of the bright spot of cataclysmic variables. We do not find a correlation between the temperature of the flickering and the brightness. However, we do find strong correlations (1) between B band magnitude and the average radius of the flickering source – as the brightness of the system increases the size of the flickering source also increases; (2) between B band magnitude and the luminosity of the flickering source – as the brightness of the system increases the luminosity of the flickering source also increases. When the flickering disappeared in 2019, the B-V colour of the hot component becomes bluer and its brightness in UBV remains high.
The behaviour of the hot component and flickering source in MWC 560 should provide useful input for theoretical modeling of accretion in symbiotic type binaries.
Acknowledgements: We dedicate this paper to the memory of Prof Toma Tomov (1953 - 2019), who initiated the observations of MWC 560 at Rozhen Observatory. This work was supported by the grant KP-6-H28/2 ”Binary stars with compact object” (Bulgarian National Science Fund).
References
- [1] Ahmad, I. A., Chapman, R. D., Kondo, Y. 1983, A&A, 126, L5
- [2] Angeloni, R., Di Mille, F., Lopes, C. E. F., Masetti, N. 2013, IAUS, 179, IAUS..290
- [3] Baptista, R. & Bortoletto, A. 2008, ApJ, 676, 1240
- [4] Bessell, M. S. 1979, PASP, 91, 589
- [5] Bianchini, A., Middleditch J. 1976, IBVS, 1151, 1
- [6] Bond, H. E., Pier, J., Pilachowski, C., Slovak, M., Szkody, P. 1984, BAAS, 16, 516
- [7] Bonev, T. & Dimitrov D. 2010, BlgAJ, 13, 153
- [8] Bruch, A. 1992, A&A, 266, 237
- [9] Copperwheat, C. M., Marsh, T. R., Dhillon, V. S., Littlefair, S. P., Hickman, R., Gänsicke, B. T., Southworth, J. 2010, MNRAS, 402, 1824
- [10] Dobrotka, A., Hric, L., Casares, J., Shahbaz, T., Martínez-Pais, I. G., Muñoz-Darias, T. 2010, MNRAS, 402, 2567
- [11] Dobrzycka, D., Kenyon, S. J., Milone, A. A. E. 1996, AJ, 111, 414
- [12] Doroshenko, V. T., Goranskij, V. P., Efimov, Y. S. 1993, IBVS, 3824, 1
- [13] Elsworth, Y. P. & James J. F. 1982 MNRAS, 198, 889
- [14] Frank, J., King, A., Raine, D. J. 2002, Accretion Power in Astrophysics: Third Edition, CUP
- [15] Gaia Collaboration, Brown, A. G. A., Vallenari, A., et al. 2018, A&A, 616, 1
- [16] Goranskij, V. P., Zharova, A. V., Barsukova, E. A., Burenkov, A. N. 2018, ATel, 12227, 1
- [17] Gromadzki, M., Mikolajewski, M., Tomov, T., Bellas-Velidis, I., Dapergolas, A., Galan, C. 2006, AcA, 56, 97
- [18] Gromadzki, M., Mikołajewska, J., Whitelock, P. A., Marang, F. 2007, A&A, 463, 703
- [19] Henden, A., & Munari, U. 2006 A&A, 458, 339
- [20] Henize, K. G. 1949, AJ, 54, 89
- [21] Houdashelt, M. L., Wyse, R. F. G., Gilmore, G. 2001, PASP, 113, 49
- [22] Koornneef, J. 1983, A&A, 500, 247
- [23] Kurbatov, E. P. & Bisikalo, D. V. 2017, ARep, 61, 475
- [24] Leibowitz, E. M., Formiggini, L. 2015, AJ, 150, 52
- [25] Lucy, A. B., Knigge C., Sokoloski J. L. 2018, MNRAS, 478, 568
- [26] Lucy, A. B., Sokoloski, J. L., Munari, U. et al. 2020, MNRAS, 492, 3107
- [27] Luna, G. J. M., Sokoloski, J. L., Mukai, K., Nelson, T. 2013, A&A, 559, A6
- [28] Lyubarskii, Y. E. 1997, MNRAS, 292, 679
- [29] Marsh, T. R. 1988, MNRAS, 231, 1117
- [30] Merrill, P. W., Burwell, C. G. 1943, ApJ, 98, 153
- [31] Mikołajewska, J. 2012, BaltA, 21, 5
- [32] Mukai, K. 2017, PASP, 129, 062001
- [33] Mumford, G. S. 1966, ApJ, 146, 411
- [34] Munari, U. et al. 2016, NewA, 49, 43
- [35] Nelson, T., Mukai, K., Orio, M., Luna, G. J. M., Sokoloski, J. L. 2011, ApJ, 737, 7
- [36] Robinson, E. L. 1973, ApJ, 183, 193
- [37] Robinson, E. L., Nather R. E., Patterson J. 1978, ApJ, 219, 168
- [38] Ribeiro, T., Baptista, R., Harlaftis, E. T., Dhillon, V. S., Rutten, R. G. M. 2007, A&A, 474, 213
- [39] Rodrigo, C., Solano, E., Bayo, A. 2018, The SVO Filter Profile Service, avaible at: http://ivoa.net/documents/Notes/SVOFPS/index.html
- [40] Savage, B. D., & Mathis, J. S. 1979, ARA&A, 17, 73
- [41] Scaringi, S., et al. 2015, SciA, 1, e1500686
- [42] Schmid, H. M., Kaufer, A., Camenzind, M., et al. 2001, A&A, 377, 206
- [43] Shu, F. H., 1976, IAU Symposium, 73, 253
- [44] Sokoloski, J. L., Bildsten, L., Ho, W. C. G. 2001, MNRAS, 326, 553
- [45] Stoyanov, K. A., et al. 2018, BlgAJ, 28, 42
- [46] Straizys V., Sudzius J., Kuriliene G., 1976, A&A, 50, 413
- [47] Strigachev, A. & Bachev R. 2011, BlgAJ, 16, 144
- [48] Szkody, P., Mateo, M., Schmeer, P. 1990, IAUC, 4987, 1
- [49] Tody, D. 1993, ASPC, 173, ASPC…52
- [50] Tomov, T., Kolev, D., Georgiev, L., Zamanov, R., Antov, A., Bellas, Y. 1990, Natur, 346, 637
- [51] Tomov, T., Kolev, D., Munari, U., Sostero, G., Lepardo, A. 1995, A&A, 300, 769
- [52] Tomov, T., Kolev, D., Ivanov, M., et al. 1996, A&AS, 116, 1
- [53] Wood, J. H., Horne, K., Berriman, G., Wade, R. A. 1989, ApJ, 341, 974
- [54] Worters, H. L., Eyres, S. P. S., Bromage, G. E., Osborne, J. P. 2007, MNRAS, 379, 1557
- [55] Zamanov, R. K., Tomov, T., Bode, M. F., Mikołajewski, M., Stoyanov, K. A., Stanishev, V. 2011a, BlgAJ, 16, 3
- [56] Zamanov, R., Boeva, S., Latev, G., Stoyanov, K., Bode, M. F., Antov, A., Bachev, R. 2011b, IBVS 5995, 1
- [57] Zamanov R., Gomboc A., Latev G. 2011, BlgAJ, 16, 18
- [58] Zamanov R. K., Latev G. Y., Boeva S., Ibryamov S., Nikolov G. B., Stoyanov K. A. 2017, AN, 338, 598
- [59] Zamanov, R. K., Boeva, S., Latev, G. Y., Martí, J., Boneva, D., Spassov, B., Nikolov, Y., Bode, M. F., Tsvetkova, S. V., Stoyanov, K. A. 2018, MNRAS, 480, 1363
- [60] Zamanov, R. & Marziani, P. 2002, ApJL, 571, L77
- [61] Zhang, E.-H. & Robinson, E. L. 1987, ApJ, 321, 813
- [62] Zhekov, S. A., Hunt, L. K., Tomov, T., Gennari, S. 1996, A&A, 309, 800