Perovskite-type cobalt oxide at the multiferroic Co/Pb Zr0.2Ti0.8O3 interface
Abstract
Magnetic Tunnel Junctions whose basic element consists of two ferromagnetic electrodes separated by an insulating non-magnetic barrier have become intensely studied and used in non-volatile spintronic devices. Since ballistic tunnel of spin-polarized electrons sensitively depends on the chemical composition and the atomic geometry of the lead/barrier interfaces their proper design is a key issue for achieving the required functionality of the devices such as e.g. a high tunnel magneto resistance. An important leap in the development of novel spintronic devices is to replace the insulating barrier by a ferroelectric which adds new additional functionality induced by the polarization direction in the barrier giving rise to the tunnel electro resistance (TER). The multiferroic tunnel junction Co/PbZr0.2Ti0.8O3/La2/3Sr1/3MnO3 (Co/PZT/LSMO) represents an archetype system for which - despite intense studies - no consensus exists for the interface geometry and their effect on transport properties. Here we provide the first analysis of the Co/PZT interface at the atomic scale using complementary techniques, namely x-ray diffraction and extended x-ray absorption fine structure in combination with x-ray magnetic circular dichroism and ab-initio calculations. The Co/PZT interface consists of one perovskite-type cobalt oxide unit cell [CoO2/CoO/Ti(Zr)O2] on which a locally ordered cobalt film grows. Magnetic moments (m) of cobalt lie in the range between m=2.3 and m=2.7, while for the interfacial titanium atoms they are small (m=+0.005 ) and parallel to cobalt which is attributed to the presence of the cobalt-oxide interface layers. These insights into the atomistic relation between interface and magnetic properties is expected to pave the way for future high TER devices.
Introduction
A magnetic tunnel junction becomes a multiferroic one if the insulating (oxide) barrier is replaced by a ferroelectric. In addition to the tunneling magnetoresistance (TMR), which is detected by switching the electrode magnetizations from parallel () to antiparallel (), the multiferroic tunnel junction (MFTJ) exhibits also tunneling electro-resistance upon electric polarization reversal. In consequence, the resistance () takes four different values, paving the way for nonvolatile four-state memory devicesVelev2009 ; Garcia2010 . One prototype example is the Co/PZT/LSMO system where abbreviation PZT is used for the ferrolectric PbZr0.2Ti0.8O3 oxide and LSMO for the ferromagnetic, almost half metallic, La2/3Sr1/3MnO3 oxide Pantel2012 . For a 3.2-nm-thick PZT barrier, epitaxially grown on a thin LSMO film, it was shown that when the PZT polarization changes from pointing toward LSMO to pointing toward Co, the TMR which is given by TMR= changes sign from to . Until now, the origin of this TMR sign inversion is not completely understood. Pantel et al. Pantel2012 argued that the inversion of the TMR sign could be related to the inversion of the spin polarization at the LSMO/PZT interface or, alternatively, at the Co/PZT interface Belashchenko05 ; Heiliger05 , while resonant tunneling Yuasa02 ; Wunnicke02b ; Tsymbal2003 via the barrier was ruled out. With regard to the Co/PZT interface, ab initio calculations Borisov2014 assumed that its geometric structure is characterized by the terminating Ti(Zr)O2 plane with interfacial Co atoms residing on top of the oxygen atoms. This interface structure model has been frequently used in calculations, but a clear-cut experimental proof has not been given up to now. Several previous studies on different metal/oxide interfaces have indicated that metals deposited on oxides have a strong tendency to form oxide-like interfaces such as e.g. in the case of Fe/MgO Meyerheim2001 ; Tusche2005 and of Fe/BaTiO3 Bocher2012 , the latter being similar to the Co/PZT system. For iron grown on the perovskite (PV)-type ferroelectric BaTiO3 (BTO) transmission electron microscopy Bocher2012 has suggested the formation of a single FeO layer at the interface, but very recently, a first-principles study by Imam et al.Imam2019 of the Co/PZT interface proposed a more complex interface defect structure characterized by an oxygen deficient TiO2 termination layer which is followed by an interstitial oxygen atom residing on top of titanium. Depending on the polarization state of the ferroelectric the vertical distance between the Ti-O complex and the first cobalt layer strongly varies, which is suggested to be responsible for the spin-polarization to change sign upon polarization reversal Imam2019 . Up to now, no direct and independent proof for any of the proposed interface models has been given. This calls for the application of well-established structure analytical tools which are sensitive to monolayers of materials and which are capable to study both long and short range order.
To this end we have carried out surface x-ray diffraction (SXRD) and extended x-ray absorption fine structure (EXAFS) experiments on the Co/PZT/LSMO system. These two techniques are complimentary to each other with regard to the structural order probed, long range for SXRD and short range in the case of EXAFS. In addition, the magnetic properties were studied by x-ray magnetic circular dichroism (XMCD) above the cobalt and titanium L-II,III edges in combination with state of the art ab-initio calculations using the interface structure model as input. The magnetic moments of the Co and Ti ions at the top interface were derived.
Results
.1 Surface X-Ray Diffraction
The LSMO (20 nm) and PZT (2 unit cells) films were grown on a single crystalline SrTiO3(001) [STO(001)] substrate by pulsed laser deposition as discussed earlier Pantel2012 . The SXRD experiments were carried out at the beamline ID03 of the European Synchrotron Radiation Facility (ESRF) in Grenoble (France) using a ultra-high-vacuum (UHV) diffractometer and a two-dimensional (2D) pixel detector. After transfer into the UHV system the sample was heated in oxygen atmosphere (pO2 10-6 mbar) up to about 300∘ C to remove carbon contamination and water. The integrated intensities were recorded under grazing incidence (i=1∘) of the incoming x-ray beam (=0.50 Å).
Data were first collected for pristine PZT/LSMO/STO prior to cobalt deposition. In the next step, cobalt was deposited on the pristine sample using an electron beam evaporator. We have investigated the structure of the interface and the films after depositing about 0.5 and 1.0 monolayers (ML) of cobalt. Here and in the following we refer to a coverage of 1 ML as one adatom per surface unit cell, i.e. 6.551014 atoms/cm2. The cobalt film thickness was calibrated by monitoring the intensity of the (1 0 1.5) anti-phase reflection of the crystal truncation rod (CTR) versus deposition time and by Auger electron spectroscopy (AES). The amount of long-range ordered cobalt on the PZT surface is derived by the development of the structure model based on the least squares fit of the structure factor magnitudes as will be shown below. In the following we discuss the analysis and the structure of the sample covered by 1 ML of cobalt. The structure of the sample studied after depositing half a ML is outlined in the Supporting Information.
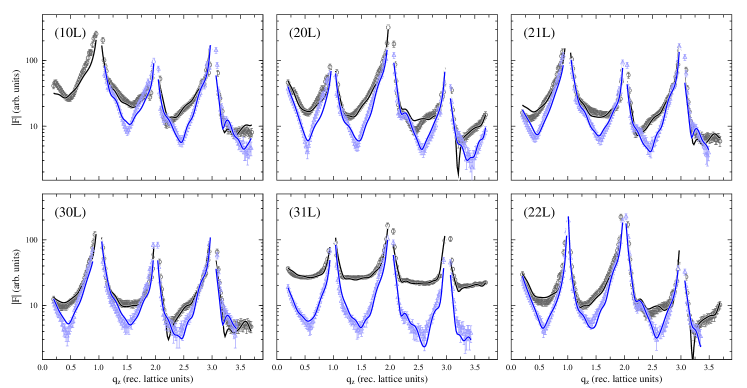
In Figure 1 several symmetry independent CTRs for the pristine PZT/LSMO/STO (blue) and the cobalt covered (black) sample are shown. Symbols represent experimental structure factor magnitudes ( Fobs(HKL)). Data collection was carried out by performing line scans in reciprocal space along the qz direction using a proper region of interest for the signal and background in the 2D pixel detector. For more details we refer to Ref. Drnec2014 . Lines in Figure 1 correspond to calculated structure factor magnitudes ( Fcal(HKL) ). Each data set consists of about 2000 reflections which are averaged to about 1000 by symmetry equivalence based on the plane group. The standard deviation of the Fobs(HKL), estimated from symmetry equivalent reflections, is about 10% which is represented by the error bars in Figure 1. The coherent addition of the adlayer structure factor to the bulk CTR structure factor allows the precise analysis of the adlayer atomic arrangement even in the case of an absence of superstructure. Meyerheim2018
The least squares fit of Fcal(HKL) to Fobs(HKL) was carried out by using the program ”Prometheus” Zucker1983 . Owing to the high symmetry of the structure (plane group ) only the z-parameters of the atoms need to be refined while the x- and y coordinates are fixed by symmetry. For instance, the La(Pb) and Mn(Ti) atoms reside in Wyckoff positions 1a and 1b, respectively, while the two sets of oxygen atoms are located in 1b and 2c. In the analysis we have considered two unit cells (uc) of PZT in addition to two uc of the LSMO substrate. Deeper layers in the LSMO film were treated as bulk like. In addition to the positional parameters an overall scale factor and Debye-parameter (B) was refined, the latter representing static and dynamic disorder Kuhs1992 .
At first we discuss the pristine PZT/LSMO sample.
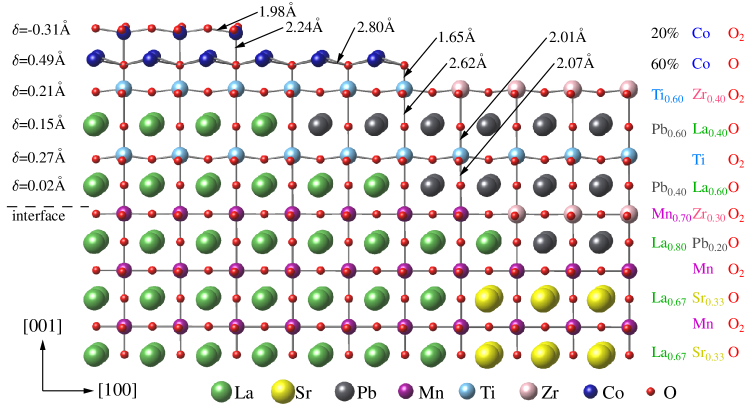
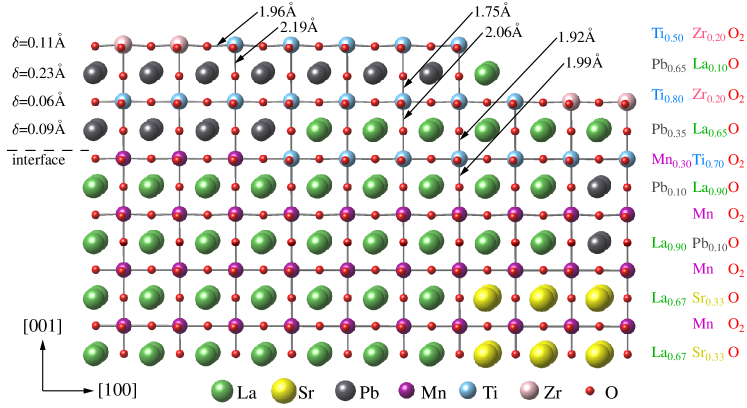
Fig. 2 shows the structure model viewed onto the (010) plane. Atoms are represented by colored balls as labelled in the legend to the figure. For better visualization of the partial occupancies the number of balls approximately represents the fractional coverage within each layer. We find that the PZT film is terminated by a Ti(Zr)O2 layer, which is incomplete (fractional occupancy about 70%). Secondly, we find a considerable degree of cationic intermixing at the PZT/LSMO interface which is highlighted by the dashed line. Across the interface, cationic exchange of lead (Pb) versus lanthanum (La) and titanium (Ti) versus manganese (Mn) is observed. In this respect the PZT/LSMO interface resembles the LaFeO3/SrTiO3 interface investigated previously Xu2017 . The approximate composition of the individual layers is given on the right. The cationic exchange appears as not to be symmetric at least as far as the Pb/La exchange is concerned for which the uncertainty is in the 0.2 range, while for the Mn/Ti exchange it is larger in the 0.4 range due to the similar scattering amplitudes of Ti and Mn.
Metal-oxygen distances are typical for those found in PV-type structures. For the octahedrally coordinated metal atoms (Ti, Zr) we derive values around the 2 Å in general with two exceptions located in the terminating range where some vertical relaxation is observed leading to a deviation of approximately 0.10-0.15 Å from the ”ideal” value of 1.95 Å if we refer to a perfect cubic STO lattice parameter a0=3.905 Å. Similarly, for the 12-fold coordinated atoms (La, Pb), distances in the 2.7 Å range are derived (not indicated in detail in Figure 2). The accuracy of the distance determination is estimated to lie in the 0.05 Å range. The ferroelectric polarization is related to a intra-layer vertical shift () between the cation and oxygen which can be positive ( for P) or negative ( for P). For the 2 uc thick PZT film we find positive values for the as-deposited state, which increase from 0.09 and 0.06 Å in the first u.c. at the interface to LSMO to 0.23 and 0.11 Å in the top u.c. for the PbO and the Ti(Zr)O2 layer, respectively (see Figure 2). These magnitudes are smaller than those theoretically predicted (0.3 Å) Borisov2014 , which -however- refer to the bulk structure. With this model an excellent fit (solid blue lines) to the Fobs(HKL) is achieved characterized by the un-weighted residuum RU=0.13 and a goodness of fit GOF=1.67Ru .
In the next step, cobalt was deposited on the PZT surface while simultaneously monitoring the (1 0 1.5) reflection intensity at the anti-phase scattering condition along the CTR. The Co deposition was stopped at intensity saturation corresponding to an 300% increase relative to the pristine sample. In general, there is a significant overall increase of the Fobs(HKL) along the CTRs. Based on AES, the cobalt coverage is equal to approximately 1 ML. At this film thickness some fraction of the deposited cobalt might not be adsorbed in a long range ordered structure. In order to fit the experimental data several models including those suggested by different authors Pantel2012 ; Bocher2012 ; Imam2019 were considered as starting models followed by relaxation of the z-positions and variation of the site occupancies. The best fit, which is given by the black solid lines in Figure 1, is achieved for the model which is outlined in Figure 3.
The structure is characterized by two fractionally filled layers of cobalt oxide which continue the PV-type structure of the substrate. In detail, a 60% filled atomic layer of CoO follows on the Ti(Zr)O2 terminating layer of the PZT film. Above the CoO layer a 20% filled atomic layer of CoO2 is located. In both cobalt oxide layers a relatively large parameter is found (0.49 and -0.31 Å for CoO and CoO2, respectively), while interatomic Co-O distances are typical for those in PV-type structures. There is one quite short (1.65 Å) oxygen-metal distance between the CoO-layer oxygen and the topmost Ti(Zr) ions, which is also fairly well reproduced for the 0.5 ML Co/PZT interface, which is discussed in more detail in the Supplementary Information. The parameters within the Ti(Zr)O2 layers of the PZT film are enhanced relative to the pristine one (e.g. 0.27 versus 0.06 Å and 0.21 versus 0.11 Å). The structure of deeper layers involving PZT and LSMO are not significantly modified as compared to the PZT/LSMO sample.
The fit to the Fobs(HKL) is represented by the black solid line and is slightly worse than that for the pristine one (RU=0.22, GOF=1.71). This is almost completely due to the bad fit at low values of qz along the (10L) CTR as a result of problems with the background subtraction (see also Supplementary information). We nevertheless included these data into the analysis. Here we recall that the comparison between the CTRs of the pristine and the cobalt dosed sample in Figure 1 impressively points out that the CTRs profiles extremely sensitively depend on the variation of the structure leaving no room for different film and interface models.
In summary, we conclude that adsorption of a approximately 1 ML of cobalt on the PZT/LSMO surface leads to the formation of a PV-like cobalt oxide (CoO-CoO2 sequence) forming islands on the PZT surface which cover approximately 60% (first layer) and 20% (second layer) of the surface. The SXRD analysis finds no evidence for the presence of cobalt metal at this coverage. This conclusions are supported by the structure analysis of a Co/PZT/LSMO sample with a cobalt film thickness of approximately 0.5 ML, i.e. about one half of the coverage discussed here (see Supporting Information). For this sample we find the formation of only the first CoO-type of layer with a fractional coverage of about 50%.
.2 Extended X-Ray Absorption Fine Structure (EXAFS)
The EXAFS measurements were carried out in-situ at the Samba beamline of the Synchrotron Radiation Facility Soleil in Saint Aubin (France) using an end station equipped with standard surface analytical tools. After cobalt deposition on the PZT/LSMO sample, EXAFS data were collected above the Co-K absorption edge (E0=7709 eV) in the fluorescent yield (FY) mode using a single element silicon drift detector (Bruker) placed in plane at an angle of 90∘ to the incoming beam. The in-plane and out-of-plane cobalt atomic environment was investigated by exploiting the polarization dependence of the EXAFS signal, taking advantage of the linear polarization of the x-ray beam. EXAFS spectra were collected with the electric field vector aligned either perpendicular (E⟂) or parallel (E∥) to the plane of the substrate Koningsberger .
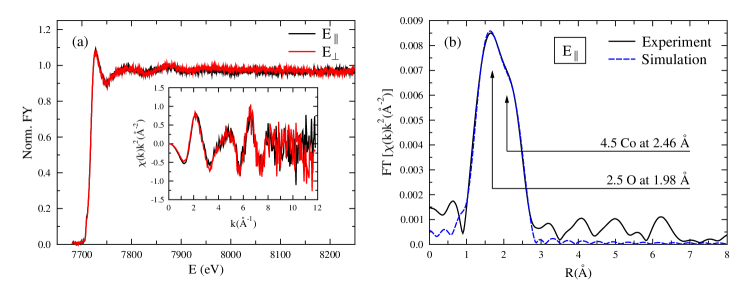
The sample was prepared in the same way as done for the SXRD experiments and about 1 ML of cobalt was deposited in-situ. Figure 4(a) shows the normalized FY, which is proportional to the linear absorption coefficient , versus photon energy for both geometries. Direct inspection reveals that both curves are nearly identical indicating an isotropic environment around the cobalt atoms. This is also evident by inspecting the k2-weighted interference function [] (see inset of Figure 4(a), which is obtained after background subtraction and multiplication with k2, the squared wave vector magnitude of the photoelectron. The magnitude is given by: with E and E0 being the photon and the absorption edge energy, respectively. The quantitative analysis begins with the evaluation of the magnitude of the Fourier-Transform (FT) of the , which is shown in Figure 4(b) for E∥ geometry.
The dominant peak in the FT in the 2 Ångstrøm range has an asymmetric shape suggesting that it contains the contribution of two atomic shells. This peak was fitted in R-space using the program Feff FEFF , based on theoretical scattering amplitudes and phases. We find that the first shell corresponds to approximately 2.5 oxygen atoms at a distance of 1.98 Å , while the second shell is composed of 4.5 cobalt atoms as a distance of 2.46 Å. The fit parameters are listed in Table 1.
| Pol. | Shell | R (Å) | N∗ | (Å2) | E0 (eV) | Ru |
|---|---|---|---|---|---|---|
| E | O1 | 1.94(3) | 2.0(5) | 0.017(5) | -1.2 | 4.8 |
| Co | 2.43(3) | 4.5(5) | 0.013(5) | -1.2 | ||
| E | O1 | 1.98(3) | 2.5(5) | 0.012 (5) | 3.1 | 4.0 |
| Co | 2.46(3) | 4.5(5) | 0.017 (5) | 3.1 |
This model is similar to that derived by SXRD, indicating the formation of cobalt oxide. The difference is that the EXAFS analysis in addition finds a cobalt metal-like shell. Compared to the bulk hcp-Co nearest neighbor distance of 2.51 Å, the distance of 2.46(3) Å between Co atoms corresponds to a contraction which is related to the ”mesoscopic misfit” owing to the reduced coordination Mironets2008 ; Meyerheim2012 ; Brovko2014 . Also, the EXAFS analysis provides no clear evidence for the presence of the second Co-O shell that should be expected in the distance range between 2.60 and 2.80 Å characteristic for the cation in the 12-fold coordination of the PV structure. We believe that this is due to the small contribution of this shell in comparison with the strong Co-Co metal contribution at 2.46 Å.
We estimate the uncertainties for the effective coordination numbers (N∗) to lie in the 10 to 25% range, those of the distance determination to be 0.03 Å at most. The amplitude reduction factor (S=0.90), which is important for the correct determination of N∗ was derived by using a CoO standard (sodium chloride-type structure) prepared by annealing the as deposited film in oxygen atmosphere (see Supporting Information).
.3 X-Ray Circular Magnetic Dichroism
The XMCD experiments were carried out at the Boreas bemaline at the Synchrotron Radiation Facility Alba (Barcelona, Spain) using the HECTOR vector magnet end station. Cobalt was deposited on the PZT/LSMO sample in approximately the same film thickness regime as in the SXRD and EXAFS experiments ( 1 ML). The absorption coefficient in the vicinity of the Co-LII,III edge (E0=793 and 778 eV, respectively) was monitored via the total electron yield method at approximately 4 K by collecting the sample drain current.
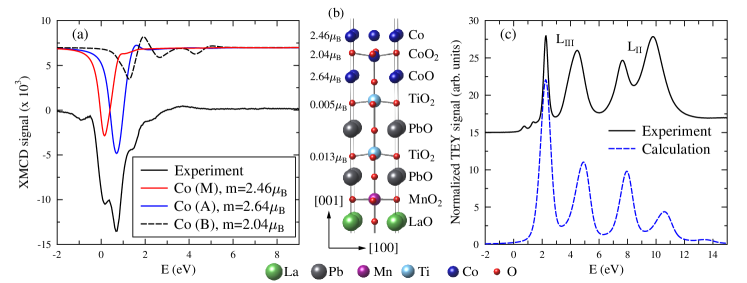
Figure 5(a) shows the experimental XMCD spectrum obtained for 1 ML Co/PZT/LSMO red in a magnetic field of 6T. At the LIII edge the lineshape is characterized by three components which appear within about 2 eV and which are clearly separable. Qualitatively these can be attributed to the different cobalt environments at the Co/PZT interface in agreement with the SXRD and EXAFS analysis. In order to quantitatively investigate the XMCD spectrum, we employed first-principles simulations applying a fully relativistic linear muffin-tin orbital (LMTO) method Andersen1975 ; PYLMTO ; NKA+83 ; MPK80 . The implementation of these methods is based on four-component basis functions constructed by solving the Dirac equation inside a Wigner-Setz cellNKA+83 . This is decisive for a correct description of states of heavy elements such as Pb or Bi MPK80 . The X-ray absorption and dichroism spectra were calculated taking into account the core level exchange splitting. The finite lifetime of a core hole was accounted for by folding the spectra with a Lorentzian based on core level widths taken from Ref. CaPa01, . Spectrometer resolution was included by a Gaussian function of width 0.6 eV. The positions of main peaks of calculated spectra (shifted for clarity) are in a good agreement with experimental results, although the width of the intensities cannot be reproduced correctly because of a one-particle approximation used in our simulations.
XMCD spectra were calculated taking into account the components derived from the SXRD and the EXAFS analysis and compared with the experimental spectrum as shown in Figure 5(a). The somewhat simplified structure model is shown in Figure 5(b). In addition, the X-ray absorption (XAS) at the Ti-LII,III edge (E0460 and 454 eV, respectively) is shown in Figure 5(b). Direct inspection of the calculated XAS & XMCD spectra indicates that the different components fit to the presence of cobalt metal (M), cubic-like CoO (A) and CoO2 (B). The local magnetic moment of cobalt is found to be equal to 2.46 whereas the cobalt ions bear a magnetic moment of 2.64 in the CoO layer and 2.04 in the CoO2 layer. The magnetic moments (m) of the Ti ions within the PZT film are found to be equal to only m=+0.005 (first layer) and to m=+0.013 (second layer).
Discussion and Conclusion
We have presented a thorough structural and spectroscopic investigation of the multiferroic Co/PZT/LSMO system, analyzing the two interfaces and in particular the evolution of the top interface upon deposition of cobalt. Using complementary techniques (SXRD and EXAFS) clear evidence was given that the two interface structures are rather complex. Importantly, the top interface consists of different components of the cobalt environment. About half a monolayer of cobalt atoms gets oxidized forming a PV-like continuation of the crystal structure. In detail, a cubic-like CoO layer follows the TiO2 layer terminating the PZT film followed by a CoO2 layer. Additionally deposited cobalt leads to the rapid evolution of a metallic cobalt film, as probed by EXAFS, which is sensitive to the short range order, but which escapes the SXRD analysis. XMCD and XAS support these results indicating that the local magnetic moments of cobalt within the cobalt metal/cobalt-oxide interface layer lie in the range between 2.0 and 2.5 .
Our calculations from first principles suggest that the Co2O3 PV layer represents a metallic, ferromagnetic and tetragonally compressed phase, the latter because of the lattice mismatch with the PZT/LSMO substrate. In detail, the PV-type cobalt metal/cobalt-oxide overlayer induces a magnetic moment of +0.005 on the interfacial Ti atoms in the 2 uc thick PZT barrier. The second layer Ti atoms exhibit a slightly larger magnetic moment of +0.013 , which -however- is induced by the LSMO film underneath. The magnitude of this moment can be varied by the PZT polarization direction Borisov2017 which requires a minimum PZT barrier thickness of 4 uc. In summary, we find from the analysis of the XAS data, that the titanium moments are parallel to those of the cobalt atoms within the cobalt/cobalt-oxide layers, albeit they are very small in general. This is at variance with the magnetic properties predicted for several metal/PV interface models discussed previously Meyerheim2011 ; Valencia2011 ; Bocher2012 ; Meyerheim2013 ; Borisov2014 ; Borisov2017 ; Imam2017 ; Imam2019 , where an anti-ferromagnetic alignment of the titanium moments has been found. The main reason for this effect is the formation of strong in-plane Co-O bonds within the CoO and the CoO2 layer, which owing to the increased localization of the Co , and orbitals involved reduce the overlap of the corresponding charge density with the titanium orbitals.
We conclude that the complex Co/PZT interface involving a single unit cell of a PV-type cobalt-oxide plays a key role for the electronic and transport properties of this multiferroic tunnelling junction. Apart from the ferromagnetically aligned interfacial Ti atoms, there is another important factor influencing its functionality which originates by the polarization-dependent partial metallization of the PZT film near its interfaces. Quindeau2015 In this context, the presence of the conducting and strongly ferromagnetic PV-like cobalt-oxide layer can crucially affect the measured TMR of Co/PZT/LSMO. Thus, the complex interface involving an oxide interface is expected to have important consequences on the electronic, magnetic and the transport properties.
Methods
Sample preparation
The oxide films were epitaxially grown on on 0.1∘ miscut SrTiO3(001) substrates by pulsed laser deposition (PLD) using stoichiometric ceramic targets under oxygen atmosphere (p=0.2 mbar) while substrates were kept at 550-600∘ C. For the PLD process an excimer laser (=248 nm) with a fluence of 300 mJ/cm2 at the sample position was used. Cobalt deposition was carried out in-situ prior to the SXRD, EXAFS and XMCD experiments by evaporation from a cobalt rod heated by electron bombardment.
Surface X-ray diffraction
Surface X-ray diffraction experiments were carried out at the beamline ID03 of the European Synchrotron Radiation Facility in Grenoble (France) using a six-circle UHV diffractometer using a primary beam of 24 keV (=0.5 Å) photon energy and grazing incidence (=1∘ of the beam to the sample plane. The intensity distribution [Iobs(HKL)] along the qz=L c* direction in reciprocal space was monitored by line scans using a two-dimensional (2D) pixel detector as discussed in Refs. Schleputz2005 ; Drnec2014 . For each data set approximately 2000 reflections were collected along 12 CTRs which reduce to approximately 1000 along six CTRs by symmetry equivalence (plane symmetry group ). The Iobs(HKL) were then multiplied by instrumental correction factors Ccorr as outlined in detail in Refs. Vlieg1997 ; Drnec2014 yielding the experimental structure intensities [ Fobs (HKL) 2] via: Fobs(HKL) 2= Iobs(HKL) Ccorr. The total uncertainty (1) is estimated by the quadrature sum of the statistical and the systematic error as outlined e.g. in Ref. Robinson1992 . We find the reproducibility of symmetry equivalent Fobs(HKL) 2 is equal to 10%.
EXAFS
EXAFS data have been recorded at the SAMBA beamline of SOLEIL synchrotron (Saint Aubin, France). Monochromatization has been performed using a Si (220) monochromator, two Pd coated mirrors performed harmonic rejection (6mrad grazing incidence). Monochromatic flux () has been measured with a ionisation chamber placed before the SurfAS UHV setup. Co was evaporated from a 1 mm Co rod with an e-beam evaporator (Omicron) and deposited thickness has been calibrated with a quartz micro balance (Sycon STM-2XM) and checked by Auger (CMA100, Omicron). Fluorescence yield was measured with a single element silicon drift detector (Bruker) placed in plane at an angle of 90∘ to the incoming beam.
XMCD
Experiments
The XAS and XMCD measurements were carried out at BOREAS beamline at the ALBA synchrotron light-source in the high-field magnet endstation HECTOR using fully circularly-polarized photons produced by an APPLE-II type undulator. barla2016 The total electron yield (TEY) signal was measured as the sample-to-ground drain current and normalized by the incident photon flux determined by the TEY signal measured on a freshly-evaporated gold mesh placed between the last optical element and the sample. Both TEY signals were amplified by a Keythley model 428 electrometer. During the XMCD experiments a magnetic field of 6T collinear with the photon incidence direction was applied, generated by a superconducting vector-electromagnet (Scientific Magnetics). The XMCD spectra were obtained by measuring the XAS signal with opposite elicities photons and calculating the difference between them. The Co evaporation was carried out in the magnet chamber keeping the sample at room temperature by an e-beam evaporator (SPECS) using an high-purity Co-rod (Goodfellow). The pressure in the measurement chamber was lower than 210-10mbar during the measurements and Co evaporation. The Co coverage was estimated via the XAS edge-jump intensities using previously calibrated values.
First-principles calculations
Electronic structure calculations and simulations of XAS & XMCD spectra were performed using a fully relativistic LMTO method Andersen1975 ; PYLMTO ; MPK80 , which is based on a four-component basis functions constructed by solving the Dirac equation inside a Wigner-Setz cell or an atomic sphereNKA+83 . The crystalline structure obtained from the current experiments served as input for our calculations, performed within the density functional theory utilizing a generalized gradient approximation in the version of Perdew, Burke, and Ernzerhof. Perdew1996 The X-ray absorption and dichroism spectra were calculated taking into account the core level exchange splitting. The finite lifetime of a core hole was accounted for by folding the spectra with a Lorentzian based on core level widths taken from Ref. CaPa01, . The -space integrations were performed with the improved tetrahedron method. Bloechl1994 To attain good convergence of the total energy and of the simulated spectra, we used 1616 divisions of the Brillouin zone.
References
- [1] J. P. Velev, C.-G. Duan, J. D. Burton, A. Smogunov, M. K. Niranjan, E. Tosatti, S. S. Jaswal, and E. Y. Tsymbal. Magnetic tunnel junctions with ferroelectric barriers: Prediction of four resistance states from first principles. Nano Lett., 9(1):427–432, 2009.
- [2] V. Garcia, M. Bibes, L. Bocher, S. Valencia, F. Kronast, A. Crassous, X. Moya, S. Enouz-Vedrenne, A. Gloter, D. Imhoff, C. Deranlot, N. D. Mathur, S. Fusil, K. Bouzehouane, and A. Barthelemy. Ferroelectric control of spin polarization. Science, 327(5969):1106–1110, FEB 26 2010.
- [3] D. Pantel, S. Goetze, D. Hesse, and M. Alexe. Reversible electrical switching of spin polarization in multiferroic tunnel junctions. Nat. Mater., 11(4):289–293, 2012.
- [4] K. D. Belashchenko, J. Velev, and E. Y. Tsymbal. Effect of interface states on spin-dependent tunneling in Fe/MgO/Fe tunnel junctions. Phys. Rev. B, 72:140404, 2005.
- [5] Chr. Heiliger, P. Zahn, B. Yu. Yavorsky, and I. Mertig. Influence of the interface structure on the bias dependence of tunneling magnetoresistance. Phys. Rev. B, 72:180406(R), 2005.
- [6] S. Yuasa, T. Nagahama, and Y. Suzuki. Spin-polarized resonant tunneling in magnetic tunnel junctions. Science, 297:234, 2002.
- [7] O. Wunnicke, N. Papanikolaou, R. Zeller, P. H. Dederichs, V. Drchal, and J. Kudrnovský. Effects of resonant interface states on tunneling magnetoresistance. Phys. Rev. B, 65:064425, 2002.
- [8] E. Y. Tsymbal, A. Sokolov, I. F. Sabirianov, and B. Doudin. Resonant inversion of tunneling magnetoresistance. Phys. Rev. Lett., 90:186602, May 2003.
- [9] V. S. Borisov, S. Ostanin, I. V. Maznichenko, A. Ernst, and I. Mertig. Magnetoelectric properties of the Co/PbZrxTi1-xO3 (001) interface studied from first principles. Phys. Rev. B, 89:054436, 2014.
- [10] H. L. Meyerheim, R. Popescu, J. Kirschner, N. Jedrecy, M. Sauvage-Simkin, B. Heinrich, and R. Pinchaux. Geometrical and compositional structure at metal-oxide interfaces: Mgo on fe(001). Phys. Rev. Lett., 87:076102, Jul 2001.
- [11] C. Tusche, H. L. Meyerheim, N. Jedrecy, G. Renaud, A. Ernst, J. Henk, P. Bruno, and J. Kirschner. Oxygen-induced symmetrization and structural coherency in magnetic tunnel junctions. Phys. Rev. Lett., 95:176101, Oct 2005.
- [12] Laura Bocher, Alexandre Gloter, Arnaud Crassous, Vincent Garcia, Katia March, Alberto Zobelli, Sergio Valencia, Shaïma Enouz-Vedrenne, Xavier Moya, Neil D. Marthur, Cyrile Deranlot, Stéphane Fusil, Karim Bouzehouane, Manuel Bibes, Agnès Barthélémy, Christian Colliex, and Odile Stéphan. Atomic and electronic structure of the batio3/fe interface in multiferroic tunnel junctions. Nano Letters, 12(2):1113–1113, 2012. PMID: 22289086.
- [13] M. Imam, N. Stojić, and N. Binggeli. Mechanism for reversible electrical switching of spin polarization in tunnel junctions. Phys. Rev. Applied, 11:014028, Jan 2019.
- [14] Jakub Drnec, Tao Zhou, Stelian Pintea, Willem Onderwaater, Elias Vlieg, Gilles Renaud, and Roberto Felici. Integration techniques for surface x-ray diffraction data obtained with a two-dimensional detector. Journal of Applied Crystallography, 47(1):365–377, Feb 2014.
- [15] Holger L. Meyerheim and Christian Tusche. Atomic and electronic structure of the clean and adsorbate covered (0001) surface of the topological insulator bi2se3. physica status solidi (RRL) – Rapid Research Letters, 12(11):1870337, 2018.
- [16] U. H. Zucker, E. Perenthaler, W. F. Kuhs, R. Bachmann, and H. Schulz. PROMETHEUS. a program system for investigation of anharmonic thermal vibrations in crystals. Journal of Applied Crystallography, 16:358, 1983.
- [17] W. F. Kuhs. Generalized atomic displacements in crystallographic structure analysis. Acta Cryst. A, 48:80–98, 1992.
- [18] Pengfa Xu, Wei Han, Philip M. Rice, Jaewoo Jeong, Mahesh G. Samant, Katayoon Mohseni, Holger L. Meyerheim, Sergey Ostanin, Igor V. Maznichenko, Ingrid Mertig, Eberhard K. U. Gross, Arthur Ernst, and Stuart S. P. Parkin. Reversible formation of 2d electron gas at the lafeo3/srtio3 interface via control of oxygen vacancies. Advanced Materials, 29(10):1604447, 2017.
- [19] = . Here, , are the experimental and calculated structure factors, respectively. The summation runs over all datapoints. The GOF is given by: GOF= , where the difference between observed and calculated intensities is normalized to the uncertainties expressed by the standard deviation () and to , i.e. the difference between the number of independent data points (N) and the number of parameters (P) which are varied.
- [20] D.C. Koningsberger and R. Prins. X-Ray Absorption. John Wiley and Sons, 1988.
- [21] B. Ravel and M. Newville. ATHENA, ARTEMIS, HEPHAESTUS: data analysis for X-ray absorption spectroscopy using IFEFFIT. Journal of Synchrotron Radiation, 12(4):537–541, Jul 2005.
- [22] The unweighted residuum (Ru) is defined by: R, where Yobs and Ycalc are the experimental and calculated magnitudes of the peak selected in the FT of the spectrum and the summation extends over all points in the window used to filter the peak.
- [23] O. Mironets, H. L. Meyerheim, C. Tusche, V. S. Stepanyuk, E. Soyka, P. Zschack, H. Hong, N. Jeutter, R. Felici, and J. Kirschner. Direct evidence for mesoscopic relaxations in cobalt nanoislands on cu(001). Phys. Rev. Lett., 100:096103, Mar 2008.
- [24] H. L. Meyerheim, E. D. Crozier, R. A. Gordon, Q. F. Xiao, K. Mohseni, N. N. Negulyaev, V. S. Stepanyuk, and J. Kirschner. Direct proof of mesoscopic misfit in nanoscale islands by x-ray absorption spectroscopy. Phys. Rev. B, 85:125405, Mar 2012.
- [25] Oleg O. Brovko, Dmitry I. Bazhanov, Holger L. Meyerheim, Dirk Sander, Valeri S. Stepanyuk, and Jürgen Kirschner. Effect of mesoscopic misfit on growth, morphology, electronic properties and magnetism of nanostructures at metallic surfaces. Surface Science Reports, 69(4):159 – 195, 2014.
- [26] O. Krogh Andersen. Linear methods in band theory. Phys. Rev. B, 12:3060–3083, 1975.
- [27] A. Ya. Perlov, A. N. Yaresko, and V. N. Antonov, 1995, unpublished.
- [28] V. V. Nemoshkalenko, A. E. Krasovskii, V. N. Antonov, Vl. N. Antonov, U. Fleck, H. Wonn, and P. Ziesche. The relativistic linear muffin-tin orbital method. application to au. Physica Status Solidi B, 120:283–296, 1983.
- [29] A. H. MacDonald, W. E. Pickett, and D. D. Koelling. A linearized relativistic augmented-plane-wave method utilizing approximate pure spin basis functions. J. Phys. C, 13(14):2675–2683, 1980.
- [30] J. L. Campbell and T. Parr. Widths of the atomic k-n7 levels. At. Data Nucl. Data Tables, 77:1–56, 2001.
- [31] V. Borisov, S. Ostanin, and I. Mertig. Multiferroic properties of the pbtio3/la2/3sr1/3mno3 interface studied from first principles. Journal of Physics: Condensed Matter, 29:175801, 2017.
- [32] H. L. Meyerheim, F. Klimenta, A. Ernst, K. Mohseni, S. Ostanin, M. Fechner, S. Parihar, I. V. Maznichenko, I. Mertig, and J. Kirschner. Structural secrets of multiferroic interfaces. Phys. Rev. Lett., 106:087203, 2011.
- [33] S. Valencia, A. Crassous, L. Bocher, V. Garcia, X. Moya, R. O. Cherifi, C. Deranlot, K. Bouzehouane, S. Fusil, A. Zobelli, A. Gloter, N. D. Mathur, A. Gaupp, R. Abrudan, F. Radu, A. Barthelemy, and M. Bibes. Interface-induced room-temperature multiferroicity in batio3. Nature Materials, 10(2):753, 2011.
- [34] H. L. Meyerheim, A. Ernst, K. Mohseni, I. V. Maznichenko, J. Henk, S. Ostanin, N. Jedrecy, F. Klimenta, J. Zegenhagen, C. Schlueter, I. Mertig, and J. Kirschner. Tuning the structure of ultrathin films on Me(001) (Me=Fe,Pd,Pt) surfaces. Phys. Rev. Lett., 111:105501, 2013.
- [35] M. Imam, N. Stojić, and N. Binggeli. Ferroelectric switching of band alignments in LSMO/PZT/co multiferroic tunnel junctions: anab initiostudy. Nanotechnology, 28(31):315202, 2017.
- [36] A. Quindeau, V. Borisov, I. Fina, S. Ostanin, E. Pippel, I. Mertig, D. Hesse, and M. Alexe. Origin of tunnel electroresistance effect in -based multiferroic tunnel junctions. Phys. Rev. B, 92:035130, 2015.
- [37] C. M. Schlepütz, R. Herger, P. R. Willmott, B. D. Patterson, O. Bunk, Ch. Brönnimann, B. Henrich, G. Hülsen, and E. F. Eikenberry. Improved data acquisition in grazing-incidence X-ray scattering experiments using a pixel detector. Acta Cryst. Section A, 61:418–425, 2005.
- [38] E. Vlieg. Integrated Intensities Using a Six-Circle Surface X-ray Diffractometer. J. Appl. Crystallogr., 30:532–543, 1997.
- [39] I K Robinson and D J Tweet. Surface X-ray diffraction. Reports Prog. Phys., 55:599–651, 1992.
- [40] A. Barla, J. Nicolás, D. Cocco, S. M. Valvidares, J. Herrero-Martín, P. Gargiani, J. Moldes, C. Ruget, E. Pellegrin, and S. Ferrer. Design and performance of BOREAS, the beamline for resonant X-ray absorption and scattering experiments at the ALBA synchrotron light source. Journal of Synchrotron Radiation, 23(6):1507–1517, 2016.
- [41] J. P. Perdew, K. Burke, and M. Ernzerhof. Generalized gradient approximation made simple. Phys. Rev. Lett., 77(18):3865, October 1996.
- [42] Peter E. Blöchl, O. Jepsen, and O. K. Andersen. Improved tetrahedron method for brillouin-zone integrations. Phys. Rev. B, 49:16223–16233, Jun 1994.
Acknowledgments
HLM and KM thank the staff of the ESRF and ALBA for their hospitality during their stay in Grenoble and Barcelona. AP and NJ acknowledge the synchrotron SOLEIL for supplying beamtime. Technical support by Frank Weiß is gratefully acknowledged. This work is supported by the Deutsche Forschungsgemeinschaft under grant SFB 762. The ALBA beamtime access was made possible via 2015-IHR-MV and official proposal number No. 2016021628.
Author contributions statement
HLM and AP devised the X-ray diffraction, the EXAFS experiment, AQ prepared the samples. HLM, KM carried out the X-ray experiments at the ESRF. Data analysis was done by KM and HLM. The EXAFS experiments were carried out by AP, NJ and EF at Synchrotron Soleil. The XMCD experiments at ALBA were performed by MV, HBV, PG and HLM. VA and AE conducted the calculations to the XMCD spectra. HLM, AE, and MV wrote the manuscript, with input from all authors. All authors have read and approved the manuscript.
Additional information
Competing non-financial interests The authors declare no competing non-financial interests.