11, Acad. Lavrentiev Pr., Novosibirsk, 630090, Russiabbinstitutetext: Department of physics, Novosibirsk State University,
1, Pirogova str., Novosibirsk, 630090, Russiaccinstitutetext: Novosibirsk State Technical University,
20 Prospekt K. Marksa, Novosibirsk,630073, Russia
Measurement of the process cross section with the SND detector at the VEPP-2000 collider in the energy region GeV
Abstract
The cross section of the process has been measured in the Spherical Neutral Detector (SND) experiment at the VEPP-2000 collider VEPP-2000 in the energy region MeV. The measurement is based on data with an integrated luminosity of about 4.6 pb-1. The systematic uncertainty of the cross section determination is 0.8% at GeV. The meson parameters are obtained as MeV, MeV, , and the parameters of the process, suppressed by -parity, as and degrees.
Keywords:
Vector Meson Dominance Model, Annihilation1 Introduction
SND snd ; snd-2 is a general purpose nonmagnetic detector operating at the VEPP-2000 collider in the center-of-mass energy range from 0.2 to 2.0 GeV vepp2k . Experimental studies include measurements of the cross sections of the annihilation processes into hadrons. These measurements are largely motivated by the need for high-precision calculation of the hadronic contribution to the anomalous magnetic moment of the muon g-2 . In particular, the cross section in the energy region below 1 GeV gives the dominant contribution to this value and should be measured with accuracy better than 1% cs2p .
The cross section of the process in the energy region MeV can be described within the vector meson dominance model (VMD) framework and is determined by the transitions of the light vector mesons (). The main contribution in this energy region comes from the and from the G-parity violating transitions. Studies of the reaction allow us to determine the and meson parameters, provide information on the -parity violation mechanism and mixing kozev .
The process in the energy region below 1000 MeV was studied for more than 40 years in a number of experiments augu ; augu-2 ; augu-3 ; ausl ; ausl-2 ; bena ; quen ; vas1 ; buki ; vas2 ; vas3 ; kur1 ; kur2 ; spec ; olya ; kmd2 ; kmd2-1 ; kloe ; snd2pi ; snd2pi-2 ; kmd2-2 ; kmd2-3 ; kloe-2 ; kloe-3 ; kloe-4 ; babar ; babar-2 ; bes3 . This work presents the results of the cross section measurements with SND detector in the energy region MeV based on pb -1 experimental data collected by SND in 2012–2013. Approximately collinear events are used in the analysis. About are events of the processes , and are events.
2 Experiment
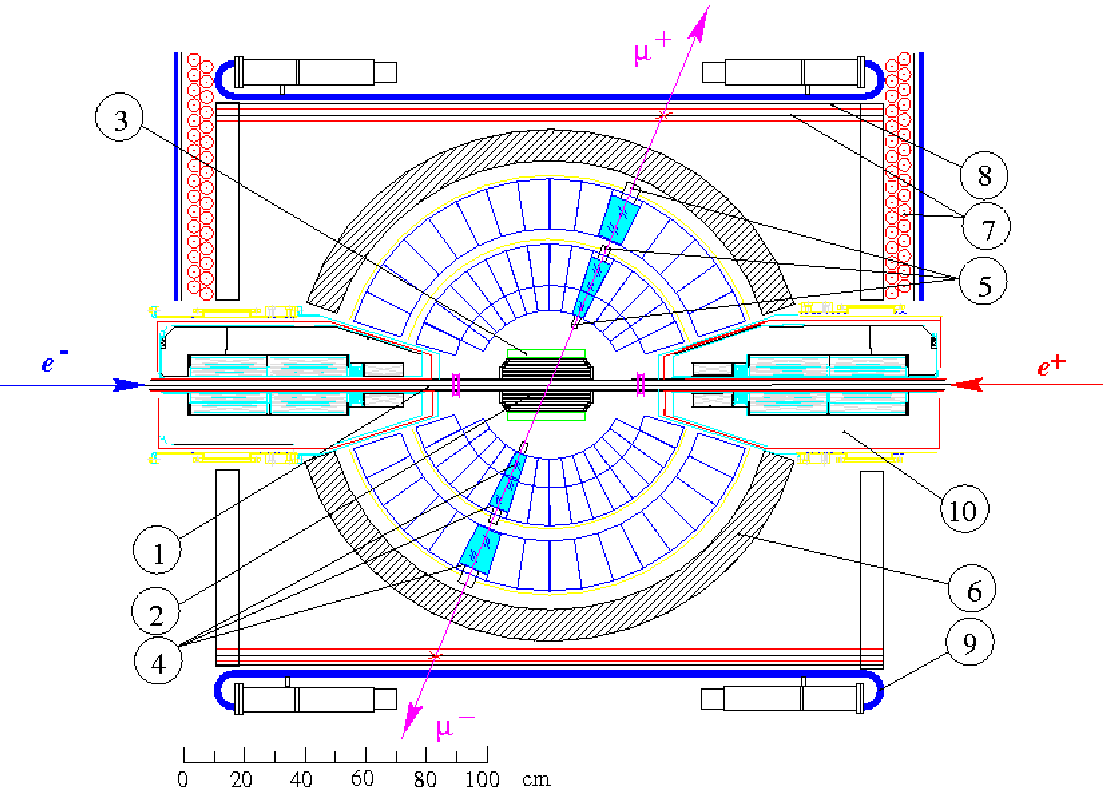
The SND is operated at the VEPP-2000 collider since 2010 till present day. It consists of a tracking system based on cylindrical drift and proportional chambers placed in a common gas volume, aerogel threshold counters ashif , a three-layer spherical electromagnetic calorimeter based on NaI (Tl) crystals and a muon system which includes two layers of proportional tubes and scintillation counters (figure 1). The calorimeter energy and angular resolutions depend on the photon energy as and . Its total solid angle is 95% of . The solid angle of the tracking system is 94 % of . Its angular resolution is and for the azimuthal and polar angles, respectively. The threshold Cherenkov counters are based on aerogel with the refractive index of 1.05. The threshold momenta for are approximately equal to 1.6 / 330 / 436 MeV/c, respectively. This system covers 60% of the total solid angle.
3 Analysis
The cross section of the process is measured as follows.
-
1.
The collinear events are selected.
-
2.
The selected events are sorted into the two classes: and using the energy depositions in the calorimeter crystals.
-
3.
The luminosity is determined from the number of events:
(1) Here , and are the number of events, detection efficiency and cross section of the process respectively. To obtain the number of events, the number of events is calculated using theoretical cross section as
(2) and then subtracted from the total number of and events. Here and are the detection efficiency and cross section of , respectively.
-
4.
The Born cross section of the process is calculated using formula:
(3) Here is a radiative correction, and are the number of events and the detection efficiency for the process .
The detection efficiency for each process is derived from the Monte Carlo simulation based on GEANT4 geant4 ; geant4-2 . Apparatus effects such as electronics noise, signal pile-up, actual time and amplitude resolutions of electronics channels, the bad channels are taken into account in the simulation.
Generation of , and events is performed by the MCGPJ mcgpj generator. It is based on formulae from arbuzqed ; arbuzhad . The generator takes into account initial and final state radiation (ISR and FSR), as well as Coulomb interaction in the final state. It allows one to calculate cross sections and radiative corrections with accuracy %. The simulation of the process is performed with the cut on the polar angles of the final electron and positron .
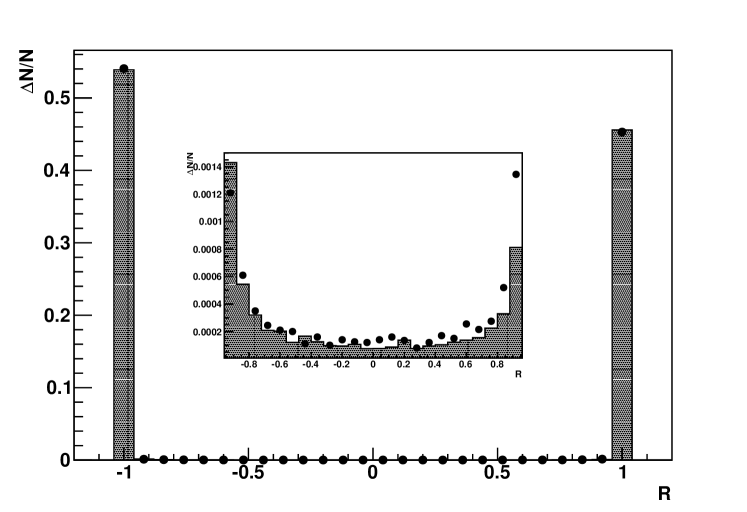
The , and events have different distributions of the energy deposition over calorimeter crystals. In events the electrons and positrons produce electromagnetic showers, with the most probable energy losses of about 0.92 of the initial particle energy. Muons lose their energy by ionization of the calorimeter material through which they pass. The charged pions lose energy due to ionization and nuclear interaction with the detector material. The separation parameter of and events (R) in the energy region 0.5 – 1.0 GeV is based on the differences in the energy deposition profiles. It was developed using machine learning method epi . The distribution of the separation parameter is shown in figure 2. The events are located in the region , while events are located at .
3.1 Events selection
During the data taking, the first-level trigger selects events with one or more tracks in the drift chamber and with the total energy deposition in the calorimeter greater than 100 MeV. During processing of the experimental data, event reconstruction is performed snd . For the further analysis the collinear events are selected using the following criteria.
-
1.
The number of charged particles . An event can also contain additional neutral particles due to beam background, nuclear interaction of charged pions, splitting of electromagnetic showers and initial and final state radiation.
-
2.
and , where and are the polar and azimuthal angles of charged particles with the largest energy deposition (particles in the event are ordered by the energy deposition), respectively.
-
3.
MeV, where is the energy deposition of the th charged particle.
-
4.
, where .
-
5.
cm, where is the distance between the track of the th particle and the beam axis.
-
6.
cm, where is the coordinate of the th particle vertex (point of the track closest to the beam axis) along the beams axis.
-
7.
The muon system veto is used for suppressing the cosmic background.
3.2 Subtraction of and cosmic background
In the event sample selected under these conditions, one has , , events, residual cosmic background, and a small contribution from reaction at .
The number of background events from the process is estimated as
| (4) |
where is a number of simulated events selected using the nominal conditions for collinear events, described above, and are the number of data and simulated events, respectively, selected under conditions:
-
1.
.
-
2.
The number of neutral particles .
-
3.
and .
-
4.
.
-
5.
, where is the of the kinematic fit of the event under hypothesis.
It is found that the background is maximal in the energy point MeV, where its fraction is less than 0.15%, corresponding to 37 background events.
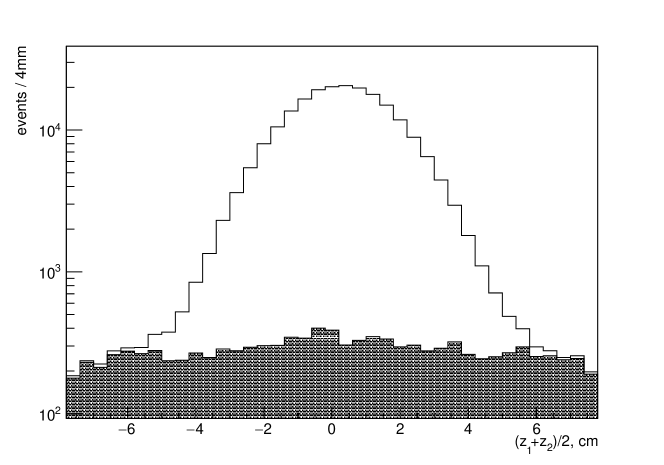
The cosmic events are suppressed by the muon system. The coordinate distribution of the production point for collinear events is shown in figure 3. The annihilation events have a Gaussian distribution peaked at , while the cosmic distribution is nearly uniform. As figure 3 shows, the muon subsystem veto () separates cosmic muons from the annihilation events.
The number of the residual cosmic events is estimated as follows
| (5) |
where is the number of collinear events selected using the nominal selection criteria, but with , and are the numbers of cosmic events with and , respectively. Two types of cosmic events are used:
-
1.
Collinear events with additional cuts: cm and cm.
-
2.
Events recorded in special cosmic runs satisfying the nominal selection criteria.
In both cases, the ratio is found to be equal to 2.5%0.1%.
3.3 Detection efficiency
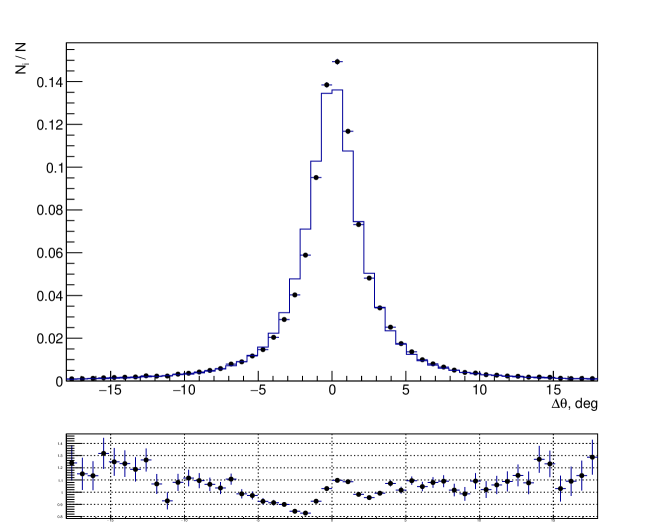
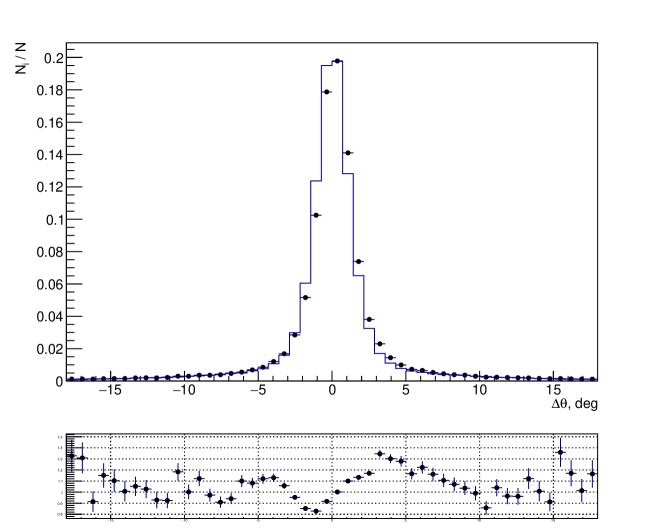
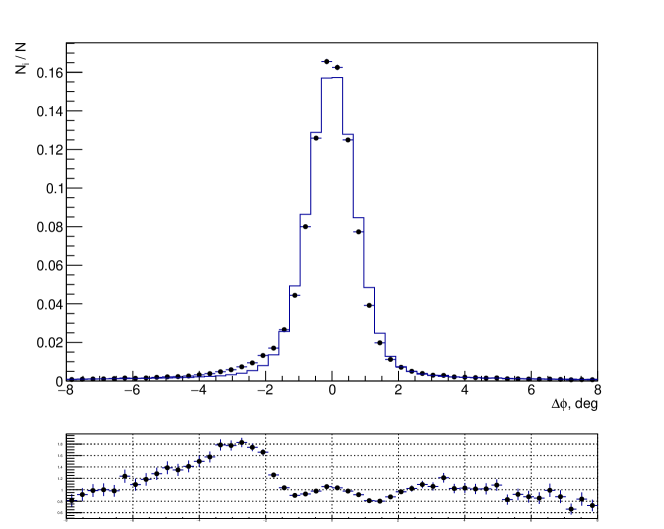
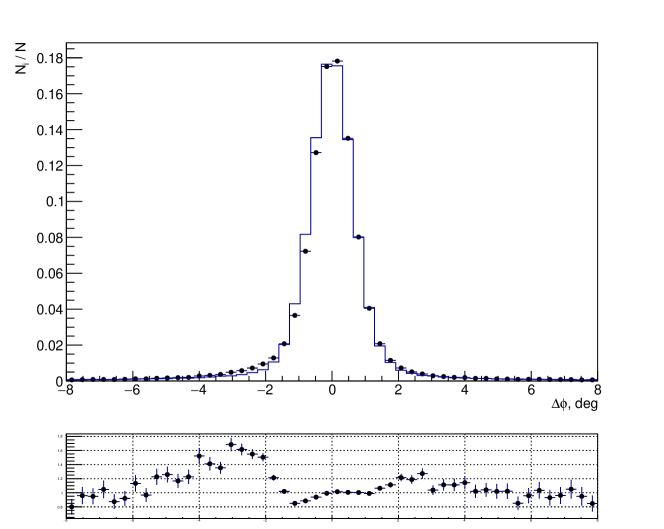
The and distributions for the and events are shown in figure 4, 5, 6 and 7. There are small differences in the shapes of the data and simulated spectra. The following values are used as a measure of the systematic uncertainty due to the and cuts:
| (6) |
Here
| (7) | ||||
| (8) |
where , and are the numbers of data and simulated events selected under the conditions on and indicated in parentheses. The and do not depend on energy. Their deviations from unity are taken as systematic errors. Thus the systematic uncertainty associated with the and cuts is .
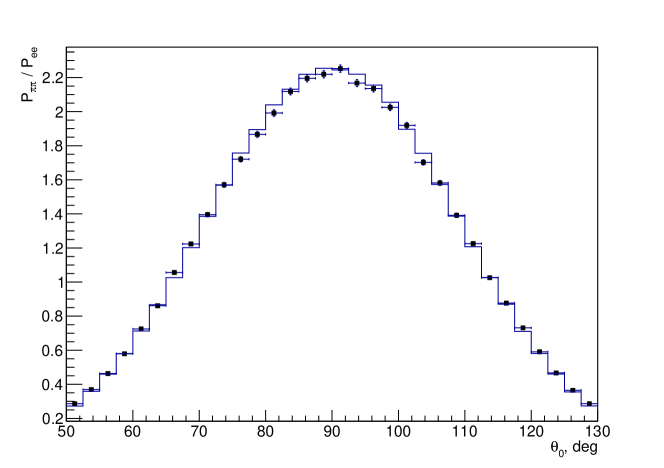
The ratio of the distributions for the and events is shown in figure 8. There are some differences between these ratios for data and simulated distributions. To estimate the systematic error due to the cut, the following ratio is used:
| (9) |
where
| (10) |
Here , , , are the numbers of and events summed over all energy points in experiment and simulation with . The largest deviation of from unity is equal to 0.005 (figure 9). This value is taken as a systematic error associated with cut.
Imperfection in simulation of pion nuclear interactions implies that the cut on the particle energy deposition leads to an inaccuracy in the detection efficiency of the process. To take this inaccuracy into account, the detection efficiency is multiplied by the correction coefficient. The correction coefficient is obtained by using pseudo events, which are constructed using events of the processes and epi . The corrections obtained using different types of pseudo events differ less than 0.005, they do not depend on the pion energy and their average is equal to 0.992. As a result, the correction coefficient is set equal to 0.992, and the difference is taken as a systematic error .
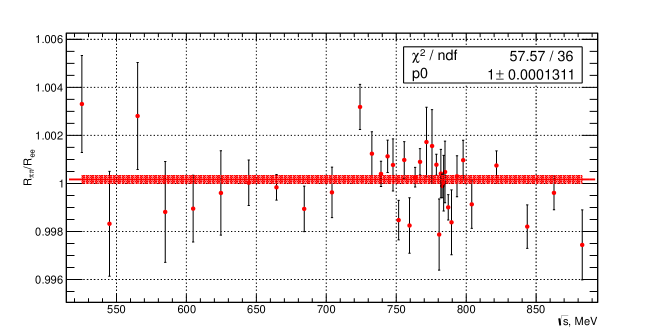
In the tracking system, the particle track can be lost due to reconstruction inefficiency. The probabilities and to find two tracks in the and events are determined using experimental data. Their ratio to probabilities derived from simulated events
| (11) |
can vary significantly in the different energy points. But the ratio , which contributes to the measured cross section, is energy independent and equal to unity with error (figure 10).
Pions can be lost due to the nuclear interaction in the detector material before the tracking system. The probability of pion loss is studied using events. It was found that the difference between these values in data and simulation is 0.002, which is taken as a systematic error %.
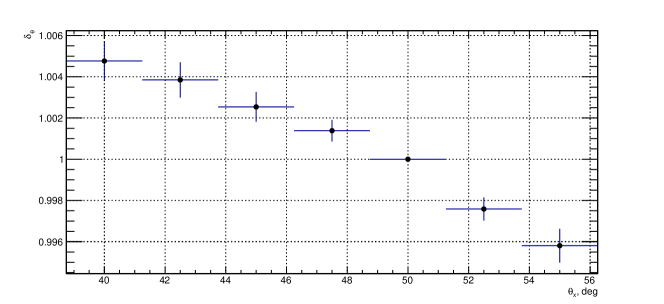
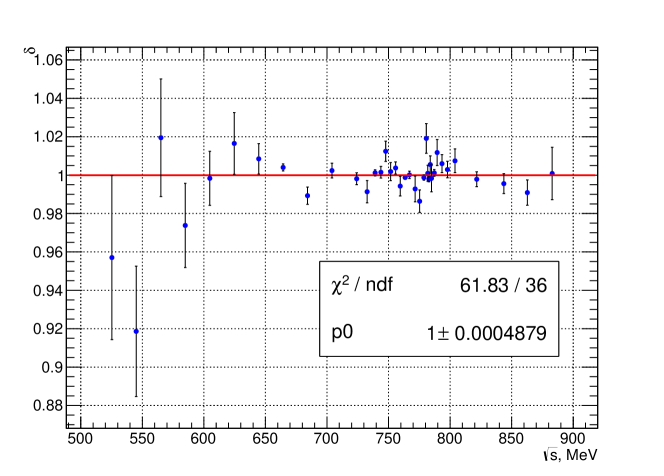
The use of the muon system veto for event selection () leads to inaccuracy in the determination of the measured cross section due to the uncertainty in the simulation of the muons and pions traversing the detector. To obtain the necessary corrections, the events close to the median plane , , ), where the cosmic background is minimal, are used. The correction is the ratio of the cross sections measured with () and without () using the muon system:
| (12) |
In the case of , a contribution of the residual cosmic muons background is estimated from the fit to the spectrum with a sum of the Gaussian and uniform distributions. The does not dependent on energy and its average value is consistent with 1 (figure 11). This indicates the absence of the systematic error related to the condition . Relatively high in figures 11 (1.71) and 10 (1.6) is due to the large devitions of 2–3 energy points. It’s caused by background contamination of the control samples (events with or only one reconstructed track) used in and calculations.
Trigger efficiency is greater than 99.9% for all types of collinear events due to the energy deposition cuts MeV. These cuts provide performance of the energy deposition threshold. Therefore systematic uncertainty from trigger inefficiency is considered to be negligible.
Uncertainties in simulation of energy depositions in the calorimeter can lead to an inaccuracy in e/ discrimination. The identification efficiency and related systematic error were studied in epi using pseudo– and pseudo– events. It varies with energy from 0.996 to 0.998 for the events and from 0.994 to 0.998 for the events. The systematic error of the cross section measurement due to cuts R and R does not exceed 0.002 at 650 MeV. Below 650 MeV, the value increases with decrease of energy and reaches 0.005 at =525.1 MeV.
3.4 Calculation of the cross section
The number of selected events in the regions 0 and 0 are:
| (13) |
where index indicates the events with 0 and 0 respectively; and are physical cross section and detection efficiency of the process with jj = in the final state, is a number of and cosmic background events, is the integrated luminosity. The detection efficiencies take into account the correction coefficients described above. Using the formula for , the cross section is calculated as
| (14) |
where
| (15) |
Subtraction of the background leads to additional contribution to the systematic error, which is estimated as follows:
| (16) |
The Born cross section for the process is calculated from as
| (17) |
The radiative correction , which takes into account the initial and final states radiation, is calculated using the MCGPJ generator. The value of depends on the cross section at lower energies, and it is therefore calculated iteratively. The iteration stops when its value changes by less than 0.05% in consecutive iterations. The correction for the center of mass energy spread is taken into account also. The spread does not exceed 0.3 MeV in the energy region below 1 GeV, and the correction is less than 0.1%.
The measured cross section is presented in table 1. The systematic errors of the cross section determination are listed in table 2.
| , MeV | , nb | , nb | , nb | |
|---|---|---|---|---|
| 525.1 | 203.412.32.4 | 210.412.72.5 | 4.40.30.1 | 209.712.72.5 |
| 544 | 224.410.12.5 | 232.510.52.6 | 50.20.1 | 231.910.42.6 |
| 565.2 | 23512.32.4 | 244.312.82.5 | 5.50.30.1 | 243.812.82.5 |
| 585 | 254.210.72.5 | 26511.12.6 | 6.20.30.1 | 264.811.12.6 |
| 604.8 | 328.88.73 | 344.79.23.1 | 8.30.20.1 | 344.89.23.1 |
| 624.8 | 366.411.13.2 | 386.111.73.4 | 9.70.30.1 | 386.711.73.4 |
| 644.6 | 4388.23.7 | 464.28.73.9 | 12.10.20.1 | 465.68.73.9 |
| 664.5 | 525.93.54.4 | 561.33.74.7 | 15.30.10.1 | 563.73.74.7 |
| 684.4 | 642.18.45.3 | 689.195.6 | 19.50.30.2 | 692.99.15.7 |
| 704.2 | 798.110.36.5 | 860.711.17 | 25.40.30.2 | 865.511.17 |
| 724.1 | 1030.49.58.3 | 1112.610.39 | 34.20.30.3 | 1116.610.39 |
| 739.1 | 1146.45.69.2 | 1233.769.9 | 39.10.20.3 | 123469.9 |
| 743.8 | 1200.99.89.7 | 1289.410.610.4 | 41.30.30.3 | 1288.110.610.4 |
| 747.7 | 121514.49.8 | 1301.615.410.5 | 420.50.3 | 1298.715.410.5 |
| 751.7 | 1199.413.79.7 | 1281.414.710.3 | 41.70.50.3 | 1276.614.610.3 |
| 755.7 | 1246.510.810 | 1327.911.510.7 | 43.50.40.4 | 1321.311.410.6 |
| 759.6 | 1288.317.310.4 | 136818.311 | 45.20.60.4 | 1360.318.210.9 |
| 763.6 | 1263.4510.2 | 1336.85.210.8 | 44.50.20.4 | 1328.95.210.7 |
| 767.8 | 1249.16.910.1 | 13177.210.6 | 44.20.20.4 | 13107.210.5 |
| 771.6 | 1290.322.210.4 | 1356.523.310.9 | 45.90.80.4 | 1351.723.210.9 |
| 775.7 | 1290.917.210.4 | 1353.61810.9 | 46.20.60.4 | 1353.21810.9 |
| 778.6 | 12575.310.1 | 1311.15.510.5 | 450.20.4 | 1307.45.510.5 |
| 780.7 | 1198.918.49.7 | 1229.218.99.9 | 42.30.70.3 | 1211.418.69.8 |
| 782 | 1104.811.28.9 | 1106.911.28.9 | 38.20.40.3 | 1074.710.98.7 |
| 782.9 | 1058.14.88.5 | 1039.84.78.4 | 360.20.3 | 9994.58 |
| 783.7 | 1004.911.68.1 | 971.911.37.8 | 33.70.40.3 | 925.210.77.5 |
| 784.7 | 959.212.87.7 | 916.812.27.4 | 31.90.40.3 | 865.811.67 |
| 786.7 | 913.55.17.4 | 872.34.87 | 30.40.20.2 | 819.14.56.6 |
| 789.5 | 934.614.17.5 | 903.113.77.3 | 31.70.50.3 | 850.912.96.9 |
| 793.9 | 890.4107.2 | 867.89.77 | 30.70.30.2 | 823.19.26.6 |
| 797.7 | 858.910.16.9 | 836.39.96.7 | 29.80.40.2 | 795.89.46.4 |
| 804 | 819.510.56.6 | 791.410.16.4 | 28.60.40.2 | 755.49.66.1 |
| 821.8 | 654.85.65.3 | 608.75.24.9 | 22.80.20.2 | 58354.7 |
| 843.4 | 496.65.84 | 4385.13.6 | 17.10.20.1 | 420.44.93.4 |
| 862.7 | 382.24.63.1 | 321.23.92.6 | 130.20.1 | 3093.72.5 |
| 883.2 | 303.26.72.5 | 242.15.32 | 10.20.20.1 | 233.55.11.9 |
| Error | at MeV, % | at MeV, % |
|---|---|---|
| 0.1–0.2 | 0.3–0.5 | |
| 0.0–0.2 | 0.3–0.7 | |
| 0.2 | ||
| 0.5 | ||
| 0.5 | ||
| 0.2 | ||
| 0.2 | ||
| total | 0.8 | 0.9–1.2 |
3.5 Fit to the measured cross section
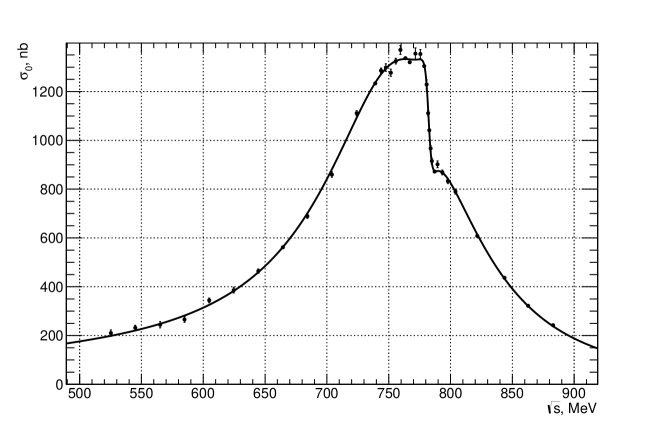
In the framework of the vector meson dominance model, the cross section of the process is
| (18) |
where is the phase space factor:
| (19) |
The transition amplitudes are given by
| (20) |
where
| (21) | ||||
| (22) |
Here, denotes the final state of the vector meson decay, is the vector meson mass, and is the relative interference phase between the vector mesons V and , and, hence, .
The following forms of the energy dependence of the vector meson total widths are used:
| (23) | ||||
| (24) |
Here, , is the phase space factor for the final state snd-3pi4 , is the branching fraction of the vector meson decay to the final state . In the energy dependence of the and mesons widths only the decays are taken into account. Such approach is justified in the energy region MeV. The relative decay probabilities are calculated as follows
| (25) | ||||
| (26) | ||||
| (27) |
The fit to the measured cross section is performed with the following free parameters , , , , and . The values of , , , are taken from pdg . The relative phase is fixed at according to ref. snd2pi . Only uncorrelated errors of the cross section are taken into account in the fit. The results of the fit (figure 12) together with the results of the SND measurements at the VEPP-2M collider snd2pi-2 are presented in table 3. The products
| (28) |
are also presented in table 3.
The ratio between the measured cross section and the fit curve is shown in figure 13. The systematic errors of and are related to the model uncertainty. It is estimated by comparison of the central values of these parameters presented in table 3 with the results of the fit with a model based on the Gounaris-Sakurai parametrization kmd2-2 ; arbuzhad . If the and are free parameters of the fit, their values are in agreement with those presented in PDG pdg , and the value of is shifted by . This difference is taken as the systematic uncertainty of the .
| Parameter | This work | SND06 |
|---|---|---|
| MeV | 775.3 0.5 0.6 | 774.6 0.4 0.5 |
| MeV | 145.6 0.6 0.8 | 146.1 0.8 1.5 |
| nb | 1189.7 4.5 9.5 | 1193 7 16 |
| , nb | 31.5 1.2 0.6 | 29.3 1.4 1.0 |
| , deg. | 110.7 1.1 1.0 | 113.7 1.3 2.0 |
| , nb | 2.4 0.6 | 1.8 0.2 |
| 47/30 | – | |
| (4.889 0.015 0.039) | (4.876 0.023 0.064) | |
| (1.318 0.051 0.021) | (1.225 0.058 0.041) |
3.6 Contribution to the
The contribution to the anomalous magnetic moment of the muon due to intermediate state in the vacuum polarization is calculated via the dispersion integral
| (29) |
where is the known kernel g-2-1 and
| (30) | ||||
| (31) |
Here (table 1) is the bare cross section of the process (the cross section without vacuum polarization contribution but taking into account the final state correction):
| (32) |
where is the polarization operator calculated according to the ref. arbuzqed from the known cross section fedor . The last factor takes into account the final state radiation for the point-like pion shw .
The integral (29) is evaluated by using the trapezoidal rule. As a result it is obtained
The difference between this value and one, calculated with a fit curve, is taken as additional source of the systematics.
4 Discussion
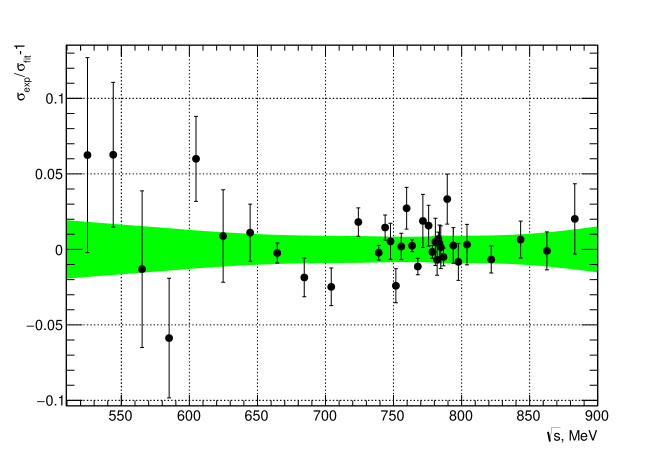
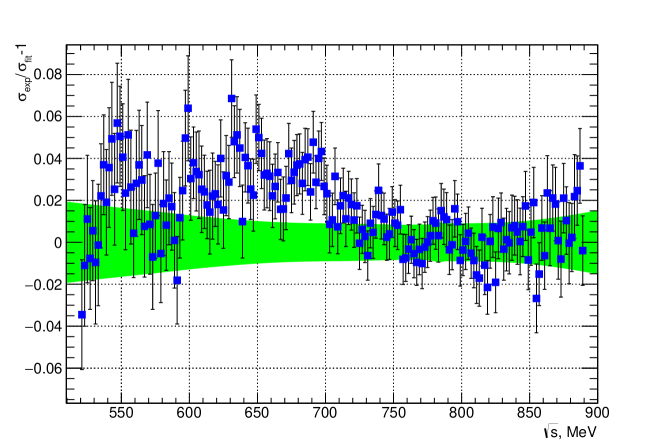
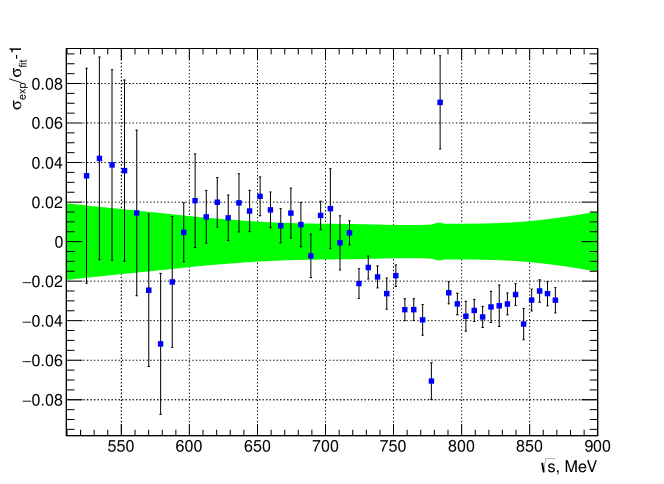
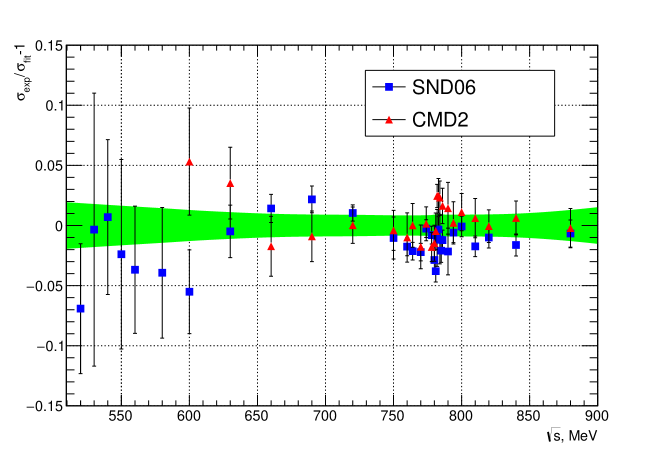
The comparison of the cross section obtained in this work with the results babar ; kloe-2pi ; snd2pi ; kmd2-3 is shown in figure 14, 15, 16. The difference of 3% between SND and BABAR data is observed in the energy region 0.62 0.7 GeV, while outside it the SND and BABAR data are consistent (figure 14). The deviation between the KLOE and SND data is 1–3% at 0.7 GeV. Below 0.7 GeV, the measurements are consistent (figure 15). The results obtained in this work and in experiments at VEPP-2M are in agreement (figure 16).
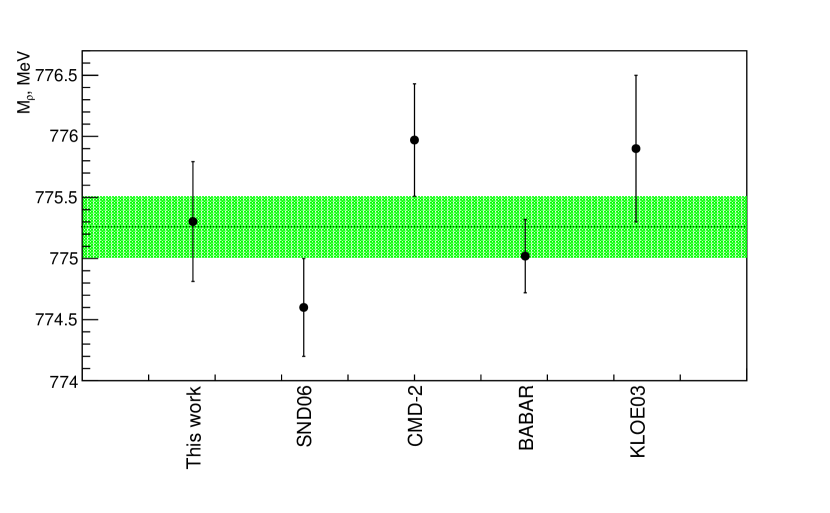
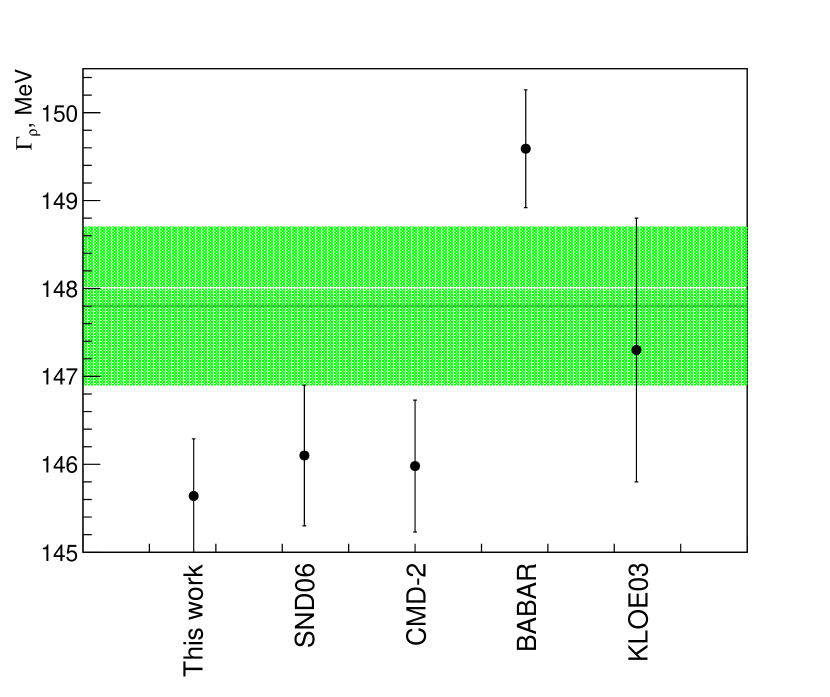
The parameters of the and mesons obtained in this analysis are consistent with the results of snd2pi-2 (table 3 ). The meson mass is in agreement with the results of earlier experiments snd2pi-2 ; kmd2-3 ; babar ; kloe-3pi (figure 17). Its width agrees with results of ref. snd2pi-2 ; kmd2-3 ; kloe-3pi and contradict to the value reported by BaBar babar (figure 18). To understand the source of the latter difference, we perform BABAR cross section fit in the energy region 0.525-0.883 GeV using our model (18). The obtained meson width is 147.38 MeV 0.47 MeV. We conclude that the discrepancy can be partially explained by difference between the fitting models.
The differences between obtained in this work and those derived from snd2pi-2 ; babar do not exceed one standard deviation, and there is a discrepancy between KLOE kloe-2 ; kloe-3 ; kloe-4 and SND results (table 4).
| Measurement | |
|---|---|
| This work | 409.79 1.44 3.87 |
| SND06 | 406.47 1.74 5.28 |
| BaBar | 413.58 2.04 2.29 |
| KLOE | 403.39 0.72 2.50 |
5 Conclusion
The cross section of the process has been measured in the SND experiment at the VEPP-2000 collider in the energy region MeV. The systematic error of the measurement is 0.8% at MeV and 0.9–1.2 % at MeV. The measured cross section has been analyzed in the framework of the generalized vector meson dominance model. The following meson parameters have been obtained:
The parameters of the -parity suppressed process has been measured:
the relative phase between and mesons
The result of this work is in agreement with VEPP-2M measurements, but is in conflict with BaBar and KLOE measurements. The contribution to the anomalous magnetic moment of the muon has been derived from the measured cross section: .
Acknowledgements.
The authors are grateful to B. Malaescu and A. Keshavarzi for useful discussions. The work is supported in part by grants RFBR 18-02-00382-a, 18-02-00147-a, 20-02-00347-a, 20-02-00139-a, 20-02-00060-a.References
-
(1)
M.N.Achasov et al.,
Spherical neutral detector for VEPP-2M collider,
Nucl. Instr. Meth. A 449 (2000) 125
- (2) M.N. Achasov et. al., Spherical Neutral Detector for experiments at VEPP-2000 collider, in proceedings of International Workshop on ee collisions from Phi to Psi, September 19 – 22, 2011 Novosibirsk, Russia, Nucl. Phys. Proc. Suppl. 225-227 (2012) 66
- (3) D.E. Berkaev et al., Electron-positron collider VEPP-2000. First experiments, Zh. Eksp. Teor. Fiz. 140 (2011) 247
- (4) I. Logashenko et. al., The Measurement of the Anomalous Magnetic Moment of the Muon at Fermilab, J. Phys. Chem. Ref. Data 44 (2015) 031211
- (5) I.B. Logashenko et al., Measurement of the hadronic cross sections at Novosibirsk, in proceedings of International Conference Dark Matter, Hadron Physics and Fusion Physics, September 24 – 26, 2014 Messina, Italy, EPJ Web Conf. 96 (2015) 01022
- (6) N. N. Achasov and A. A. Kozhevnikov Electromagnetic form factor of the pion in the field-theory-inspired approach Phys. Rev. D 85, 019901 (2012)
-
(7)
J.E. Augustin et al.,
Study of Electron-Positron Annihilation into at 775 MeV with the Orsay Storage Ring, Phys. Rev. Lett. 20, 126, (1968)
-
(8)
J.E. Augustin et al., production in collisions and interference,
in proceedings of
4th Rencontres de Moriond : Les Interactions Électromagnétiques
11-21 March 1969 Moriond, France, Nuovo Cim. Lett. 2, 214, (1969)
- (9) J.E. Augustin et al., Study of electron-positron annihilation into on the o resonance, Phys. Lett. B 28, 508, (1969)
-
(10)
V.L. Auslender et al., Investigation of the -meson resonance with electron-positron colliding beams, Phys. Lett. B 25, 433, (1967)
- (11) V.L. Auslander et al., Investigation of the rho-meson resonance with electron-positron colliding beams Yad. Fiz. 9, 114, (1969) [Sov. J.Nucl. Phys. 9, 69, 1969]
- (12) D. Benaksas et al., production by annihilation in the energy range with the Orsay storage ring, Phys. Lett. B 39, 289, (1972)
- (13) A. Quenzer et al., Pion form factor from 480 MeV to 1100 MeV, Phys. Lett. B 76, 512, (1978)
- (14) I.B. Vasserman et al., Pion Form-Factor Measurement from Near Threshold by electron-Positron Colliding Beams, Yad. Fiz. 28, 968, (1978)
- (15) A.D. Bukin et al., Pion form factor measurement by in the energy range 2E from 0.78 up to 1.34 GeV, Phys. Lett. B 73, 226, (1978)
- (16) I.B. Vasserman et al., Measurement Of Pion Form-factor In Reaction Near Production Threshold, Yad. Fiz. 30, 999, (1979) [Sov.J.Nucl.Phys. 30 (1979) 519]
- (17) I.B. Vasserman et al., Pion Form-factor Measurement in the Reaction for Energies Within the Range From 0.4-GeV to 0.46-GeV, Yad. Fiz. 33, 709, (1981) [Sov. J. Nucl. Phys. 33, 368, (1981)]
- (18) L.M. Kurdadze et al., Measurement of the pion form factor at 640 1400 MeV, JETP Lett. 37, 733, (1983) [Pisma Zh. Eksp. Teor. Fiz. 37, 613, (1983)]
- (19) L.M. Kurdadze et al., Study Of The Reaction In The Energy Range From 640-mev - 1400-mev, Yad. Fiz. 40, 451, (1984) [Sov. J. Nucl. Phys. 40, 286, (1984)]
- (20) S.R. Amendolia et al., Measurement of the pion form factor in the time-like region for values between 0.1 and 0.18 , Phys. Lett. B 138, 454, (1984)
- (21) L.M. Barkov, et al., Electromagnetic pion form factor in the timelike region, Nucl. Phys. B 256, 365, (1985)
-
(22)
R.R. Akhmetshin et al., Measurement of cross-section with CMD-2 around -meson, Phys. Lett. B 527, 161, (2002) [arXiv:hep-ex/0112031]
- (23) R.R. Akhmetshin et al., Update: A reanalysis of hadronic cross section measurements at CMD-2, Phys. Lett. B 578, 285, (2004) [arXiv:hep-ex/0308008]
- (24) A. Aloisio et al., Measurement of and extraction of below 1 GeV with the KLOE detector, Phys. Lett. B 606, 12, (2005) [arXiv:hep-ex/0407048]
-
(25)
M.N. Achasov et. al., Study of the process in the energy region 4001000 MeV, J.Exp.Theor.Phys. 101 (2005) no.6, 1053-1070, [Zh.Eksp.Teor.Fiz. 128 (2005) no.6, 1201-1219] [arXiv:hep-ex/0506076]
- (26) M.N. Achasov et.al., Update of the cross section measured by the spherical neutral detector in the energy region 400 1000 MeV, J.Exp.Theor.Phys. 103 (2006) 380-384 [Zh.Eksp.Teor.Fiz. 130 (2006) 437-441][arXiv:hep-ex/0605013]
- (27) V.M. Aulchenko et. al., Measurement of the cross section with the CMD-2 detector in the 370–520-MeV energy range, JETP Lett. 84 (2006) 413-417, [Pisma Zh.Eksp.Teor.Fiz. 84 (2006) 491-495][arXiv:hep-ex/0610016]
- (28) R.R. Akhmetshin et al, High-statistics measurement of the pion form factor in the -meson energy range with the CMD-2 detector, Phys.Lett. B 648 (2007) 28-38 [arXiv:hep-ex/0610021]
- (29) A. Ambrosino et. al., Measurement of and the dipion contribution to the muon anomaly with the KLOE detector, Phys. Lett. B 670 (2009) 285-291 [arXiv:0809.3950]
- (30) F. Ambrosino et. al., Measurement of from threshold to 0.85 using initial state radiation with the KLOE detector, Phys. Lett. B 700 (2011) 102-110 [arXiv:1006.5313]
- (31) A. Anastasi et. al., Measurement of the running of the fine structure constant below 1 GeV with the KLOE Detector, JHEP 1803(2018) 173 [arXiv:1609.06631]
-
(32)
B. Aubert et. al., Precise Measurement of the Cross Section with the Initial State Radiation Method at BABAR, Phys. Rev. Lett. 103 (2009) 231801
- (33) J.P. Lees et. al., Precise measurement of the cross section with the initial-state radiation method at BABAR, Phys. Rev. D 86 (2012) 032013 [arXiv:1205.2228]
- (34) M. Ablikim et. al., Measurement of the cross section between 600 and 900 MeV using initial state radiation, Phys.Lett. B 753 (2016) 629-638 [arXiv:1507.08188]
- (35) A.Yu. Barnyakov et. al., Testing aerogel Cherenkov counters with n = 1.05 using electrons and muons, Prib.Tekh.Eksp. 1 (2015) 37 [Instrum.Exp.Tech. 58 (2015) 30]
-
(36)
E.V. Abakumova et al.,
A system of beam energy measurement based on the
Compton backscattered laser photons for the VEPP-2000 electron-positron
collider,
Nucl. Instr. Meth. A 744 (2014) 35-40 [arXiv:1310.7764]
- (37) E.V. Abakumova et al., Backscattering of Laser Radiation on Ultrarelativistic Electrons in a Transverse Magnetic Field: Evidence of MeV-Scale Photon Interference, Phys.Rev.Lett. 110 (2013) no.14, 140402 [arXiv:1211.0103]
-
(38)
S. Agostinelli et. al., Geant4–a simulation toolkit, Nucl. Instr. Meth. A 506, 250 (2003)
- (39) J. Allison et. al., Geant4 developments and applications, IEEE Trans. on Nucl. Science 53, 270 (2006)
- (40) G.V. Fedotovich, A.I. Sibidanov, Monte Carlo generator with radiative corrections for the and processes at low energies, Nuc. Phys. B Proc. Suppl. 131 (2004) 9-18
- (41) A.B. Arbuzov et al., Large angle QED processes at colliders at energies below 3 GeV, JHEP 9710, 001 (1997) [arXiv:hep-ph/9702262]
- (42) A.B. Arbuzov et al., Radiative corrections for pion and kaon production at colliders of energies below 2 GeV, JHEP 9710, 006 (1997) [arXiv:hep-ph/9703456]
- (43) M.N. Achasov, K.I. Beloborodov and A.S. Kupich, Separation of and events using SND detector calorimeter, JINST 12T 01002 [arXiv:1611.07729]
- (44) R. R. Akhmetshin et al., Search for the process with the CMD-3 detector, Phys. Lett.B 740, 273 (2015) [arXiv:1409.1664]
- (45) M.N. Achasov, K.I. Beloborodov, A.V. Berdyugin et. al., Study of the process in the energy region below 0.98 GeV, Phys. Rev. (2003) Vol. 68D, 052006 [arXiv:hep-ex/0305049]
- (46) M. Tanabashi et al. (Particle Data Group) Review of Particle Physics, Phys. Rev. D 98, 030001 (2018).
- (47) K.Hagiwara, R.Liao, A.D.Martin, D.Nomura and T.Teubner. and re-evaluated using new precise data. J. Phys. G 38, 085003 (2011) [arXiv:1105.3149]
- (48) F. Ignatov https://cmd.inp.nsk.su/ignatov/vpl/
- (49) J.Schwinger, Particles, Sources and Fields, vol.II, Addison-Wesley Publishing Company Advanced Book Program Reading, Massachusetts, 1973
- (50) A. Anastasi et al., Combination of KLOE measurements and determination of in the energy range 0.10 0.95 , JHEP 1803 (2018) 173 [arXiv:1711.03085]
- (51) A. Aloisio et al., Study of the decay with the KLOE detector, Phys.Lett. B 561 (2003) 55-60 [arXiv:hep-ex/0303016]