A photochemical model of ultraviolet atomic line emissions in the inner coma of comet 67P/Churyumov-Gerasimenko
Abstract
Alice ultraviolet spectrometer onboard Rosetta space mission observed several spectroscopic emissions emanated from volatile species of comet 67P/Churyumov-Gerasimenko (hear after 67P/C-G) during its entire escorting phase. The measured emission intensities, when the comet was at around 3 AU pre-perihelion, have been used to derive electron densities in the cometary coma assuming that H I and O I lines are solely produced by electron impact dissociative excitation of cometary parent species (Feldman et al., 2015). We have developed a photochemical model for comet 67P/C-G to study the atomic hydrogen (H I 1216, 1025, & 973 Å), oxygen (O I 1152, 1304, & 1356 Å), and carbon (C I 1561 & 1657 Å) line emissions by accounting for major production pathways. The developed model has been used to calculate the emission intensities of these lines as a function of nucleocentric projected distance and also along the nadir view by varying the input parameters, viz., neutral abundances and cross sections. We have quantified the percentage contributions of photon and electron impact dissociative excitation processes to the total intensity of the emission lines, which has an important relevance for the analysis of Alice observed spectra. It is found that in comet 67P/C-G, which is having neutral gas production rate of about 1027 s-1 when it was at 1.56 AU from the Sun, photodissociative excitation processes are more significant compared to electron impact reactions in determining the atomic emission intensities. Based on our model calculations, we suggest that the observed atomic hydrogen, oxygen, and carbon emission intensities can be used to derive H2O, O2, and CO, abundances, respectively, rather than electron density in the coma of 67P/C-G, when comet has a gas production rate of 1027 s-1.
keywords:
comets , comets, coma , comets, composition , comet 67P/Churyumov-Gerasimenko , Photochemistry1 Introduction
The recent Rosetta space mission, orbited, escorted, rendezvoused comet 67P/Churyumov-Gerasimenko (hereafter 67P/C-G) and unravelled many unexplored details, with an unprecedented spatial and temporal resolution, which were not possible by earlier missions. Alice ultraviolet spectrometer onboard Rosetta is designed to observe various spectroscopic emissions in the wavelength region 700–2050 Å and has studied the evolution of neutral environment around comet 67P/C-G during its entire escorting phase, i.e. 2014 August to 2016 September (Stern et al., 2007; Feldman et al., 2015, 2016, 2018; Chaufray et al., 2017; Noonan et al., 2018). The initial observations made at near-nucleus on comet 67P/C-G, during the end of September to November 2014 when the comet was at around 3 AU from the Sun, have shown many atomic spectral features (Feldman et al., 2015). By observing H I (Lyman- : 1216 Å, Lyman- : 1026 Å, & Lyman- : 972 Å), C I (1561 & 1657 Å) and O I (1152, 1304, & 1356 Å) emissions on 67P/C-G, Feldman et al. (2015) suggested that suprathermal electron impact dissociative excitation of neutral species is the main generation process for these atomic line emissions. Chaufray et al. (2017) have analysed Alice spectra obtained during 2014 December, 2015 March, and 2015 May, when comet 67P/C-G was at around 3, 2, and 1.5 AU from the Sun, respectively, and concluded that suprathermal electron density is not varying as a function of cometocentric radial distance. Besides atomic H I, O I and C I emissions, Feldman et al. (2018) have recently reported fourth positive, Cameron band, and Hopefield-Birge band emissions of CO molecule from the 2015 January 30 and 2016 May 14 observed spectra when the comet was at 2.5 AU pre-perihelion and 3 AU post-perihelion, respectively.
Rosetta Orbiter Spectrometer for Ion and Neutral Analysis (ROSINA) onboard Rosetta was continuously monitoring the evolution of gaseous environment during the entire mission period using both the spectrometers, viz., Double Focusing Mass Spectrometer (DFMS) and Reflection-type Time-Of-Flight (RTOF), as well as COmet Pressure Sensor (COPS). ROSINA could study the dynamical variation of the neutral and ion environment of cometary coma with the highest ever possible temporal and spatial resolution (Balsiger et al., 2007; Hässig et al., 2015; Le Roy et al., 2015; Hoang et al., 2017; Fougere et al., 2016; Bieler et al., 2015; Gasc et al., 2017). The first-ever in-situ detection of molecular oxygen in comets is one of the surprising results from the ROSINA observations. The ROSINA-DFMS neutral density measurements from September 2014 to April 2015, when the comet was moving from 3.2 to 2 AU towards the Sun, have shown that O2 relative abundances are varying between 0.5 and 15% with respect to H2O (Bieler et al., 2015).
By making in-situ measurements around 67P/C-G, the evolution of cometary ionospheric parameters was monitored by Rosetta Plasma Consortium (RPC) instruments. Ion and Electron Sensor (IES), which is a part of RPC, is designed to study the three-dimensional distribution of both ions and electrons (Burch et al., 2007). The initial RPC-IES measurements of suprathermal electron spectra, when the comet was around 3 AU, have shown that these electrons are accelerated to several hundred electron volts of energy in the cometary coma (Clark et al., 2015). The plasma studies of Galand et al. (2016) at 3 AU have also shown that suprathermal electrons play a more significant role than solar photons in controlling the cometary ionosphere. But the role of solar photons increased when the comet was moving towards the Sun and was significant compared to suprathermal electrons in the cometary coma (Heritier et al., 2017, 2018).
Since the observed various atomic emissions depend on neutral species distribution in the cometary coma and also different energetic particles, such as solar photons and suprathermal electrons, it is essential to model the emission intensities by accounting for all production and loss mechanisms of various excited species to understand the photochemistry of cometary coma. Several excitation processes have been proposed in the earlier modelling works for H I, O I, and C I emissions (Combi et al., 2004, 1998; Bhardwaj et al., 1996; Bhardwaj, 1999). Photon and electron impact dissociative excitation and solar resonance fluorescence of cometary neutrals were considered to be major excitation mechanisms for all the allowed transitions (Feldman et al., 2004).
In this paper, we have modelled various Alice observed ultraviolet atomic hydrogen (H I Lyman emissions at 1216, 1026, & 972 Å), carbon (C I 1561 & 1657 Å), and oxygen (O I 1152, 1304, & 1356 Å) emissions by accounting for major excitation mechanisms, viz., photon and electron impact initiated reactions and solar resonance fluorescence of cometary species. The main aim of the current work is to quantify the contributions of electron and photon impact dissociative excitation processes in 67P/C-G coma, which produce the Alice observed spectral lines. The required model input parameters, viz., the neutral composition of cometary coma, solar photon flux, photon and electron impact cross sections of major species are described in Section 2. In Section 3, we have described the method of calculation for suprathermal thermal electron flux and the ultraviolet emission intensities along the Alice line of sight. More details of calculation of steady-state suprathermal electron spectra in the cometary coma can be found in our earlier work (Bhardwaj, 1999; Bhardwaj et al., 1995, 1996; Bhardwaj and Haider, 2002; Bhardwaj and Raghuram, 2011, 2012). The major results obtained from the model calculations are presented in Section 4. In this section, we have also studied the sensitivity of the calculated intensities to several parameters : neutral abundances and cross sections. These results are discussed in Section 5. The complete work has been summarized and concluded in Section 6.
2 Model input parameters
2.1 Neutral composition of cometary coma
In the model, H2O, CO2, CO, and O2 have been considered as primary neutral constituents of the coma. Based on the ROSINA in-situ measurements, H2O production rate is taken as 2 1027 s-1 and CO2, CO and O2 relative abundances with respect to water are considered as 2.5, 2, and 4%, respectively, (Hansen et al., 2016; Hässig et al., 2015; Bieler et al., 2015). This model input chemical composition resembles the cometary neutral environment of 67P/C-G, when it was at 1.56 AU from the Sun on 25 May 2015, during which Alice made spectroscopic observations (Chaufray et al., 2017). We have also calculated nadir intensities of different atomic emissions when the comet was at 1.99 AU. The variation in the ROSINA-DFMS measured gas production rate and relative abundances of primary species are taken from Fougere et al. (2016), Hansen et al. (2016), and Hoang et al. (2017) and tabulated in Table 1. Based on the ROSINA-DFMS measurements, we have varied the relative abundances and gas production rates of the neutrals in our model to discuss the effect on the calculated H I, O I, and C I emission intensities.
| Date | ra | H2Ob | CO2c | COc | O2c |
|---|---|---|---|---|---|
| (AU) | (s-1) 1026 | (%) | (%) | (%) | |
| 2015 Mar. 29 | 1.99 | 1.8–12.5 | 1.6–4 | 0.7–2 | 1.5 |
| 2015 May 15 | 1.56 | 15.3–80 | 3–6 | 1–7 | 5 |
2.2 Solar radiation flux
Solar radiation flux was obtained from the Solar EUV Experiment (SEE) instrument onboard Thermosphere Ionosphere Mesosphere Energetics and Dynamics (TIMED) spacecraft measurement in the wavelength region 5–1900 Å (http://lasp.colorado.edu/see/; Woods et al., 2005) and has been scaled as a function of an inverse square of heliocentric distance of the comet. We took into account the comet-Sun-Earth phase angle to extrapolate the solar flux measurements to the comet for the given day of Alice observation.
2.3 Photon and electron impact cross sections
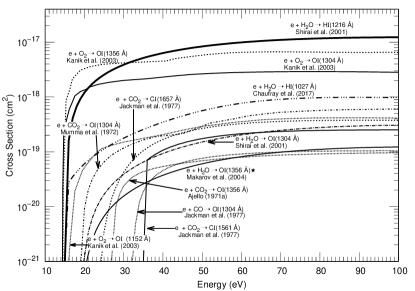
Total photoabsorption and photoionization cross sections for primary cometary species are taken from Huebner et al. (1992). The electron impact total inelastic cross sections of H2O, CO2 and CO are taken from Shirai et al. (2001); Itikawa (2002); Liu and Victor (1994), respectively. The photon and electron dissociative emission cross sections of neutral species are presented in Figure 1. Due to the lack of measured cross sections, several assumptions are made to incorporate some important dissociative excitation processes. The impact of our assumed cross sections on the calculated emission intensities will be discussed in Section 4.1.

2.3.1 Cross sections for atomic hydrogen Lyman emissions: H I 1216, 1026, 972 Å
Cross section for the emissions of H I (Lyman-, Lyman-, & Lyman-) by photodissociation of H2O between 375–825 Å were taken from Hans et al. (2015) and are in agreement with the earlier measurements of Wu and Judge (1988). By reviewing various measured electron impact cross sections of H2O, Itikawa and Mason (2005) recommended Morgan and Mentall (1974) reported values for H I Lyman- emission. Shirai et al. (2001) analytically fitted various atomic hydrogen and oxygen emission cross sections for electron impact on H2O based on the measurements from Möhlmann et al. (1978) and Morgan and Mentall (1974), respectively. We have noticed that there is a discrepancy, which will be discussed later, between Itikawa and Mason (2005) and Shirai et al. (2001) cross sections for H I Lyman- emission. We have used Shirai et al. (2001) cross section to calculate H I Lyman- emission via electron impact on H2O in the model.
The recent measured various atomic oxygen and hydrogen emission cross sections via electron impact dissociative excitation of H2O at 100 and 200 eV, are from Makarov et al. (2004). The cross section ratio of H I Lyman-/Lyman- (H I Lyman-/Lyman-) from these measurements at electron energy of 200 eV is 8 (30.5). In order to construct the cross section for H I Lyman- emission via electron impact on H2O, Feldman et al. (2015) reduced Itikawa and Mason (2005) suggested H I Lyman- cross section by a factor 8 (Chaufray et al., 2017). To incorporate H I Lyman- and H I Lyman- emission processes via electron impact on H2O, we have also reduced Shirai et al. (2001) H I Ly- cross section by the corresponding cross section ratios from the measurements of Makarov et al. (2004), that are determined at 200 eV.
2.3.2 Cross sections for atomic oxygen emissions: O I 1152, 1304, and 1356 Å
Wu and Judge (1988) have measured different atomic hydrogen and oxygen emission cross sections by dissociating H2O using the photons in the energy range 15–20.5 eV. They have also extensively discussed all the possible H2O photodissociative channels and also emissions from the dissociated species (See Table 1 of Wu and Judge, 1988). Based on the sensitivity of their instrument, they set an upper limit of the cross section for all the unobserved emissions as 5 10-21 cm2 in the measured wavelength region. The suggested quantum yield of all the unobserved emissions was 2.2 10-4 in the wavelength region 600–825 Å. We have used this yield to estimate the O I 1152, 1304, and 1356 Å emission cross sections for photodissociative excitation of H2O.
The O I 1304 Å emission cross sections for photodissociation of CO and CO2 are taken from Wu and Judge (1979). We could not find the directly measured O I 1152, 1356 Å emission cross sections for photodissociative excitation of CO and CO2 in the literature. However, Lee et al. (1975) measured fluorescence cross section for photodissociative fragments of CO and CO2 in the wavelength region 175–800 Å and the observed total emission cross section is attributed to various onsets of atomic carbon and oxygen emissions. Due to the proximity in the threshold energies, we have assumed that the cross section for O I 1304 Å emission via photodissociative excitation CO and CO2 is same as that of O I 1152 and 1356 Å. The effect of our assumption on the calculated total oxygen emission intensities will be discussed in Section 4.1.
Carlson (1974) measured O I 7774 Å (5P 5S) and 1302 Å resonant multiplet (3S 3P) emission cross sections by photodissociative excitation of O2 in the wavelength regions 730–780 Å and 650–850 Å, respectively. The O I 7774 Å emission leads to the formation of excited O(5S) which subsequently decay to ground O(3P) state by producing photons at wavelength 1356 Å, provided if it does not collisionally quench by surrounding cometary species. Zhou et al. (2014) measured the photodissociation cross sections of O2 producing O(3S) and O(5S) states, which are the excited states of O I 1302 Å and 1356 Å emissions, respectively, in the energy range 14.64–15.20 eV (815–847 Å). They found that the production of O(5S) is higher than that of O(3S) in the photodissociation of O2 with a mean dissociative excitation cross section ratio of 1.5. To incorporate O I 1356 Å emission emission via photodissociation of O2 in our model, we have multiplied Carlson (1974) measured O I 1302 Å cross sections by a factor 1.5. The mean electron impact cross section ratio of O2 for the production of O I 1152 to O I 1304 Å is about 2.8 (Kanik et al., 2003). We have assumed that this branching ratio is same for the photodissociation of O2. So we have divided Carlson (1974) measured O I 1304 Å cross section by a factor 2.8 to calculate the O I 1152 Å emission intensity via O2 photodissociation.
We have used Shirai et al. (2001) suggested O I 1304 Å emission cross section for electron impact on H2O. Based on the Makarov et al. (2004) cross sections measurements on H2O at 200 eV (100 eV), we have determined the electron impact dissociative excitation cross section ratios of H I Lyman-/O I 1152 (O I 1304/1356) as 29 (1.5). These ratios have been used to reduce Shirai et al. (2001) H I Lyman- and O I 1304 cross sections, respectively, to incorporate electron impact on H2O producing O I 1152 and O I 1356 Å emissions in the model. The O I 7774 Å emission cross section by electron impact of H2O is taken from Beenakker et al. (1974).
The O I 1356 Å emission cross section by electron impact of CO2 is taken from Ajello (1971a). We have considered the cross sections for O I 1304 Å emission by electron impact of CO and CO2 from Ajello (1971b) and Itikawa (2002), respectively. Ajello (1971b) also determined emission cross section ratio of O I 1356/1304 for electron impact on CO at 100 eV as 0.85. So we have multiplied Ajello (1971b) O I 1304 cross section with this factor to obtain O I 1356 emission cross section for electron impact on CO.
Kanik et al. (1995) and Kanik et al. (1993) determined the O I 1152 Å emission cross section by electron impact of CO and CO2 at 200 eV as about 3.5 10-19 cm2, respectively. This cross section value is higher (lower) by a factor 2 to the Ajello (1971b) (Itikawa, 2002) measured O I 1304 emission cross section. So we have scaled the Ajello (1971b) and Itikawa (2002) O I 1304 Å emission cross sections with the corresponding scaling factor to incorporate O I 1152 Å emission via electron impact on CO and CO2, respectively. The O I 1152, 1304 and 1356 Å emission cross sections by electron impact dissociative excitation of O2 are taken from Kanik et al. (2003).
2.3.3 Cross sections for atomic carbon emissions : C I 1561 and 1657 Å
The C I 1561 and 1657 Å emission cross sections by photodissociation of CO and CO2 are considered from Wu and Judge (1981) and Wu et al. (1978), respectively, and these emission cross sections for the electron impact on CO2 are taken from Ajello (1971a). We have followed the approach of Bhardwaj et al. (1996) to consider the C I 1561 and 1657 Å emission cross sections for the electron impact of CO, which earlier has been used by Paxton (1985) to calculate these emission intensities on Venus.
3 Description of model calculations
The neutral atmospheric density profiles of cometary species are calculated using Haser’s formula, which assumes spherical expansion of volatiles into the space (Haser, 1957). Neutral gas expansion velocity from the nucleus is taken as 1 km/s. The solar photons, in the wavelength region 5–1900 Å, have been degraded in the cometary neutral atmosphere. The primary photoelectron energy spectrum is calculated using the following expression.
| (1) |
where
| (2) |
Here and are the absorption and ionization cross sections (cm2) at wavelength , respectively, and is the number density (cm-3) at radial distance of the neutral species. is unattenuated solar photon flux (cm-2 s-1) at the top of atmosphere. is the optical depth of the medium at solar zenith angle . and are radius of comet (taken as 2 km) and top of the atmosphere (taken as 105 km), respectively. We have used Analytical Yield Spectrum (AYS) approach to calculate steady state photoelectron flux in the cometary coma. The AYS method of degrading electrons in the neutral atmosphere can be explained briefly in the following manner. Mono-energetic electrons incident along the radial axis in an infinite medium are degraded in a collision-by-collision manner using the Monte Carlo technique. The energy and position of the primary electron and its secondary and tertiary are recorded at the instant of an inelastic collision. The total number of inelastic events in the spatial and energy bins, after the incident electron and all its secondaries and tertiaries have been completely degraded, is used to generate numerical yield spectra. These yield spectra contain the information about the electron degradation process and can be employed to calculate the yield for any inelastic event. The numerical yield spectra, generated in this way, are fitted by an analytical expression to provide AYS. This yield spectrum can be used to calculate the steady state photoelectron flux. More details of the AYS approach and the method of photoelectron computation are given in several previous papers (Singhal and Haider, 1984; Bhardwaj et al., 1990, 1996; Singhal and Bhardwaj, 1991; Bhardwaj and Michael, 1999; Bhardwaj, 2003, 1999; Haider and Bhardwaj, 2005; Bhardwaj and Jain, 2009; Bhardwaj and Raghuram, 2012). The photoelectrons are degraded based on the local energy deposition approximation, hence this method of calculation of suprathermal electron flux is valid within the inner coma where the strong collisional coupling between neutrals and electrons exist. When gas production rate of comet is low (about 1026 or less), this assumption is not valid since electrons can not transfer energy efficiently to the surrounding neutrals due to low gas density. This model does not account for interaction between cometary nucleus surface generated photoelectrons and solar wind electrons with the neutral species of coma.
Volume emission rates for different excited species are calculated by using degraded photon and suprathermal electron flux profiles and corresponding excitation cross sections. The emission intensities of various spectral lines, as a function of nucleocentric projected distance, are obtained by integrating the volume emission rates along the Alice line of sight and converting brightness in Raleigh (1 R = 106/4 photons cm-2 s-1 sr-1). When the Alice spectrometer is pointed towards 67P/C-G nucleus, the nadir intensities are calculated by integrating the volume emission rates from surface of the nucleus to spacecraft distance on the illuminated part of the line of sight.
To incorporate the resonance fluorescence mechanism for the allowed atomic transitions, neutral density profiles of atomic oxygen and carbon are calculated by solving the continuity equation as described by Bhardwaj et al. (1996). Atomic hydrogen number density profile is calculated using Haser’s formula. There is a discrepancy (about an order of magnitude) between Haser’s calculated and the direct simulation of Monte-Carlo (DSMC) modelled atomic hydrogen number density profiles and its impact on the calculated emission intensity will be discussed in Section 4.1.3. Resonance fluorescence efficiencies for H I Lyman-, Lyman-, Lyman-, O I 1304, C I 1561 and 1657 Å are taken as 2.88 10-3, 3.84 10-6, 7.33 10-7, 2.22 10-6, 3.08 10-5, and 1.1 10-5 s-1, respectively, at 1 AU (Gladstone et al., 2010; Meier, 1995; Woods et al., 1986) and these values are scaled to the corresponding heliocentric distances of comet 67P/C-G.
Most of the emissions considered in this work are due to spontaneous decay and the lifetime of the excited species is about a few nanoseconds, except for O I 1356 Å (180 s). Hence, the collisional quenching is not a significant loss mechanism in removing the excited H I, O I, and C I states compared to radiative decay. Owing to a small radiative lifetime ( 1 s), the excited species cannot travel to a large radial distance in the cometary coma from the origin of production before emitting photons via radiative decay, hence, the radial transport of these species can be neglected. When a comet is having gas production rate about 1028 s-1, the 1/r2 dependence of the neutral number densities reflects the optically thin cometary coma for the radial distances above 10 km (Vigren and Galand, 2013; Bhardwaj, 2003). Hence, the emission intensities are calculated assuming optically thin condition in the coma, which is a reasonably good approximation for a low water production comet of 67P/C-G (1027 s-1).
4 Results
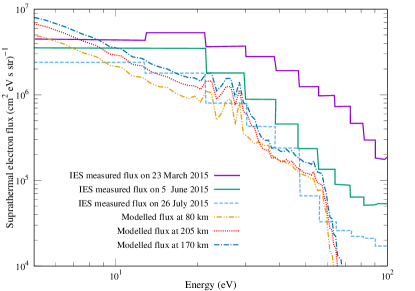
The modelled suprathermal electron fluxes along with the daily-averaged RPC-IES measurements made on 2015 March 23, June 5, and July 26 (Madanian et al., 2016, 2017) are shown in Figure 2. During these observations, Rosetta was at 2.0, 1.5 and 1.26 AU heliocentric distances and orbiting at radial distances of 80, 205, and 170 km away from the nucleus, respectively. For the calculation of photoelectron flux on these days, we have taken the respective total gas production rates as 2 1026, 3 1027, and 1 1028 s-1 from Rosina-DFMS measurements (Hansen et al., 2016). The peaks between 20 and 30 eV in the modelled suprathermal flux are mainly due to photoionization of H2O by solar He II 304 Å photons, while the fall above 60 eV is due to a sharp decrease (about two orders of magnitude) in solar flux in the wavelength region 125 – 175 Å.

The calculated volume emission rate profiles for H I Lyman emissions (Ly-, Ly-, & Ly-) via different excitation mechanisms, when the comet was at heliocentric distance of 1.56 AU, are shown in Figure 3. This calculation shows that the solar resonance fluorescence is the dominant excitation source for H I Ly- emission in the entire coma compared to the dissociative excitation of H2O via photons and suprathermal electrons. For H I Ly- (Ly-) emission, the photodissociation of H2O is the major source for the radial distances below 30 (100) km above which solar resonance fluorescence is the significant excitation mechanism. This calculation also shows that the production of H I emission lines via electron impact excitation of H2O is an order of magnitude lower compared to the photodissociative excitation of H2O.
The modelled volume emission rate profiles of O I 1152, 1304 and 1356 Å emissions, when the comet was at heliocentric distance of 1.56 AU, are presented in Figures 4, 5, and 6, respectively. It is found that photodissociative excitation of molecular oxygen is the primary source of O I emissions followed by H2O photodissociation. The contribution of total electron impact on O-bearing neutrals is more than an order of magnitude smaller compared to photodissociative excitation. Above radial distances of 150 km, resonance fluorescence is the dominant source of O I 1304 Å emission (see Fig. 5).
Our model calculated volume emission rate profiles for C I emissions via different excitation mechanisms are shown in Figure 7. These calculations show that photodissociative excitation of CO is the most dominant source in producing C I 1561 (1657) Å emission followed by photodissociative excitation of CO2 for radial distances below 50 (30) km. The resonance fluorescence of atomic carbon is the dominant source for radial distances larger than 300 km. The calculated volume emission rates for electron impact on CO and CO2 are found to be smaller by an order of magnitude compared to respective photodissociative excitation rates.
We have calculated the limb intensity profiles for H I Lyman- emission as a function of cometocentric projected distance for the Alice observational conditions on 2015 May 25, which is shown in Figure 8. By varying the H2O production rate within the ROSINA measured limits, i.e., from 3.5 to 7 1027 s-1, we find a good correlation between the modelled and Alice observed H I Lyman- intensity profiles (Chaufray et al., 2017). In this case, we have also calculated H I Lyman-/H I Lyman- intensity ratio as a function of cometocentric projected distance. By varying the H2O production rate, as mentioned before, we could not find a significant change (5%) in the modelled H I emission ratio.
By considering various dissociative excitation channels of carbon and oxygen bearing species, the calculated limb intensity profiles for O I (1152, 1304, 1356 Å), C I (1561 and 1657 Å) emissions are shown in Figure 9. In this figure, we have also presented the O I and C I emission brightness ratio as a function of projected distances on the right Y-axis. The modelled O I 1304/1356 Å (O I 1152/1304 Å) brightness ratios are found to be increasing (decreasing) with increasing projected distance, whereas the calculated C I 1657/1561 Å emission ratio is around 2 for the projected distances less than 1000 km.


We have made calculations on 2015 March 29, when the comet was at 1.99 AU from the Sun, during which the Alice spectrometer was pointed towards nucleus and the solar phase angle was about 80∘. By varying the chemical composition in the cometary coma, the modelled and observed H I (Ly-), O I (1304 and 1356 Å) and C I (1657 Å) intensities are presented in Table 2. In this case, since our modelled photoelectron flux is smaller by a factor 5 or more compared to the RPC-IES observation (see Figure 2), we have used RPC-IES measured photoelectron flux by assuming its magnitude vary as a function of inverse of the distance to the nucleus in the inner coma (Edberg et al., 2015). Even by using RPC-IES measured photoelectron flux in the model, we find photodissociative excitation reactions play a significant role (a factor of 5 or more) than the electron impact excitation reactions. At this heliocentric distance, H2O production rate () is found to vary in the range 2–12.5 1026 s-1 (see Table 1 and Hansen et al., 2016). When we use as 2 1026 s-1, the modelled emission H I Lyman- intensity is consistent with the Alice observation, whereas the calculated O I emission intensities are smaller by a factor of about 4. In this case, the calculated C I emission intensity is smaller by more than an order of magnitude. Considering as 12.5 1026 s-1 and for the previously mentioned relative abundances of other species, the model determined O I intensities are close to Alice observation and the calculated H I (C I) nadir emission intensities are higher by a factor 5 (lower by an order of magnitude) compared to the observation. In this case, contrary to the model calculations, the observed O I 1304 Å emission intensity is higher than that of O I 1356 Å. By increasing the gas production rate, we find the calculated O I and C I emission intensities are close to the Alice observation by changing O2 and CO relative abundances to 1 and 8% with respect to water, respectively. By varying the gas production rate and relative abundances of other species, we could not find a set of neutral parameters which can explain all the observed emission intensities simultaneously.
| Date | rc | H2O | H I Lyman- | O2b | O I 1304 Å | O I 1356 Å | CO2 b | COb | C I 1657 Å | ||||
|---|---|---|---|---|---|---|---|---|---|---|---|---|---|
| (AU) | (s-1 1026) | (R)a | (%) | (R) | (R) | (%) | (%) | (R) | |||||
| Obs. | Cal. | Obs. | Cal. | Obs. | Cal. | Obs. | Cal. | ||||||
| 2015 March 29 | 1.99 | 2.0 | 12.3 2.1 | 11.90 | 1.5 | 9.18 1.96 | 1.1 | 7.24 1.63 | 1.66 | 4 | 2 | 3.11 1.93 | 0.08 |
| 12.5 | 70.19 | 1.5 | 6.46 | 9.82 | 4 | 2 | 0.48 | ||||||
| 12.5 | 69.90 | 1.0 | 5.16 | 7.36 | 4 | 8 | 1.69 | ||||||
aThe calculated emission intensities are in Rayleigh; bRelative abundances with respect to H2O production rate; cHeliocentric Distance of the comet; Obs. is Alice observed (see Table 2 of Feldman et al., 2018) and Cal. is model calculated emission intensities;
4.1 Effect of input parameters on the calculated line emission intensities
4.1.1 Neutral abundances
ROSINA’s DFMS and RTOF sensors observed that the CO and CO2 relative abundances are dynamically varying in the coma due to inhomogeneous out-gassing of nucleus on 2015 May 15 (see Hoang et al., 2017, and references there in). To assess the impact of model calculated atomic carbon intensities on neutral composition, we have increased CO2 relative abundance from 3 to 6% by keeping CO at 2% with respect to water. For this new composition, the contributions of both CO2 and CO photodissociative excitations are nearly equal (50%) to the total C I 1561 and 1657 Å emission intensities.
For the calculations made on 2015 May 15, the impact of molecular oxygen on the O I emission intensities has been studied by decreasing O2 relative abundance from 4 to 0.5%. Even with O2 density reduced by a factor 8, the molecular oxygen largely (50%) controls the O I emission intensities; the contribution of O2 photodissociative excitation is five times higher than that of H2O for O I 1152 Å. In this case, about 50–60% of the total for O I 1304 and 1356 Å intensities are controlled by photodissociation of O2. By increasing molecular O2 abundance higher than 4% with respect to water, the modelled O I emission intensities are found to increase linearly and the contribution from H2O photodissociation can be completely neglected. In all these cases, electron impact dissociative excitation processes are negligible (1%) in determining O I emission intensities.
4.1.2 Cross sections
Hans et al. (2015) reported H2O photodissociative excitation cross section producing H I Lyman emissions in the wavelength region 375–825 Å whereas, Wu et al. (1979) measurement was limited to 600–800 Å. By using the Wu et al. (1979) measured cross section in the model, we find that the calculated photodissociative volume excitation rate of H2O is decreased by a factor 2.
Shirai et al. (2001) recommended electron impact cross section of H2O, producing H I Lyman- emission, is higher than that of Itikawa and Mason (2005). The cross section ratio of Shirai et al. (2001) to Itikawa and Mason (2005) at 100 eV (at 25 eV) is about 1.5 (5). By replacing Shirai et al. (2001) recommended cross section with Itikawa and Mason (2005), no significant change in the model calculated total H I emission intensities is seen since most (95%) of this emission is controlled by solar resonance fluorescence of hydrogen atoms.
Based on Wu and Judge (1988) experimentally determined yield, we have assumed the cross sections for photodissociative excitation of H2O producing O I 1304 and 1356 Å emissions are same as that of O I 1152 Å. As shown in Figures 4 to 6, dissociative excitation H2O is the second largest process which contributes to the total O I emission intensity. Since most of the UV photons in the wavelength region 600–800 Å ionize H2O rather than producing emissions via dissociative excitation (Huebner et al., 1992), we do not expect the actual cross section value to be an order of magnitude higher to the assumed value in this model. We found that the contribution of H2O to total O I emissions is not significant (1%) even on increasing photodissociative cross sections by a factor 2.
The dissociative excitation of O-bearing species, which leads to O(5P) formation, produce O I 7774 Å emission subsequently contribute to O I 1356 Å line. We have considered the O(5P) formation channel for the photodissociation of O2 and also for the electron impact excitation of H2O in the model. The additional contribution of O I 7774 Å to O I 1356 Å emission intensity is about 10% via photodissociation of O2 and 50% for electron impact on H2O. We could not include H2O photodissociation which produce O I 7774 Å emission in the model due to non-availability of cross section. We do not expect this dissociative excitation mechanism would significantly alter our calculated O I 1356 Å intensity since the photodissociation of O2 majorly (90%) controls this emission.
Zhou et al. (2014) measured O2 dissociative excitation cross section producing O(3S) for a limited wavelength region (815 – 850 Å). This cross section is smaller by an order of magnitude compared to the measurement of Carlson (1974). By using Zhou et al. (2014) cross section, we find that photodissociative excitation rate of O2 producing O I 1304 Å emission is decreased by two orders of magnitude. In this case photodissociation of H2O is a dominant production source in the formation of O I 1304 emission. However, Zhou et al. (2014) measured photodissociative excitation cross section restrained to a small wavelength band which does not implicate the total photochemical process in cometary coma.
We have not accounted for CO2 and CO photodissociative excitation cross sections, which produce O I 1152 and 1356 Å emissions, in our model due to the lack of reported cross sections in the literature. On assuming these emissions cross sections are same as that of 1304 Å (as measured by Wu and Judge, 1979), we could not find any significant change in the total O I 1152 and 1356 Å emission intensities. This is mainly due to photodissociation of O2 is the dominant production source of O I 1304 Å line, which is an order of magnitude higher compared to any other dissociative excitation processes (see Figure 5).

4.1.3 Minor atomic densities
The model calculated atomic carbon, oxygen, and hydrogen number density profiles are plotted in Figure 10, for a water production rate of 5 1027 s-1, along with DSMC modelled H I and O I number densities (Tenishev et al., 2008). These atomic oxygen (hydrogen) densities are consistent with DSMC values for radial distances above 10 km (below 20 km). The DSMC model accounts for momentum exchange between water and highly energetic hydrogen atoms produced via dissociation while calculating H I densities, whereas our model number densities are based on Haser’s radial expansion model does not account for collisions, which is the main reason for the discrepancy between number density profiles. Even on using DSMC modelled atomic hydrogen number density profile in the model, we find solar resonance fluorescence is the dominant source of H I Lyman- emission, whereas, photodissociation of H2O is the significant excitation source of H I Lyman- and emissions for radial distances below 1000 km.
5 Discussion
The primary assumption in the analysis of Alice observed H I, O I, and C I emissions on comet 67P/C-G is that the electron impact excitation is the major source of these emissions (Feldman et al., 2015, 2016; Chaufray et al., 2017; Feldman et al., 2018). However, earlier modelling works have shown that these emissions are majorly governed by resonance fluorescence of solar photons at corresponding wavelengths and dissociative excitation of cometary volatiles by photon and photoelectron (Bhardwaj et al., 1996; Combi et al., 2000, 2004; Feldman et al., 2004). Our photochemical model calculations, when the comet was at 1.56 AU from the Sun, show that photodissociative excitation is the major source of these emissions (except for H I Lyman-) for radial distances below 100 km and the role of electron impact reactions is small (see Figures 3–7).
5.1 On the role of suprathermal electrons in producing atomic emissions
Our modelled suprathermal electron fluxes on 2015 June 5 and July 26, when comet 67P/C-G was at 1.5 and 1.26 AU from the Sun with respective gas production rates as 3 1027 and 1 1028 s-1, are consistent with RPC-IES daily-averaged measurements in the energy range 10–60 eV (see Figure 2). But the modelled flux on 2015 March 23, when the comet was at 2 AU from the Sun with a gas production rate of 2 1026 s-1, is smaller compared to RPC-IES measurement for the energy above 20 eV (by a factor 5 or more). This discrepancy could be mainly due to less frequent collisions between suprathermal electrons and cometary species in a low gas production rate comet. Since our model calculations are based on the local degradation approximation, the calculated suprathermal electron flux at 2 AU heliocentric distance is not in agreement with the RPC-IES observation.
The threshold energies for dissociative excitation of major cometary species, which produce atomic emissions, is more than 15 eV (see Fig. 1). Hence, the lower ( 15 eV) component of suprathermal electron flux spectrum does not play any role in determining the volume emission rates of atomic excited states. Even though the electron impact excitation cross section is maximum around 100 eV, since the suprathermal electron flux for energies more than 100 eV decreases rapidly by several orders of magnitude (Madanian et al., 2016, 2017; Clark et al., 2015; Broiles et al., 2016) the role of this high (100 eV) energetic component in producing atomic emissions can be neglected. If electron impact is the only excitation mechanism in the coma, then about 80% the atomic emission intensities is determined by the suprathermal electron flux in the energy range 15–70 eV.
We have also quantified the contribution of solar photons and suprathermal electrons in producing atomic emissions for 2015 March 29 observation, when the comet was at 2 AU and having a gas production rate of 2 1026 s-1 with CO2, CO and O2 volume mixing ratios 4, 2, and 1.5%, respectively, by varying the RPC-IES measured suprathermal electron flux magnitude as inverse distance to nucleus in the cometary coma. We find the role of solar photon is higher by a factor of 5 (2.5) or more than electron impact excitation in producing atomic H I and O I (C I) emissions. Similarly, on using RPC-IES measured suprathermal electron flux in the model at 1.5 AU, we find no significant change in the calculated emission intensities. Based on these calculations, we suggest that the role of photons is considerably higher than suprathermal electrons (about a factor 2 or more) in governing atomic emission lines when comet 67P/C-G was at heliocentric distances 2 AU or below.
5.2 Implications for formation processes of H I, O I, and C I emissions
Our calculated volume emission rates clearly show that photodissociation of H2O contributes to the total H I Lyman- emission by an order of magnitude higher compared to solar resonance fluorescence close to the cometary surface (see Figure 3). Feldman et al. (2018) also found that the contribution from resonance scattering for H I Lyman- emission is negligible in the Alice observations. It should be noted that the Rosetta was orbiting at radial distances around 90 km on 2015 March 29 while Alice was making nadir observations, hence the contribution from solar resonance fluorescence in the nadir observed HI Lyman- intensity can be neglected.
Even if we neglect the electron impact dissociative excitation completely, our model calculated H I Lyman- line intensity can be in agreement with the Alice observations (see Figures 3 and 8). This clearly suggests that the photodissociative excitation of H2O is the major source for the Alice observed H I Lyman- emission below 50 km projected distances and the contributions from electron impact excitation and solar resonance fluorescence can be neglected. As discussed in Section 4, the electron impact on H2O could not be a dominant excitation process in producing H I emissions even on using higher cross sections (by a factor of 2 to 4 larger compared to Itikawa and Mason (2005) recommended values). Since photodissociative excitation of H2O is the major production mechanism for the observed H I Lyman emissions, we suggest that the observed emission intensities are suitable to derive water production rates rather than the electron density when the comet is closer to the perihelion.
The model calculations show that despite having H2O as the dominant O-bearing species in cometary coma, photodissociation of O2 is the major source for producing O I emissions viz., 1152, 1304, and 1356 Å (see Figures 4, 5, and 6). This is mainly due to the large difference (more than three orders of magnitude, see Figure 1) between H2O and O2 photodissociation cross sections. Moreover, the difference in the magnitudes of solar flux in dissociative wavelength regions 150–650 Å (for H2O) and 700–850 Å (for O2) also play an important role in determining the photodissociation rates and subsequently O I emission intensities.
The photochemical origin of O I 1152 Å emission in cometary spectra is thought to be due to solar resonance fluorescence of O(1D – 0D), which is an analogous emission mechanism of C(1D – 1P0) at 1931 Å (Bhardwaj, 1999; Combi et al., 2004). This emission line has been detected on comet C/2001 A2 (LINEAR) by Far ultraviolet spectroscopic explorer (FUSE) satellite. The observed emission intensity could not be explained by the previously suggested excitation process and is attributed to the presence of an enigmatic source (Feldman et al., 2002; Combi et al., 2004). Our model calculations show that photodissociation of O2 and H2O can populate oxygen atoms directly in 0D state (see Figure 4). Based on our previous O(1D) model calculations done for 67P/C-G and several other comets (Raghuram et al., 2016; Bhardwaj and Raghuram, 2012; Raghuram and Bhardwaj, 2013), we argue that the resonance fluorescence is not a significant emission process for O I 1152 Å line in comets. Moreover, the radiative lifetime of O(1D) is about 110 s, unlike C(1D) state (which is 4077 s, Tozzi et al., 1998), during which it has to fluoresce solar photons at wavelength 1152 Å. Our model calculations clearly indicate that even on reducing O2 abundance to 0.5%, the total O I 1152 Å emission intensity is majorly controlled by the photodissociation of O2 (90%). Hence, we suggest that this emission can be considered as a proxy to measure the O2 abundance in 67P/C-G coma.
Among the atomic oxygen line emissions considered in this work, the O I 1356 Å is due to a spin forbidden transition (5S 3P). Owing to a very small g-factor (10-8 s-1), the observation of this cometary line is mainly attributed to electron impact dissociative excitation processes and has been used to establish the presence of photoelectrons in the cometary coma (Feldman et al., 2004). Our model calculations (see Figure 6) show that photodissociation of O2 is the major source of this emission compared to earlier assumed electron impact excitation of O-bearing species. If our assumed emission cross section for the photodissociation of H2O is realistic (see Section 2), then in the case of comets deprived of molecular oxygen, dissociative excitation of H2O can be a major production mechanism in determining the O I 1356 Å emission intensity. Our model calculations clearly show that electron impact excitation on O-bearing species plays a minor role (1% to the total) in producing this emission. Hence, we suggest that the observation of O I 1356 Å line necessarily need not represent the presence of electron impact excitation reactions in the cometary coma.
To our knowledge, there are no reported cross sections for OI 1356 Å emission for photodissociation of H2O in the literature. The small value of cross section (5 10-21 cm2, Wu and Judge, 1988) and long radiative lifetime of the excited state (180 ms) inhibits the determination of dissociative excitation cross section of H2O over wide range of wavelength in the laboratory (Makarov et al., 2003; Kanik et al., 2003). Moreover, the formation thresholds of O(5S) and O(3S) (which are the corresponding excited states of O I 1356 and 1304 Å emissions) are about 14.2 eV (873 Å) and 14.5 eV (854 Å), respectively, and higher than the ionization threshold of H2O (12.6 eV). Haddad and Samson (1986) have determined that the H2O photoionization yield for the wavelengths smaller than 600 Å (20.7 eV) is almost equal to one. Hence, the absorption of photons by H2O in the energy range 14.5–20.7 eV majorly leads to the formation of O I emission via dissociative excitation. Due to the significant difference in the photodissociation cross sections (about an order of magnitude), O2 can be a more efficient source of O I emissions compared to H2O.
By using a gas production rate of 1.3 1030 s-1 and for the fractional composition of H2O, CO and CO2 as 80%, 20%, and 3%, respectively, the model calculations on comet 1P/Halley by Bhardwaj et al. (1996) showed that 35% of O I 1304 Å emission intensity in the inner coma is governed by electron impact on atomic oxygen and remaining is from resonance fluorescence. However, this model does not account for photodissociative excitation of O-bearing species producing OI 1304 Å emission. But due to the presence of significant amount of O2 (4% relative to H2O) in 67P/C-G, photodissociation of molecular oxygen can be a more effective mechanism in producing atomic oxygen compared to any other formation processes as discussed by Bhardwaj et al. (1996). We have evaluated the contribution of atomic oxygen resonance fluorescence producing 1304 Å emission and found to be 1% to the O2 photodissociation. Our model calculated volume emission rates show that photodissociation of O2 is the major source for O I 1304 Å and the role of dissociative excitation of other oxygen-bearing species is small (by more than an order of magnitude, see Figure 5). As discussed in Section 4.1, even on reducing O2 relative abundances to 0.5% with respect to water, photodissociation of O2 is the dominant (50%) source of O I lines. The observations of Bieler et al. (2015) showed that molecular oxygen abundance can be even 15% with respect to water, in this case, the contribution from all other sources can be completely neglected. Based on our model calculations, we suggest that atomic oxygen line emissions are directly linked to O2 molecular abundance and hence can be used to probe its sublimation rate from the nucleus.
In this work we have considered CO and CO2 are the only carbon bearing species as the source of C I emissions. The model calculations show that the photodissociation rate of CO is higher by an order of magnitude compared to that of CO2 producing C I emissions (see Figure 7). This is because the dissociation of CO leads to direct formation of excited atomic carbon which is a slow process in the case of CO2 dissociative excitation. Using photon (electron) cross sections, we evaluated that the atomic carbon in ground state produces via CO dissociation with a rate about 400 (2000) times higher than that of CO2. These calculated ratios suggest that CO is a potential source of atomic carbon in the cometary coma than CO2 either by photon or electron impact dissociation. Hässig et al. (2015) measurements show that CO/CO2 ratio can be as high as 5 due to heterogeneity of the 67P/C-G cometary coma in which case the contribution from CO2 can be completely neglected in the formation of C I emission intensities. The model calculated emission intensity ratios of C I 1657/1561 Å for the photodissociation of CO and CO2 are 2 and 1.7, respectively (see Figure 7). The resonance fluorescence efficiencies ratio of atomic carbon for C I 1657/1561 lines is about 2.8 (Woods et al., 1986). These calculated ratios indicate that if CO and/or CO2 are the primary sources then the C I 1657 Å emission should always be more intense than that of C I 1561 Å, which has actually been observed in several Alice spectra (Feldman et al., 2015, 2018; Noonan et al., 2018). This show that C I 1657 Å emission line is largely controlled either directly (via dissociative excitation) or indirectly (via dissociation leads to atomic carbon which further resonates solar photons at wavelength 1657 Å) by CO rather than CO2. Our calculations in Table 2 also show that when Q = 12.5 1026 s-1 and for 4% CO2 relative abundance, there is a linear increment in the modelled C I 1657 Å emission intensity with increasing the CO relative abundance from 2 to 8%. In this case, for a fixed CO abundance (4% relative to water) and by varying the CO2 abundance by a factor 5, we find the impact of CO2 on the the C I emission intensities is very small (5%). This calculation suggests that CO can a significant source of C I emissions than CO2. Hence, we suggest that the observed C I emission intensities are more directly linked with photodissociation of CO rather than that of CO2 and can be used to constrain its abundance in the cometary coma.
For determining the H I, O I, and C I nadir emission intensities on 2015 March 29, we have considered the variability in chemical composition of cometary coma as seen by ROSINA and the suprathermal electron flux as measured RPC-IES in the model. We find our calculated H I Ly- emission intensity on 2015 March 29 is in agreement with the Alice observed values when we use the lower limit of ROSINA measured water production rate, whereas the modelled O I emissions are not consistent (see Table 2). But when we varied the gas production rates and mixing ratios to the upper limits of measurements, our model calculated O I emission intensities are close to the observations. The discrepancies between modelled and observation nadir intensities on 2015 March 29 could be due the strong chemical heterogeneous composition of coma along the observed line of sight of Alice spectrometer. It should be noted that we have used Rosina measured gas production rates and relative mixing ratios which are derived at spacecraft position. But along the Alice line of sight the volume mixing ratios of different species may be varying due to chemical inhomogeneity in the coma as discussed by Keeney et al. (2017).
5.3 The effect of electron impact excitation at large (3 AU) heliocentric distances on the emission intensities
RPC-IES observations at large (3 AU) heliocentric distance have shown that suprathermal electron flux was dynamically varying in the cometary coma (Clark et al., 2015; Broiles et al., 2016; Madanian et al., 2016, 2017). The initial plasma studies of Galand et al. (2016), when the comet was at 3 AU from the Sun, have shown that electron impact ionization rate is higher than photoionization rate by a factor 2 to 10. Using RPC-IES measured suprathermal electron flux and H2O electron impact ionization cross section, Galand et al. (2016) have also shown that electron impact H2O ionization frequency significantly varies (between 0.1–8 10-7 s-1) within a few hours of observation. This is mainly due to the low sublimation rate (1026 s-1) of the comet that leads a highly rarefied medium around the nucleus and the hot component of photoelectrons could not exchange energy to the surrounding neutral species in the cometary coma. However, the plasma studies were done by Heritier et al. (2017, 2018) on 67P/C-G, when the comet was around at perihelion distance (1.24 AU) with a gas production rate of about 1028 s-1, show that electron impact ionization is non-significant compared to photoionization. This study indicates that in a well-developed cometary coma of a comet, photon impact reactions play a significant role compared to electron initiated processes. Similarly, as the comet was moving towards the Sun, the wide Angle camera of Optical, Spectroscopic, and Infrared Remote Imaging System (OSIRIS) and Alice onboard Rosetta instruments also observed the changes in the intensities of various spectral emissions of cometary species (Bodewits et al., 2016; Feldman et al., 2018). By analysing the Alice observed far-ultraviolet spectra, Feldman et al. (2018) have studied the evolution of cometary coma and suggested that various emission features of 67P/C-G are majorly driven by electron impact dissociative excitation processes. When the comet was moving towards the Sun from 2 to 1.5 AU, Bodewits et al. (2016) have noticed that the OSIRIS observed emission intensities of various species are decreased though the gas production rate was increasing in this period. These observations also suggest that the collisions between electrons and neutrals is increased significantly with the increase in local neutral density which leads to a strong electron cooling and a transition of inner coma from electron to photon driven excitation.
It should be noted that the electron impact ionization cross section is more than an order of magnitude higher compared to dissociative excitation of H2O producing H I Lyman emissions (Itikawa and Mason, 2005; Makarov et al., 2004). Hence, the high energetic photoelectron mainly turns water molecule into ion rather than to produce atomic emissions via dissociative excitation. To assess the contribution of electron impact excitation of H2O producing H I emissions at heliocentric distance 3 AU, we have scaled Galand et al. (2016) determined ionization rates with the mean electron impact cross section ratio of H I emission to H2O ionization. Our determined electron impact volume emission rates producing H I lines are higher by one to three orders of magnitude compared to modelled H2O photodissociative excitation rates at this heliocentric distance. This calculation suggests that electron impact excitation mechanisms are largely driving the emission intensities compared to photodissociative processes in comet 67P/C-G at large (3 AU) heliocentric distances. In this case, the observed emission intensity can be used to derive the electron density in the cometary coma. But when the comet 67P/C-G reaches closer to the Sun, the magnitude of hot component suprathermal electron flux reduces due to strong collisional degradation and the photodissociative excitation reactions play a major role in determining the atomic emission intensities.
5.4 On the role of chemical heterogeneity of cometary coma
Several observations have shown that the distribution of neutral species in the cometary coma is heterogeneous due to uneven distribution of source regions on the nucleus (Hässig et al., 2015; Hoang et al., 2017; Fougere et al., 2016). The non-uniformity in the neutral distribution along the Alice line of sight can also impact the observed emission intensities. During the Alice observation on 25 May 2015, the modelled column density of H2O (6 1015 cm-2) is consistent with the VIRTIS-H observation (2–7 1015 cm-2) (see Figure 4 of Chaufray et al., 2017). Considering the variability of H2O column density as observed by VIRTIS, we evaluated the effect of neutral inhomogeneity on the modelled emission intensity. By decreasing the H2O production rate by a factor of 3, we find the modelled H I emission intensities are decreased by a factor of 2. In this case, solar photons are the major driving source of H I emissions and the role of electron impact is negligible.
The mixing ratios of other O-bearing species with respect to H2O are dynamic around the nucleus and also play an important role in determining the emission intensities. The earlier observations of Hässig et al. (2015), when the comet was beyond 3 AU, have shown that CO2/H2O density ratio varied by an order of magnitude in the coma. But as the comet passed the inbound equinox (2015 May 10), the CO2/H2O and the CO/H2O density ratios around the nucleus, due to the spatial heterogeneity, are less than 7% and 15%, respectively, (see Figure 2 of Hoang et al., 2019). By varying the CO and CO2 abundances within the measured limits of RTOF/Rosina, we find the contribution CO is more significant (50%) than CO2 in determining the C I emission intensities. However, as the observations of Hoang et al. (2019) show that the dynamical variability of these species is significant (relative abundances are 1 with respect to H2O) when comet approach the outbound equinox, and the observed emission intensity can significantly be altered by the neutral composition. Hence, the effect of chemical heterogeneity of the cometary coma should be considered while deriving the gas production rate based on the observed emission intensity at different heliocentric distances. Calculation of atomic emission intensities using a realistic cometary neutral atmospheric model, which accounts for the non-homogeneous distribution and dynamical variation of neutral species, is outside the scope of this paper.
5.5 On H I Lyman-/ Lyman- emission intensity ratio
The initial Alice observations made on comet 67C-G, at heliocentric distances beyond 3 AU pre-perihelion, have shown that the H I Lyman-/Lyman- emission intensity ratio is around 5 (Feldman et al., 2015) which is close to the Makarov et al. (2004) determined electron impact emission cross section ratio 7 at 100 eV. Hence, this observed emission ratio has been used as a confirmation that electron impact excitation reactions are the dominant source of atomic emissions. Our model calculations, when the comet was at 1.56 AU, shows that solar resonance fluorescence is the major source of H I Lyman- emission than H2O dissociative excitation by photons and electrons (See Fig. 3). The solar resonance fluorescence of H I Lyman- mainly depends on the atomic hydrogen density which varies as a function of water production rate and also due to kinetic effects in the cometary coma as described by Tenishev et al. (2008). By developing a global kinetic model developed for comet 67P/C-G, Tenishev et al. (2008) have shown that the diurnal variability in the gas production rate can lead to a significant momentum exchange between energetic hydrogen atoms and water molecules near nucleus which results in change (by an order of magnitude) in atomic hydrogen density within 100 km radial distances. . This indicates that the observed H I Ly-/Ly- emission ratio can also change as the number density of atomic hydrogen varies in the inner coma. We have used Haser fitted atomic hydrogen number density profile in the model to evaluated H I Ly-/Ly- emission ratio. The modelled H I Ly-/Ly- ratio value on 25 May 2015 is greater than 100 near nucleus and increases with cometocentric projected distance (see Figure 8). If resonance fluorescence is the only excitation mechanism in the coma, then the observed H I Ly-/Ly- emission ratio should be around 750 (Gladstone et al., 2010). Since dissociative excitation reactions of H2O are playing a significant role close to the nucleus, our modelled emission ratio is smaller than the resonance fluorescence emission ratio. As explained in Section 4.1.3, even on using DSMC modelled atomic hydrogen number densities we find solar resonance fluorescence as the significant source of H I Lyman- emission. So we suggest that the observed H I Ly-/Ly- emission ratio not necessarily confirms that the electron impact reactions are significant in producing atomic emissions. The calculation of atomic hydrogen number density by accounting for kinetic effects of the cometary coma is beyond the scope of present work.
5.6 Atomic oxygen line emission intensity ratio
Several factors play a role in the Alice observed O I emission intensity ratios along its line of sight. Alice observed O I 1304/1356 emission intensity ratios on 2014 Nov. 29, 2015 Jan. 30, and 2015 March 29 as 2.91, 0.67, and 1.27, respectively (Feldman et al., 2018). During the cometary outburst period i.e., on 2015 May 22–24, the observed that this emission ratio is varying between 1 and 2 (Feldman et al., 2016). It is difficult to explain this variability in the observed O I emission ratio by invoking dissociative excitation of a single O-bearing species. If the cometary coma is homogeneously mixed with molecular oxygen and photodissociation of O2 is the major production source of these emissions, then our calculations suggest that O I 1304/1356 ratio should be around 0.5. Unfortunately, there are no measured H2O photodissociative cross sections to determine O I 1304/1356 Å brightness ratio. If our assumed photodissociation cross sections of H2O, which are estimated based on the experimental yield of Wu and Judge (1988), are realistic and photodissociation of H2O play significant role in producing these emissions, then O I 1304/1356 emission intensity should be around 1. These ratios suggest that H2O and O2 photodissociative excitation reactions alone can not produce the observed higher (1) emission ratios.
If electron impact is the only dominant excitation source in the cometary coma, as observed on comet 67P/C-G at larger heliocentric distances (3 AU), then the measured H2O (O2) electron impact cross section ratios suggest that the O I 1304/1152 and 1304/1356 emission intensity ratios should be always 1.21 (0.07) and 2.5 (0.5), respectively (Makarov et al., 2004; Kanik et al., 2003). If CO2 (CO) is the dominated species in the coma, then for electron impact as dominant excitation mechanism the O I 1304/1152 and 1304/1356 emission ratios should be around 0.5 (2) and 2 (1.17), respectively (Ajello, 1971b; Itikawa, 2002; Kanik et al., 1995). Hence, based on the previously mentioned theoretical ratios it is difficult to explain the observed variability in O I 1304/1356 emission ratios when the cometary composition significantly changes with different O-bearing species along the Alice observed line of sight. Moreover, resonance fluorescence of atomic oxygen can also be an important excitation mechanism that can significantly alter the observed O I 1304/1356 emission ratio. Hence, we suggest that O I 1304/1356 emission ratio alone can not indicate the excitation source in the cometary coma.
For the cometary coma, where the electron impact excitation is major excitation source, the molecular oxygen can be a potential source for O I emissions compared to H2O due to large difference in electron impact cross sections for electronic impact excitation. The electron impact cross section of O2 producing O I 1304 Å (1356 Å) emissions is higher by an (about two) order(s) of magnitude compare to that of H2O in the energy range 20–40 eV where the peaks occur in the suprathermal electrons spectrum (see Figure 1). Our calculated volume emission rates, for 4% O2 relative abundance, also suggest that the electron impact on O2 and H2O can be equally potential sources in producing O I 1304 and 1356 Å emissions (See Figs. 4 and 6). Hence, the presence of small amount of molecular oxygen in cometary coma (5%) can be a significant source for O I emissions than H2O.
The volume mixing ratios O2/H2O is one of the importance parameters which can determine the Alice observed line of sight O I emission ratios. As mentioned earlier, molecular oxygen has been detected in 67P/C-G with an average relative abundance of 4% with respect to H2O and found to vary (0.1–15% relative to H2O) in the coma during the Rosetta mission period (Bieler et al., 2015). It should be noted that Rosina derived relative mixing ratios are based on the measurement of neutral gas densities at spacecraft position. Using Alice spectrometer, Keeney et al. (2017) found that the O2/H2O relative abundance ratio in the cometary coma is varying between 11–68%, with a mean value of 25%, by studying H2O and O2 absorption spectra of cometary coma against far-UV continuum of stellar radiation. Alice derived abundances depend on the column density of neutrals along the line of sight observation. Hence, the variability in O2 and H2O along the Alice line of sight can significantly affect the observed atomic oxygen emission intensities and their ratios.
The observed limb oxygen emission ratio also depends on the viewing geometry of line of sight. This can be understood from our modelled O I 1304/1356 and 1152/1304 Å emission brightness ratio profiles, as a function of projected distance, presented in Figure 9. Since solar resonance fluorescence of atomic oxygen is an important excitation source for radial distances more than 20 km (see Figure 5), the calculated O I 1304/1356 Å brightness ratio is increasing, whereas it is decreasing in case of O I 1152/1304 Å, with increasing projected distance. These calculations suggest that the observed O I 1304/1356 Å brightness ratio need not be an indicator to confirm the parent species of atomic oxygen emissions in the cometary coma.
We have modelled atomic oxygen density in the cometary coma by using hydrodynamical approach. But the global kinetic modelled number densities of Tenishev et al. (2008) close to the nucleus (30 km) are higher about a factor 3 compared to our model calculated values. In order to evaluate the effect of solar resonant scattering of atomic oxygen, we have increased the atomic oxygen density in the model. By increasing the atomic oxygen density about an order of magnitude, we find the calculated O I 1304 Å intensity increased by 50% and oxygen emission ratio is in agreement with the observation when comet was at 2 AU. This calculation show that resonant scattering of atomic oxygen can also determine the oxygen emission ratio when substantial atomic oxygen is present in the inner coma. Feldman et al. (2018) also noticed in the limb observation around the perihelion made on 2015 Aug 19 that resonance fluorescence is important excitation source in producing OI 1304 Å emission. Global kinetic models such as Tenishev et al. (2008), which accounts for strong momentum exchange between hot oxygen atoms to surrounding water molecules, can determine accurate atomic oxygen densities close to the nucleus which is not possible by our one-dimensional approach. However, our model calculations show that molecular oxygen is an important source of O I emissions compared to H2O via both photons and electron impact dissociative excitation. So we suggest that the observed atomic oxygen emissions are suitable to derive O2 relative abundances in the cometary coma.
5.7 Limitations of model calculations
The model calculations depend on several photons and photoelectron cross sections which have not been critically evaluated in the literature. Most of the electron impact excitation cross sections are measured at either at 100 or 200 eV whereas the measurement of photodissociative excitation cross sections are limited to a small band of wavelengths, which leads to lesser dissociative excitation rates in the model. We could not incorporate photodissociation channels of CO2 and CO due to non-availability of cross sections while calculating O I 1152 Å emission intensity. Several assumptions have been made (see Section 2) to incorporate the various dissociative excitation channels producing atomic emission lines in the model. For the analysis of Alice observations these calculations emphasize the urgent need for measuring various cross sections producing cometary spectroscopic emissions. Since model calculations are one dimensional, the heterogeneous distribution of neutrals in the cometary coma could not be incorporated to study the observed nadir emission intensities on different days.
6 Summary and Conclusions
The Alice-ROSETTA observed various O I and H I emissions , when comet 67P/C-G was at large helioncentric distances (3 AU). These measured emission intensities have been used to derive electron densities in the coma assuming that electron impact dissociative excitation is the major source mechanism (Feldman et al., 2015). In order to quantify the contributions of photon and electron impact excitation processes, we have developed a photochemical model to study various H I, O I and C I emissions by accounting for essential formation mechanisms in the cometary coma. The following are major conclusions drawn from the present work.
-
1.
Our model calculations on comet 67P/C-G, when it was at 1.5 and 1.99 AU and having gas production rate of about 1027 s-1, show that photodissociative excitation reactions of primary neutrals significantly produce H I, O I and C I emissions compared to electron impact excitation processes.
-
2.
Based on the model input parameters, we suggest that the photodissociation of O2 is a significant source of O I emissions compared to that of H2O.
-
3.
If our assumed photodissociation cross sections are realistic, model calculations show that the photodissociation of O2 and H2O can also be important sources of O I 1356 Å emission in the cometary coma rather than the earlier assumed electron impact excitation of O-bearing species. Hence, the observation of this emission line in comets not necessarily represents the presence of suprathermal electron impact excitation reactions.
-
4.
The photodissociative excitation of CO is a more significant source in producing C I emission lines compared to that of CO2. Hence, the observed C I emission intensities are suitable to derived CO abundances in the coma.
-
5.
The observed H I (Lyman-/Lyman-), O I(1304/1356 & 1152/1304), and C I(1657/1561) emission ratio vary based on the limb viewing geometry and also depends on the excitation processes present along the line of sight in the coma.
-
6.
Solar resonance fluorescence is found to be important excitation source of these atomic emissions, except for O I 1356 Å, for radial distances larger than 100 km in the coma. Hence, it is essential to study the atomic oxygen, carbon, and hydrogen distribution and their variation in the cometary coma to explain the observed emission ratios.
-
7.
When comet 67P/C-G is at large heliocentric distances (2 AU) or with a highly rarefied gaseous environment around the nucleus, suprathermal electrons can not lose their energy to the surrounding cometary volatile species which leads to a large population hot electrons in the coma. In this case the electron impact could be a significant source of atomic emissions hence the observed emission intensities can be used to derive electron density in the coma. But when comet has a neutral gas production rate 1027 s-1 or more, we suggest that the observed H I, O I, and C I emissions are suitable to derive H2O, O2 and CO abundances.
-
8.
Our modelled suprathermal electron flux is in agreement with RPC-IES observations when the comet was at small heliocentric distances (2 AU).
Acknowledgments
The authors thank the anonymous reviewers for their valuable comments and suggestions that has improved the paper significantly. SR is supported by Department of Science and Technology (DST) with Innovation in Science Pursuit for Inspired Research (INSPIRE) faculty award [Grant: DST/INSPIRE/04/2016/002687], and he would like to thank Physical Research Laboratory for facilitating conducive research environment.
References
- Ajello (1971a) Ajello, J. M. (1971a), Emission cross sections of CO2 by electron impact in the interval 1260-4500 Å, II, J. Chem. Phys., 55, 3169–3177, doi:10.1063/1.1676564.
- Ajello (1971b) Ajello, J. M. (1971b), Emission cross Sections of CO by electron impact in the interval 1260-5000 Å. I, J. Chem. Phys., 55, 3158–3168, doi:10.1063/1.1676563.
- Balsiger et al. (2007) Balsiger, H., K. Altwegg, P. Bochsler, P. Eberhardt, J. Fischer, S. Graf, A. Jäckel, E. Kopp, U. Langer, M. Mildner, J. Müller, T. Riesen, M. Rubin, S. Scherer, P. Wurz, S. Wüthrich, E. Arijs, S. Delanoye, J. de Keyser, E. Neefs, D. Nevejans, H. Rème, C. Aoustin, C. Mazelle, J.-L. Médale, J. A. Sauvaud, J.-J. Berthelier, J.-L. Bertaux, L. Duvet, J.-M. Illiano, S. A. Fuselier, A. G. Ghielmetti, T. Magoncelli, E. G. Shelley, A. Korth, K. Heerlein, H. Lauche, S. Livi, A. Loose, U. Mall, B. Wilken, F. Gliem, B. Fiethe, T. I. Gombosi, B. Block, G. R. Carignan, L. A. Fisk, J. H. Waite, D. T. Young, and H. Wollnik (2007), Rosina Rosetta Orbiter Spectrometer for Ion and Neutral Analysis, Space Science Rev., 128, 745–801, doi:10.1007/s11214-006-8335-3.
- Beenakker et al. (1974) Beenakker, C. I. M., F. J. D. Heer, H. B. Krop, and G. R. Möhlmann (1974), Dissociative excitation of water by electron impact, Chemical Physics, 6, 445–454, doi:10.1016/0301-0104(74)85028-7.
- Bhardwaj (1999) Bhardwaj, A. (1999), On the role of solar EUV, photoelectrons, and auroral electrons in the chemistry of C(1D) and the production of C I 1931 Å in the inner cometary coma: A case for comet P/Halley, J. Geophys. Res., 104, 1929 – 1942, doi:10.1029/1998JE900004.
- Bhardwaj (2003) Bhardwaj, A. (2003), On the solar EUV deposition in the inner coma of comets with large gas production rates., Geophys. Res. Lett., 30(24), 2244, doi:10.1029/2003GL018495.
- Bhardwaj and Haider (2002) Bhardwaj, A., and S. A. Haider (2002), Chemistry of O(1D) atoms in the coma: implications for cometary missions, Adv. Space Res., 29, 745–750, doi:10.1016/S0273-1177(02)00006-6.
- Bhardwaj and Jain (2009) Bhardwaj, A., and S. K. Jain (2009), Monte Carlo model of electron energy degradation in a CO2 atmosphere, J. Geophys. Res., 114(A13), 11,309, doi:10.1029/2009JA014298.
- Bhardwaj and Michael (1999) Bhardwaj, A., and M. Michael (1999), On the excitation of Io’s atmosphere by the photoelectrons: Application of the analytical yield spectrum of SO2, Geophys. Res. Lett., 26, 393 – 396, doi:10.1029/1998GL900320.
- Bhardwaj and Raghuram (2011) Bhardwaj, A., and S. Raghuram (2011), Model for Cameron-band emission in comets: A case for the EPOXI mission target comet 103P/Hartley 2, Mon. Not. R. Astron. Soc., 412, L25 – L29, doi:10.1111/j.1745-3933.2010.00998.x.
- Bhardwaj and Raghuram (2012) Bhardwaj, A., and S. Raghuram (2012), A coupled chemistry-emission model for atomic oxygen green and red-doublet emissions in the comet C/1996 B2 Hyakutake, Astrophys. J., 748, 13, doi:10.1088/0004-637X/748/1/13.
- Bhardwaj et al. (1990) Bhardwaj, A., S. A. Haider, and R. P. Singhal (1990), Auroral and photoelectron fluxes in cometary ionospheres, Icarus, 85, 216 – 228, doi:10.1016/0019-1035(90)90112-M.
- Bhardwaj et al. (1995) Bhardwaj, A., S. A. Haider, and R. P. Singhal (1995), Consequences of cometary aurora on the carbon chemistry at comet P/Halley., Adv. Space Res., 16 (2), 31 – 36.
- Bhardwaj et al. (1996) Bhardwaj, A., S. A. Haider, and R. P. Singhal (1996), Production and emissions of atomic carbon and oxygen in the inner coma of comet 1P/Halley: Role of electron impact, Icarus, 120, 412 – 430, doi:10.1006/icar.1996.0061.
- Bieler et al. (2015) Bieler, A., K. Altwegg, H. Balsiger, A. Bar-Nun, J.-J. Berthelier, P. Bochsler, C. Briois, U. Calmonte, M. Combi, J. de Keyser, E. F. van Dishoeck, B. Fiethe, S. A. Fuselier, S. Gasc, T. I. Gombosi, K. C. Hansen, M. Hässig, A. Jäckel, E. Kopp, A. Korth, L. Le Roy, U. Mall, R. Maggiolo, B. Marty, O. Mousis, T. Owen, H. Rème, M. Rubin, T. Sémon, C.-Y. Tzou, J. H. Waite, C. Walsh, and P. Wurz (2015), Abundant molecular oxygen in the coma of comet 67P/Churyumov-Gerasimenko, Nauture, 526, 678–681, doi:10.1038/nature15707.
- Bodewits et al. (2016) Bodewits, D., L. M. Lara, M. F. A’Hearn, F. La Forgia, A. Gicquel, G. Kovacs, J. Knollenberg, M. Lazzarin, Z. Y. Lin, X. Shi, C. Snodgrass, C. Tubiana, H. Sierks, C. Barbieri, P. L. Lamy, R. Rodrigo, D. Koschny, H. Rickman, H. U. Keller, M. A. Barucci, J. L. Bertaux, I. Bertini, S. Boudreault, G. Cremonese, V. Da Deppo, B. Davidsson, S. Debei, M. De Cecco, S. Fornasier, M. Fulle, O. Groussin, P. J. Gutiérrez, C. Güttler, S. F. Hviid, W. H. Ip, L. Jorda, J. R. Kramm, E. Kührt, M. Küppers, J. J. López-Moreno, F. Marzari, G. Naletto, N. Oklay, N. Thomas, I. Toth, and J. B. Vincent (2016), Changes in the Physical Environment of the Inner Coma of 67P/Churyumov-Gerasimenko with Decreasing Heliocentric Distance, Astronomical Journal, 152(5), 130, doi:10.3847/0004-6256/152/5/130.
- Broiles et al. (2016) Broiles, T. W., J. L. Burch, K. Chae, G. Clark, T. E. Cravens, A. Eriksson, S. A. Fuselier, R. A. Frahm, S. Gasc, R. Goldstein, P. Henri, C. Koenders, G. Livadiotis, K. E. Mandt, P. Mokashi, Z. Nemeth, E. Odelstad, M. Rubin, and M. Samara (2016), Statistical analysis of suprathermal electron drivers at 67P/Churyumov-Gerasimenko, Mon. Not. R. Astron. Soc., 462, S312–S322, doi:10.1093/mnras/stw2942.
- Burch et al. (2007) Burch, J. L., R. Goldstein, T. E. Cravens, W. C. Gibson, R. N. Lundin, C. J. Pollock, J. D. Winningham, and D. T. Young (2007), RPC-IES: The Ion and Electron Sensor of the Rosetta Plasma Consortium, Space Science Rev., 128(1-4), 697–712, doi:10.1007/s11214-006-9002-4.
- Carlson (1974) Carlson, R. W. (1974), Extreme ultraviolet photodissociative excitation of molecular oxygen, The Journal of Chemical Physics, 60(6), 2350–2353, doi:10.1063/1.1681368.
- Chaufray et al. (2017) Chaufray, J.-Y., D. Bockelée-Morvan, J.-L. Bertaux, S. Erard, P. D. Feldman, F. Capaccioni, E. Schindhelm, C. Leyrat, J. Parker, G. Filacchione, M. F. A’Hearn, L. M. Feaga, J. Noonan, B. Keeney, A. J. Steffl, S. A. Stern, H. A. Weaver, T. Broiles, J. Burch, G. Clark, and M. Samara (2017), Rosetta Alice/VIRTIS observations of the water vapour UV electroglow emissions around comet 67P/Churyumov-Gerasimenko, Monthly Notices of the Royal Astronomical Society, 469, S416–S426, doi:10.1093/mnras/stx1895.
- Clark et al. (2015) Clark, G., T. W. Broiles, J. L. Burch, G. A. Collinson, T. Cravens, R. A. Frahm, J. Goldstein, R. Goldstein, K. Mandt, P. Mokashi, M. Samara, and C. J. Pollock (2015), Suprathermal electron environment of comet 67P/Churyumov-Gerasimenko: Observations from the Rosetta Ion and Electron Sensor, Astron. & Astrophys., 583, A24, doi:10.1051/0004-6361/201526351.
- Combi et al. (1998) Combi, M. R., M. E. Brown, P. D. Feldman, H. U. Keller, R. R. Meier, and W. H. Smyth (1998), Hubble space telescope ultraviolet imaging and high-resolution spectroscopy of water photodissociation products in comet Hyakutake (C/1996 b2), Astrophys. J., 494, 816–821.
- Combi et al. (2000) Combi, M. R., A. A. Reinard, J.-L. Bertaux, E. Quemerais, and T. Mäkinen (2000), SOHO/SWAN observations of the structure and evolution of the Hydrogen Lyman- coma of comet Hale-Bopp (1995 O1), Icarus, 144, 191 – 202, doi:10.1006/icar.1999.6335.
- Combi et al. (2004) Combi, M. R., W. M. Harris, and W. H. Smyth (2004), Gas dynamics and kinetics in the cometary coma: theory and observations, pp. 523–552, The university of arizon press.
- Edberg et al. (2015) Edberg, N. J. T., A. I. Eriksson, E. Odelstad, P. Henri, J. P. Lebreton, S. Gasc, M. Rubin, M. André, R. Gill, E. P. G. Johansson, F. Johansson, E. Vigren, J. E. Wahlund, C. M. Carr, E. Cupido, K. H. Glassmeier, R. Goldstein, C. Koenders, K. Mandt, Z. Nemeth, H. Nilsson, I. Richter, G. S. Wieser, K. Szego, and M. Volwerk (2015), Spatial distribution of low-energy plasma around comet 67P/CG from Rosetta measurements, Geophys. Res. Lett., 42(11), 4263–4269, doi:10.1002/2015GL064233.
- Feldman et al. (2002) Feldman, P. D., H. A. Weaver, and E. B. Burgh (2002), Far ultraviolet spectroscopic explorer observations of CO and H2 emissions in comet C/2001 A2(Linear), Astrophys. J. Lett., 576, L91 – L94.
- Feldman et al. (2004) Feldman, P. D., A. L. Cochran, and M. R. Combi (2004), Spectroscopic investigations of fragment species in the coma: Comets II, pp. 425–447, M. C. Festou, H. A. Weaver, & H. U. Keller (Ed.)(Tucson: Univ. of Arizona).
- Feldman et al. (2015) Feldman, P. D., M. F. A’Hearn, J.-L. Bertaux, L. M. Feaga, J. W. Parker, E. Schindhelm, A. J. Steffl, S. A. Stern, H. A. Weaver, H. Sierks, and J.-B. Vincent (2015), Measurements of the near-nucleus coma of comet 67P/Churyumov-Gerasimenko with the Alice far-ultraviolet spectrograph on Rosetta, Astron. Astrophys., 583, A8, doi:10.1051/0004-6361/201525925.
- Feldman et al. (2016) Feldman, P. D., M. F. A’Hearn, L. M. Feaga, J.-L. Bertaux, J. Noonan, J. W. Parker, E. Schindhelm, A. J. Steffl, S. A. Stern, and H. A. Weaver (2016), The Nature and Frequency of the Gas Outbursts in Comet 67P/Churyumov-Gerasimenko Observed by the Alice Far-ultraviolet Spectrograph on Rosetta, Astrophys. journal lett., 825, L8, doi:10.3847/2041-8205/825/1/L8.
- Feldman et al. (2018) Feldman, P. D., M. F. A’Hearn, J.-L. Bertaux, L. M. Feaga, B. A. Keeney, M. M. Knight, J. Noonan, J. W. Parker, E. Schindhelm, A. J. Steffl, S. A. Stern, R. J. Vervack, and H. A. Weaver (2018), FUV Spectral Signatures of Molecules and the Evolution of the Gaseous Coma of Comet 67P/Churyumov–Gerasimenko, The Astronomical Journal, 155(1), 9.
- Fougere et al. (2016) Fougere, N., K. Altwegg, J.-J. Berthelier, A. Bieler, D. Bockelée-Morvan, U. Calmonte, F. Capaccioni, M. R. Combi, J. De Keyser, V. Debout, S. Erard, B. Fiethe, G. Filacchione, U. Fink, S. A. Fuselier, T. I. Gombosi, K. C. Hansen, M. Hässig, Z. Huang, L. Le Roy, C. Leyrat, A. Migliorini, G. Piccioni, G. Rinaldi, M. Rubin, Y. Shou, V. Tenishev, G. Toth, and C.-Y. Tzou (2016), Direct Simulation Monte Carlo modelling of the major species in the coma of comet 67P/Churyumov-Gerasimenko, Mon. Not. R. Astron. Soc., 462, S156–S169, doi:10.1093/mnras/stw2388.
- Galand et al. (2016) Galand, M., K. L. Héritier, E. Odelstad, P. Henri, T. W. Broiles, A. J. Allen, K. Altwegg, A. Beth, J. L. Burch, C. M. Carr, E. Cupido, A. I. Eriksson, K.-H. Glassmeier, F. L. Johansson, J.-P. Lebreton, K. E. Mandt, H. Nilsson, I. Richter, M. Rubin, L. B. M. Sagnières, S. J. Schwartz, T. Sémon, C.-Y. Tzou, X. Vallières, E. Vigren, and P. Wurz (2016), Ionospheric plasma of comet 67P probed by Rosetta at 3 au from the Sun, Mon. Not. R. Astron. Soc., 462, S331–S351, doi:10.1093/mnras/stw2891.
- Gasc et al. (2017) Gasc, S., K. Altwegg, H. Balsiger, J.-J. Berthelier, A. Bieler, U. Calmonte, B. Fiethe, S. Fuselier, A. Galli, and T. Gombosi (2017), Change of outgassing pattern of 67P/Churyumov-Gerasimenko during the March 2016 equinox as seen by ROSINA, Monthly Notices of the Royal Astronomical Society, 469, S108–S117, doi:10.1093/mnras/stx1412.
- Gladstone et al. (2010) Gladstone, G. R., D. M. Hurley, K. D. Retherford, P. D. Feldman, W. R. Pryor, J.-Y. Chaufray, M. Versteeg, T. K. Greathouse, A. J. Steffl, H. Throop, J. W. Parker, D. E. Kaufmann, A. F. Egan, M. W. Davis, D. C. Slater, J. Mukherjee, P. F. Miles, A. R. Hendrix, A. Colaprete, and S. A. Stern (2010), LRO-LAMP Observations of the LCROSS Impact Plume, Science, 330, 472, doi:10.1126/science.1186474.
- Haddad and Samson (1986) Haddad, G. N., and J. A. R. Samson (1986), Total absorption and photoionization cross sections of water vapor between 100 and 1000 å., The Journal of Chemical Physics, 84(12), 6623–6626, doi:10.1063/1.450715.
- Haider and Bhardwaj (2005) Haider, S. A., and A. Bhardwaj (2005), Radial distribution of production rates, loss rates and densities corresponding to ion masses 40 amu in the inner coma of comet Halley: Composition and chemistry., Icarus, 177, 196 – 216, doi:10.1016/j.icarus.2005.02.019.
- Hans et al. (2015) Hans, A., A. Knie, P. Schmidt, L. Ben Ltaief, C. Ozga, P. Reiß, H. Huckfeldt, M. Förstel, U. Hergenhahn, and A. Ehresmann (2015), Lyman-series emission after valence and core excitation of water vapor, Phys. Rev. A, 92, 032,511, doi:10.1103/PhysRevA.92.032511.
- Hansen et al. (2016) Hansen, K. C., K. Altwegg, J.-J. Berthelier, A. Bieler, N. Biver, D. Bockelée-Morvan, U. Calmonte, F. Capaccioni, M. R. Combi, J. De Keyser, B. Fiethe, N. Fougere, S. A. Fuselier, S. Gasc, T. I. Gombosi, Z. Huang, L. Le Roy, S. Lee, H. Nilsson, M. Rubin, Y. Shou, C. Snodgrass, V. Tenishev, G. Toth, C.-Y. Tzou, C. Simon Wedlund, and the ROSINA team (2016), Evolution of water production of 67P/Churyumov–Gerasimenko: an empirical model and a multi-instrument study, Monthly Notices of the Royal Astronomical Society, 462(Suppl), S491–S506, doi:10.1093/mnras/stw2413.
- Haser (1957) Haser, L. (1957), Distribution d’intensite dans la tete d’une comete, Bull. Acad. R Sci Liege, 43, 740 – 750.
- Hässig et al. (2015) Hässig, M., K. Altwegg, H. Balsiger, A. Bar-Nun, J. J. Berthelier, A. Bieler, P. Bochsler, C. Briois, U. Calmonte, M. Combi, J. De Keyser, P. Eberhardt, B. Fiethe, S. A. Fuselier, M. Galand, S. Gasc, T. I. Gombosi, K. C. Hansen, A. Jäckel, H. U. Keller, E. Kopp, A. Korth, E. Kührt, L. Le Roy, U. Mall, B. Marty, O. Mousis, E. Neefs, T. Owen, H. Rème, M. Rubin, T. Sémon, C. Tornow, C.-Y. Tzou, J. H. Waite, and P. Wurz (2015), Time variability and heterogeneity in the coma of 67P/Churyumov-Gerasimenko, Science, 347(1), aaa0276, doi:10.1126/science.aaa0276.
- Heritier et al. (2018) Heritier, K., K. Altwegg, J.-J. Berthelier, A. Beth, C. Carr, J. D. Keyser, A. Eriksson, S. Fuselier, M. Galand, T. Gombosi, P. J. F. Henri, H. Nilsson, S. Rubin M., Wedlund, M. Taylor, and V. E. (2018), On the origin of molecular oxygen in cometary comae, Nature Communications, 9, 2580, doi:10.1038/s41467-018-04972-5.
- Heritier et al. (2017) Heritier, K. L., K. Altwegg, H. Balsiger, J.-J. Berthelier, A. Beth, A. Bieler, N. Biver, U. Calmonte, M. R. Combi, J. De Keyser, A. I. Eriksson, B. Fiethe, N. Fougere, S. A. Fuselier, M. Galand, S. Gasc, T. I. Gombosi, K. C. Hansen, M. Hassig, E. Kopp, E. Odelstad, M. Rubin, C.-Y. Tzou, E. Vigren, and V. Vuitton (2017), Ion composition at comet 67P near perihelion: Rosetta observations and model-based interpretation, Mon. Not. R. Astron. Soc., 469, S427–S442, doi:10.1093/mnras/stx1912.
- Hoang et al. (2017) Hoang, M., K. Altwegg, H. Balsiger, A. Beth, A. Bieler, U. Calmonte, M. R. Combi, J. De Keyser, B. Fiethe, N. Fougere, S. A. Fuselier, A. Galli, P. Garnier, S. Gasc, T. Gombosi, K. C. Hansen, A. Jäckel, A. Korth, J. Lasue, L. Le Roy, U. Mall, H. Rème, M. Rubin, T. Sémon, D. Toublanc, C.-Y. Tzou, J. H. Waite, and P. Wurz (2017), The heterogeneous coma of comet 67P/Churyumov-Gerasimenko as seen by ROSINA: H2O, CO2, and CO from September 2014 to February 2016, Astron. Astrophys, 600, A77, doi:10.1051/0004-6361/201629900.
- Hoang et al. (2019) Hoang, M., P. Garnier, H. Gourlaouen, J. Lasue, H. Rème, K. Altwegg, H. Balsiger, A. Beth, U. Calmonte, B. Fiethe, A. Galli, S. Gasc, A. Jäckel, A. Korth, L. Le Roy, U. Mall, M. Rubin, T. Sémon, C. Y. Tzou, J. H. Waite, and P. Wurz (2019), Two years with comet 67P/Churyumov-Gerasimenko: H2O, CO2, and CO as seen by the ROSINA/RTOF instrument of Rosetta, Astron. & Astrophys., 630, A33, doi:10.1051/0004-6361/201834226.
- Huebner et al. (1992) Huebner, W. F., J. J. Keady, and S. P. Lyon (1992), Solar photorates for planetary atmospheres and atmospheric pollutants, Astrophys. Space Sci., 195(1), 1–294, doi:10.1007/BF00644558.
- Itikawa (2002) Itikawa, Y. (2002), Cross sections for electron collisions with carbon dioxide, J. Phys. Chem. Ref. Data, 31(3), 749–767, doi:10.1063/1.1481879.
- Itikawa and Mason (2005) Itikawa, Y., and N. Mason (2005), Cross sections for electron collisions with water molecules, J. Phys. Chem. Ref. Data, 34(1), 1–22, doi:10.1063/1.1799251.
- Kanik et al. (1993) Kanik, I., J. M. Ajello, and G. James (1993), Extreme ultraviolet emission spectrum of co2 induced by electron impact at 200 ev, Chemical Physics Letters, 211(6), 523 – 528, doi:10.1016/0009-2614(93)80137-E.
- Kanik et al. (1995) Kanik, I., G. K. James, and J. M. Ajello (1995), Medium-resolution studies of extreme-ultraviolet emission from co by electron impact, Phys. Rev. A, 51, 2067–2074, doi:10.1103/PhysRevA.51.2067.
- Kanik et al. (2003) Kanik, I., C. Noren, O. P. Makarov, P. Vattipalle, J. M. Ajello, and D. E. Shemansky (2003), Electron impact dissociative excitation of O2: 2. Absolute emission cross sections of the OI(130.4 nm) and OI(135.6 nm) lines, J. Geophys. Res., 108, 5126, doi:10.1029/2000JE001423.
- Keeney et al. (2017) Keeney, B. A., S. A. Stern, M. F. A’Hearn, J.-L. Bertaux, L. M. Feaga, P. D. Feldman, R. A. Medina, J. W. Parker, J. P. Pineau, E. Schindhelm, A. J. Steffl, M. Versteeg, and H. A. Weaver (2017), H2O and O2 absorption in the coma of comet 67P/Churyumov-Gerasimenko measured by the Alice far-ultraviolet spectrograph on Rosetta, Mon. Not. R. Astron. Soc., 469, S158–S177, doi:10.1093/mnras/stx1426.
- Le Roy et al. (2015) Le Roy, L., K. Altwegg, H. Balsiger, J.-J. Berthelier, A. Bieler, C. Briois, U. Calmonte, M. R. Combi, J. De Keyser, and F. Dhooghe (2015), Inventory of the volatiles on comet 67P/Churyumov-Gerasimenko from Rosetta/ROSINA, Astron. & Astrophys., 583, A1, doi:10.1051/0004-6361/201526450.
- Lee et al. (1975) Lee, L. C., R. W. Carlson, D. L. Judge, and M. Ogawa (1975), Vacuum ultraviolet fluorescence from photodissociation fragments of co and co2, The Journal of Chemical Physics, 63(9), 3987–3995, doi:10.1063/1.431837.
- Liu and Victor (1994) Liu, W., and G. A. Victor (1994), Electron energy deposition in carbon monoxide gas, Astrophys Journal, 435, 909–919, doi:10.1086/174872.
- Madanian et al. (2016) Madanian, H., T. E. Cravens, A. Rahmati, R. Goldstein, J. Burch, A. I. Eriksson, N. J. T. Edberg, P. Henri, K. Mandt, G. Clark, M. Rubin, T. Broiles, and N. L. Reedy (2016), Suprathermal electrons near the nucleus of comet 67P/Churyumov-Gerasimenko at 3 AU: Model comparisons with Rosetta data, Journal of Geophysical Research (Space Physics), 121, 5815–5836, doi:10.1002/2016JA022610.
- Madanian et al. (2017) Madanian, H., T. E. Cravens, J. Burch, R. Goldstein, M. Rubin, Z. Nemeth, C. Goetz, C. Koenders, and K. Altwegg (2017), Plasma Environment around Comet 67P/Churyumov-Gerasimenko at Perihelion: Model Comparison with Rosetta Data, Astron. J., 153, 30, doi:10.3847/1538-3881/153/1/30.
- Makarov et al. (2003) Makarov, O. P., I. Kanik, and J. M. Ajello (2003), Electron impact dissociative excitation of O2: 1. Kinetic energy distributions of fast oxygen atoms, Journal of Geophysical Research (Planets), 108, 5125, doi:10.1029/2000JE001422.
- Makarov et al. (2004) Makarov, O. P., J. M. Ajello, P. Vattipalle, I. Kanik, M. C. Festou, and A. Bhardwaj (2004), Kinetic energy distributions and line profile measurements of dissociation products of water upon electron impact, Journal of Geophysical Research (Space Physics), 109, A09303, doi:10.1029/2002JA009353.
- Meier (1995) Meier, R. R. (1995), Solar lyman series line profiles and atomic hydrogen excitation rates, Astrophys Journal, 452, 462, doi:10.1086/176318.
- Möhlmann et al. (1978) Möhlmann, G. R., K. H. Shima, and F. J. De Heer (1978), Production of H, D(2s, 2p) by electron impact (0–2000 eV) on simple hydrogen containing molecules, Chemical Physics, 28(3), 331 – 341, doi:10.1016/0301-0104(78)80010-X.
- Morgan and Mentall (1974) Morgan, H. D., and J. E. Mentall (1974), VUV dissociative excitation cross sections of H2O, NH3, and CH4 by electron impact, J. Chem. phys., 60, 4734–4739, doi:10.1063/1.1680975.
- Noonan et al. (2018) Noonan, J. W., S. A. Stern, P. D. Feldman, T. Broiles, C. S. Wedlund, N. J. T. Edberg, E. Schindhelm, J. W. Parker, B. A. Keeney, R. J. Vervack, Jr., A. J. Steffl, M. M. Knight, H. A. Weaver, L. M. Feaga, M. A’Hearn, and J.-L. Bertaux (2018), Ultraviolet Observations of Coronal Mass Ejection Impact on Comet 67P/Churyumov-Gerasimenko by Rosetta Alice, The Astronomical Journal, 156, 16, doi:10.3847/1538-3881/aac432.
- Paxton (1985) Paxton, L. J. (1985), Pioneer venus orbiter ultraviolet spectrometer limb observations - analysis and interpretation of the 166- and 156-nm data, Journal of Geophys. Res., 90, 5089–5096, doi:10.1029/JA090iA06p05089.
- Raghuram and Bhardwaj (2013) Raghuram, S., and A. Bhardwaj (2013), Model for atomic oxygen visible line emissions in comet C/1995 O1 Hale-Bopp, Icarus, 223, 91–104, doi:10.1016/j.icarus.2012.11.032.
- Raghuram et al. (2016) Raghuram, S., A. Bhardwaj, and M. Galand (2016), Prediction of Forbidden Ultraviolet and Visible Emissions in Comet 67P/Churyumov-Gerasimenko, Astrophys. J., 818, 102, doi:10.3847/0004-637X/818/2/102.
- Shirai et al. (2001) Shirai, T., T. Tabata, and H. Tawara (2001), Analytic cross sections for electron collisions with CO, CO2, and H2O relevant to edge plasma impurities, Atomic Data and Nuclear Data Tables, 79(1), 143 – 184, doi:10.1006/adnd.2001.0866.
- Singhal and Bhardwaj (1991) Singhal, R. P., and A. Bhardwaj (1991), Monte Carlo Simulation of Photoelectron Energization in Parallel Electric Fields: Electroglow on Uranus, J. Geophys. Res., 96, 15,963 – 15,972, doi:10.1029/90JA02749.
- Singhal and Haider (1984) Singhal, R. P., and S. A. Haider (1984), Analytical yield spectrum approach to photoelectron fluxes in the earth’s atmosphere, J. Geophys. Res., 89, 6847–6852, doi:10.1029/JA089iA08p06847.
- Stern et al. (2007) Stern, S. A., D. C. Slater, J. Scherrer, J. Stone, M. Versteeg, M. F. A’Hearn, J. L. Bertaux, P. D. Feldman, M. C. Festou, J. W. Parker, and O. H. W. Siegmund (2007), Alice: The rosetta Ultraviolet Imaging Spectrograph, Space Science Rev., 128, 507–527, doi:10.1007/s11214-006-9035-8.
- Tenishev et al. (2008) Tenishev, V., M. Combi, and B. Davidsson (2008), A Global Kinetic Model for Cometary Comae: The Evolution of the Coma of the Rosetta Target Comet Churyumov-Gerasimenko throughout the Mission, Astrophy. J., 685, 659–677, doi:10.1086/590376.
- Tozzi et al. (1998) Tozzi, G. P., P. D. Feldman, and M. C. Festou (1998), Origin and production of C(1D) atoms in cometary comae, Astron. Astrophys., 330, 753–763.
- Vigren and Galand (2013) Vigren, E., and M. Galand (2013), Predictions of ion production rates and ion number densities within the diamagnetic cavity of comet 67p/churyumov-gerasimenko at perihelion, The Astrophysical Journal, 772(1), 33.
- Woods et al. (1986) Woods, T. N., P. D. Feldman, K. F. Dymond, and D. J. Sahnow (1986), Rocket ultraviolet spectroscopy of comet Halley and abundance of carbon monoxide and carbon, Nature, 324, 436–438, doi:10.1038/324436a0.
- Woods et al. (2005) Woods, T. N., F. G. Eparvier, S. M. Bailey, P. C. Chamberlin, J. Lean, G. J. Rottman, S. C. Solomon, W. K. Tobiska, and D. L. Woodraska (2005), Solar EUV Experiment (SEE): Mission overview and first results, Journal of Geophysical Research (Space Physics), 110, A01312, doi:10.1029/2004JA010765.
- Wu and Judge (1979) Wu, C. Y. R., and D. L. Judge (1979), The atomic oxygen 1304 Å emission produced through photodissociation of CO and CO2., Chemical Physics Letters, 68, 495–498, doi:10.1016/0009-2614(79)87245-0.
- Wu and Judge (1981) Wu, C. Y. R., and D. L. Judge (1981), Atomic carbon emission produced through photodissociative excitation of CO, The Journal of Chemical Physics, 75(6), 2826–2830, doi:10.1063/1.442355.
- Wu and Judge (1988) Wu, C. Y. R., and D. L. Judge (1988), Multichannel processes of H2O in the 18 eV region, The Journal of Chemical Physics, 89(10), 6275–6282, doi:10.1063/1.455392.
- Wu et al. (1978) Wu, C. Y. R., E. Phillips, L. C. Lee, and D. L. Judge (1978), Atomic carbon emission from photodissociation of CO2, J. Geophys. Res., 83, 4869–4872.
- Wu et al. (1979) Wu, C. Y. R., E. Phillips, L. C. Lee, and D. L. Judge (1979), Lyman- and balmer-series fluorescence from hydrogen photofragments of H2O vapor, The Journal of Chemical Physics, 70(2), 601–608, doi:10.1063/1.437539.
- Zhou et al. (2014) Zhou, Y., Q. Meng, and Y. Mo (2014), Photodissociation dynamics of superexcited O2: Dissociation channels O(5s) vs. O(3s), The Journal of Chemical Physics, 141(1), 014,301, doi:10.1063/1.4884906.