Searching for Electromagnetic Counterparts to Gravitational-wave Merger Events with the Prototype Gravitational-wave Optical Transient Observer (GOTO-4)
1 Department of Physics, University of Warwick, Gibbet Hill Road, Coventry, CV4 7AL, UK
2 School of Physics & Astronomy, Monash University, Clayton VIC 3800, Australia
3 OzGRav-Monash, Monash University, Clayton VIC 3800, Australia
4 Department of Physics and Astronomy, University of Sheffield, Sheffield, S3 7RH, UK
5 Instituto de Astrofísica de Canarias (IAC), E-38205 La Laguna, Tenerife, Spain
6 School of Physics & Astronomy, University of Leicester, University Road, Leicester LE1 7RH, UK
7 Armagh Observatory & Planetarium, College Hill, Armagh, BT61 9DG
8 National Astronomical Research Institute of Thailand, 260 Moo 4, T. Donkaew, A. Maerim, Chiangmai, 50180, Thailand
9 Department of Physics and Astronomy, University of Turku, FI-20014, Turku, Finland
10 University of Portsmouth, Portsmouth, PO1 3FX, UK
11 Jodrell Bank Centre for Astrophysics, Department of Physics and Astronomy, The University of Manchester, Manchester M13 9PL, UK
12 Department of Astrophysics/IMAPP, Radboud University, PO Box 9010, NL-6500 GL Nijmegen, The Netherlands
Abstract
We report the results of optical follow-up observations of 29 gravitational-wave triggers during the first half of the LIGO-Virgo Collaboration (LVC) O3 run with the Gravitational-wave Optical Transient Observer (GOTO) in its prototype 4-telescope configuration (GOTO-4). While no viable electromagnetic counterpart candidate was identified, we estimate our 3D (volumetric) coverage using test light curves of on- and off-axis gamma-ray bursts and kilonovae. In cases where the source region was observable immediately, GOTO-4 was able to respond to a GW alert in less than a minute. The average time of first observation was hours after receiving an alert ( hours after trigger). A mean of square degrees were tiled per event, representing on average per cent of the LVC probability map, or per cent of the observable probability. This coverage will further improve as the facility scales up alongside the localisation performance of the evolving gravitational-wave detector network. Even in its 4-telescope prototype configuration, GOTO is capable of detecting AT2017gfo-like kilonovae beyond 200 Mpc in favourable observing conditions. We cannot currently place meaningful electromagnetic limits on the population of distant ( Gpc) binary black hole mergers because our test models are too faint to recover at this distance. However, as GOTO is upgraded towards its full 32-telescope, 2 node (La Palma & Australia) configuration, it is expected to be sufficiently sensitive to cover the predicted O4 binary neutron star merger volume, and will be able to respond to both northern and southern triggers.
keywords:
gravitational waves – (transients:) black hole mergers – (transients:) black hole - neutron star mergers – (transients:) gamma-ray bursts – (transients:) neutron star mergers1 Introduction
Gravitational-Wave (GW) detections of compact object mergers are fast becoming common occurrences. During the first half of the advanced LIGO (aLIGO) - advanced Virgo (AdV) Collaboration (LVC) observing run 3 (O3a), which ran from April the 1st to September the 30th 2019, 33 candidate compact object merger events were reported, with 21 of these classified as most likely due to Binary Black Hole (BBH) mergers. The tantalising prospect of finding an electromagnetic (EM) counterpart to GW events warrants follow-up, particularly in light of the rich scientific yield attained following the detection of both GW and EM signals from the Binary Neutron Star (BNS) merger GW170817 (Abbott et al., 2017b). The dominant demographic of GW events, BBH mergers, are expected to be EM silent (Abbott et al., 2016), although numerous studies suggest that there is potential for an EM counterpart (Palenzuela et al., 2010; Moesta et al., 2012; Loeb, 2016; Murase et al., 2016; Perna et al., 2016; De Mink & King, 2017; Janiuk et al., 2017; Chang & Murray, 2018; McKernan et al., 2019), and a possible high-energy detection was claimed alongside GW150914 (Connaughton et al., 2016). Assessing observational constraints on the BBH merger population has value, because it helps to inform the follow-up strategy of “wide-fast” survey telescopes chasing GW triggers, and because constraints on the EM signal will naturally become more stringent as the sample increases. Furthermore, there is not yet sufficient observational evidence to rule out the possibility of an EM counterpart in BBH mergers.
More promisingly, the O3a GW trigger population also contains candidate BNS and Neutron Star-Black Hole (NSBH) mergers, which are expected to exhibit an EM signature, at least in some cases. The prime candidate for such a counterpart is a kilonova (KN; Li & Paczyński, 1998; Rosswog, 2005; Metzger et al., 2010; Barnes & Kasen, 2013; Metzger, 2017), where heavy unstable elements are formed in the neutron-rich environment of the merger via rapid capture (r-process) nucleosynthesis (Lattimer & Schramm, 1974; Eichler et al., 1989; Freiburghaus et al., 1999), and subsequently produce thermal emission as they decay radioactively. We may also expect to observe a short duration (s; Kouveliotou et al., 1993) gamma-ray burst (sGRB; Blinnikov et al., 1984; Paczynski, 1986; Eichler et al., 1989; Narayan et al., 1992; Rosswog et al., 2003; Belczynski et al., 2006; Fong & Berger, 2013), wherein the merger launches a relativistic jet that can be detected at high energies, and subsequently produces a broadband synchrotron afterglow as the ejecta decelerate and form shocks in the ambient environment (Blandford & McKee, 1976). The KN signature from an NSBH merger is expected to be different to those produced by a BNS (Kawaguchi et al., 2016; Tanaka et al., 2018; Barbieri et al., 2019) – typically predicted to be brighter in the infrared (e.g. Metzger, 2017; Kawaguchi et al., 2020), although see Foucart et al. (2019). There is also some evidence to suggest that NSBH mergers may be distinguishable in the observed sGRB population (e.g. Troja et al., 2008; Gompertz et al., 2020).
KNe and sGRBs are already known to be linked to one another through coincident detections (Berger et al., 2013; Tanvir et al., 2013; Yang et al., 2015; Jin et al., 2016; Kasliwal et al., 2017; Gompertz et al., 2018; Jin et al., 2018; Troja et al., 2018a; Jin et al., 2020; Lamb et al., 2019b; Troja et al., 2019; Jin et al., 2020), with both BNS and NSBH KN models employed. KNe and sGRBs were also confirmed to be linked to BNS mergers by the detections of GRB 170817A (Abbott et al., 2017b; Goldstein et al., 2017; Hallinan et al., 2017; Margutti et al., 2017; Savchenko et al., 2017; Troja et al., 2017; Margutti et al., 2018; Mooley et al., 2018; Troja et al., 2018b; D’Avanzo et al., 2018; Lyman et al., 2018) and the associated kilonova AT2017gfo (Blanchard et al., 2017; Chornock et al., 2017; Coulter et al., 2017; Covino et al., 2017; Cowperthwaite et al., 2017; Drout et al., 2017; Evans et al., 2017; Hjorth et al., 2017; Levan et al., 2017; Nicholl et al., 2017; Pian et al., 2017; Smartt et al., 2017; Soares-Santos et al., 2017; Tanvir et al., 2017; Villar et al., 2017) alongside GW170817 (Abbott et al., 2017a). In this instance, the sGRB afterglow was likely viewed somewhat away from the jet axis (Abbott et al., 2017a; Haggard et al., 2017; Kim et al., 2017; Lazzati et al., 2017; Lamb & Kobayashi, 2018; Mandel, 2018; Fong et al., 2019; Lamb et al., 2019a; Wu & MacFadyen, 2019).
Locating EM counterparts to GW detections remains an extremely challenging task due to the very large localisation uncertainties from the GW detectors. These uncertainties can span from hundreds to tens of thousands of square degrees, and while the localisation performance will improve as the detector network expands (Abbott et al., 2020a), wide-field survey telescopes remain essential when searching for associated transients. The Gravitational-wave Optical Transient Observer (GOTO; see Steeghs et al., in prep; Dyer et al. 2018) is one such facility. At design specifications, the project will include one northern node on La Palma (Spain), and one southern node (Australia), each of which will be equipped with 16 telescopes on two robotic mounts, with a field of view of square degrees per node. The facility will provide rapid-response tiling of the large LVC error boxes backed by an ongoing sky patrol survey. By exploiting its high cadence and wide field, GOTO can quickly identify potential GW counterparts and flag them for further photometric and spectroscopic follow-up. During O3a, GOTO consisted of four wide-field-of-view telescopes, each covering 4.8 square degrees, with a combined footprint of square degrees. GOTO’s first installation is located at the Observatorio del Roque de los Muchachos on La Palma and is able to scan the visible Northern hemisphere sky once every 14 days. Hereafter, “GOTO-4” specifically refers to the 4-telescope prototype configuration.
Outside of GOTO, there has been a widespread, sustained effort by the observational community to identify EM counterparts to GW triggers throughout the LVC O3 observing run. Numerous wide-field follow-up missions have tiled GW error boxes searching for transients, including the All-Sky Automated Survery for Supernovae (ASASSN; Shappee et al., 2014), the Asteroid Terrestrial impact Last Alert System (ATLAS; Tonry et al., 2018), the Deca-Degree Optical Transient Imager (DDOTI; Watson et al., 2016), the Dark Energy Survey (DES; Dark Energy Survey Collaboration et al., 2016), the Global Rapid Advanced Network Devoted to the Multi-messenger Addicts (GRANDMA; Antier et al., 2020b), KMT-Net (Kim et al., 2016), the Mobile Astronomical System of TElescope Robots (MASTER; Lipunov et al., 2010), MeerLICHT (Bloemen et al., 2016), PanSTARRS (Kaiser et al., 2010), Searches After Gravitational waves Using ARizona Observatories (SAGUARO; Lundquist et al., 2019), the Télescope à Action Rapide pour les Objets Transitoires (TAROT; Boër, 2001), the Visible and Infrared Survey Telescope for Astronomy (VISTA; Sutherland et al., 2015), the VLT Survey Telescope (VST; Capaccioli & Schipani, 2011) and the Zwicky Transient Facility (ZTF; Bellm et al., 2019). No associated transients were identified (Anand et al., 2020; Antier et al., 2020b, a; Coughlin et al., 2020; Sagués Carracedo et al., 2020), but constraining limits were placed on a number of milestone events, including S190814bv, the first NSBH merger candidate identified in GW (Dobie et al., 2019; Gomez et al., 2019; LIGO Scientific Collaboration & Virgo Collaboration, 2019; Ackley et al., 2020; Andreoni et al., 2020; Vieira et al., 2020; Watson et al., 2020), and several candidate BNS systems (Goldstein et al., 2019; Hosseinzadeh et al., 2019; Lundquist et al., 2019), including the unusually massive GW190425 (Coughlin et al., 2019; Hosseinzadeh et al., 2019; Lundquist et al., 2019; Abbott et al., 2020b).
In this paper, we investigate the 29 follow-up campaigns of GW triggers undertaken by GOTO-4 during the first half of the LVC O3 run (April to October 2019), before GOTO was upgraded to 8 telescopes. The success of GOTO-4 in tiling the LVC error boxes is discussed. While no GW-EM counterpart candidate detections were made, we assess GOTO-4’s volumetric coverage in 3D by employing test sources to represent the expected EM signatures accompanying GW events, using the O3a events as a benchmark test sample. The observable horizons are compared to the distance distribution of O3a BNS events. The findings are used to inform future strategy, and highlight areas of focus for future upgrades.
In Section 2 we further discuss the data acquisition from the LVC archives and the GOTO pipeline. Section 3 introduces our test sources, and their application is detailed in Section 4. We show our results in Section 5, which are discussed in Section 6. Finally, we present our key conclusions in Section 7. We assume a cosmology of km s-1 Mpc-1 and (Planck Collaboration et al., 2018) throughout.
2 Data Sample
2.1 LVC Superevents
GW triggers from individual LVC analysis pipelines are aggregated into “superevents”, which are announced on the Gamma-ray Co-ordinates Network (GCN) and presented on the Gravitational-wave Candidate Event Database (GraceDB111https://gracedb.ligo.org/). Initial position reconstruction of the GW source is performed by the BAYESTAR algorithm (Singer et al., 2014; Singer, 2015). The algorithm outputs a Hierarchical Equal Area isoLatitude Pixelization (HEALPix; Górski et al., 2005) all-sky map of the posterior probability, as well as the location, scale and normalisation of the conditional distance distribution for each pixel across a grid of millions. At a later time, the BAYESTAR reconstruction may be superseded by a volume reconstruction using LALInference (Aasi et al., 2013; Veitch et al., 2015), the Advanced LIGO Bayesian parameter estimation library. Skymaps are made available for download in the form of a Flexible Image Transport System (FITS; Wells et al., 1981) file.
Using the HEALPix maps, it is possible to calculate the probability contained in a particular region of sky, or to construct a probability density distribution with distance along a given line of sight (for comprehensive recipes, see Singer et al., 2016). Table 1 presents the 29 LVC superevents that were followed up by GOTO-4 during the first half of the LVC O3a run (excluding a further 3 triggers that were followed up but later retracted by the LVC). The mean and standard deviation of the all-sky posterior probability distance distribution (Singer et al., 2016) is shown, along with the classification of each event and the associated false alarm rate (FAR) from GraceDB. We also include the LVC astrophysical classification, which can be BBH (both binary components are constrained to M⊙), BNS (both binary components are constrained to M⊙), NSBH (one object is constrained to M⊙, and the other to M⊙) or MassGap (at least one of the binary components is constrained to be between M⊙ and M⊙). The terrestrial (noise) classification category is neglected. In all cases we perform our analysis with the most recently released probability map, and the given distances, classifications and FARs correspond to this map.
| Classification Probability | ||||||||
|---|---|---|---|---|---|---|---|---|
| Event | Distance | FAR | Announcement | |||||
| Mpc | Mpc | % | % | % | % | (year-1) | GCN | |
| S190408an | 1473 | 358 | >99 | 0 | 0 | 0 | 24096 | |
| S190412m | 812 | 194 | 100 | 0 | 0 | 0 | 24098 | |
| S190421ar | 1628 | 535 | 97 | 0 | 0 | 0 | 24141 | |
| S190425z | 156 | 41 | 0 | 0 | >99 | 0 | 24168 | |
| S190426c* | 377 | 100 | 0 | 6 | 24 | 12 | 24237 | |
| S190510g | 227 | 92 | 0 | 0 | 42 | 0 | 24442 | |
| S190512at | 1388 | 322 | 99 | 0 | 0 | 0 | 24503 | |
| S190513bm | 1987 | 501 | 94 | <1 | 0 | 5 | 24522 | |
| S190517h | 2950 | 1038 | 98 | <1 | <1 | 2 | 24570 | |
| S190519bj | 3154 | 791 | 96 | 0 | 0 | 0 | 24598 | |
| S190521g | 3931 | 953 | 97 | 0 | 0 | 0 | 24621 | |
| S190521r | 1136 | 279 | >99 | 0 | 0 | 0 | 24632 | |
| S190630ag | 1059 | 307 | 94 | <1 | 0 | 5 | 24922 | |
| S190706ai | 5263 | 1402 | 99 | 0 | 0 | 0 | 24998 | |
| S190707q | 781 | 211 | >99 | 0 | 0 | 0 | 25012 | |
| S190718y | 227 | 165 | 0 | 0 | 2 | 0 | 25087 | |
| S190720a | 869 | 283 | 99 | 0 | 0 | 0 | 25115 | |
| S190727h | 2839 | 655 | 92 | <1 | 0 | 3 | 25164 | |
| S190728q | 874 | 171 | 34 | 14 | 0 | 52 | 25187 | |
| S190814bv | 267 | 52 | 0 | >99 | 0 | >1 | 25324 | |
| S190828j | 1803 | 423 | >99 | 0 | 0 | 0 | 25497 | |
| S190828l | 1609 | 426 | 99 | 0 | 0 | 0 | 25503 | |
| S190901ap | 242 | 81 | 0 | 0 | 86 | 14 | 25606 | |
| S190910d | 632 | 186 | 0 | 98 | 0 | 0 | 25695 | |
| S190915ak | 1584 | 381 | >99 | 0 | 0 | 0 | 25753 | |
| S190923y | 438 | 113 | 0 | 68 | 0 | 0 | 25814 | |
| S190924h | 548 | 112 | 0 | 0 | 0 | 99 | 25829 | |
| S190930s | 709 | 191 | 0 | 0 | 0 | 95 | 25871 | |
| S190930t | 108 | 38 | 0 | 74 | 0 | 0 | 25876 | |
2.2 Data Collection with GOTO
Although we here present an offline analysis of the events, the data collection is driven by a low-latency realtime response. The LVC all-sky probability map is automatically ingested by the GOTO sentinel (Dyer et al., 2018), which analyses the map and produces a schedule of exposures across the observable probability region. These exposures are taken on a fixed grid of tiles on the sky to compare GOTO’s new exposure to a reference image of that same patch of the sky. Observations are scheduled as soon as the initial map is available, and updated whenever a map update is released.
GOTO has the capacity to do multi-band photometry, having three colour filters. However, for initial follow-up GOTO uses its wide L-band filter. This collects photons between 3750Åand 7000Å, roughly equivalent to a combination of GOTO’s B,G, and R filters and comparable to the combined passband of the SDSS and filters.
Each tile is comprised of images from all four telescopes and has a combined field of view of square degrees. The default strategy is to visit each tile at least twice per event, where each visit contains a set of 3x60 second exposures, which are conducted back-to-back in the wide L-band filter. The three exposures in each set are reduced and then median combined to create the science image. A reference image of the corresponding tile is then subtracted from the science image to identify any new transients. For BNS events, tiles are repeated in order to provide many passes over the skymap over the course of several nights.
2.3 Image Processing and Data Mining
Data are processed on a dedicated cluster of machines located in a Warwick server room. The cluster includes high CPU core count processing nodes, storage arrays and database nodes all connected via 10Gbit ethernet. An automated process flow ensures new image frames enter the process queue automatically as they are downloaded from the observatory. For the prototype, a single high-end processing node is sufficient to keep up with processing in realtime (about four 50Mpixel images each minute). The software stack has been developed by the consortium, and performs image level processing, astrometry and photometry calibration, image alignment and subtraction, and source/feature detection. The results are ingested into a PostgreSQL database in realtime to allow vetting of candidates with short latencies (Steeghs et al., in prep).
The initial stages of GOTO’s image reduction pipeline cover per-image bias subtraction, dark subtraction, flat-field correction, overscan correction and trimming. Following a source detection pass, an astrometric solution is found using astrometry.net (Lang et al., 2010) and photometric zero points are derived through comparison with either APASS V filter (Henden et al., 2016) or PS1 -filter magnitudes for a large number of field stars. The systematic uncertainty in the zero points varies between Unit Telescopes (UTs) and where a source falls on a given image, but is typically better than mags. A set of exposures (usually 3) are then median-combined, correcting for any astrometric offsets between exposures. For each median stack, a reference image is identified (if available), which then triggers the difference imaging stage, using the HOTPANTS tool (Becker, 2015).
Features are detected on the subtracted images and passed to a random forest classifier. This makes use of a number of source attributes such as flux, full-width half maximum, local noise level, etc. in an attempt to filter out artefacts and cosmics. During the prototype phase, GOTO employs a temporary classifier that is similar in structure to that of Bloom et al. (2012) and it was trained using an injected source data-set. However, this is an area of active development within the collaboration and will be replaced in the next iteration of the pipeline (Mong et al. in prep; Killestein et al. in prep). Low scoring sources are marked bogus leaving human judgement to vet any remaining high-confidence sources. Features with a reasonable classifier score are then ingested into the GOTO “Marshall”, which presents source and contextual information via a browser for human inspection. This entire process is completed approximately 10-20 minutes after the images are taken in the current prototype pipeline. Human candidate vetting takes place in real-time alongside the follow-up campaign, which typically lasts for several days following a trigger. Any announcements are disseminated via a GCN circulars and/or TNS submissions. For the purpose of this paper, the data are mined after a campaign has been completed using a script which pulls all observations linked to each event. The observations are analysed and their meta-data is taken to assess follow-up performance.
3 Test Sources
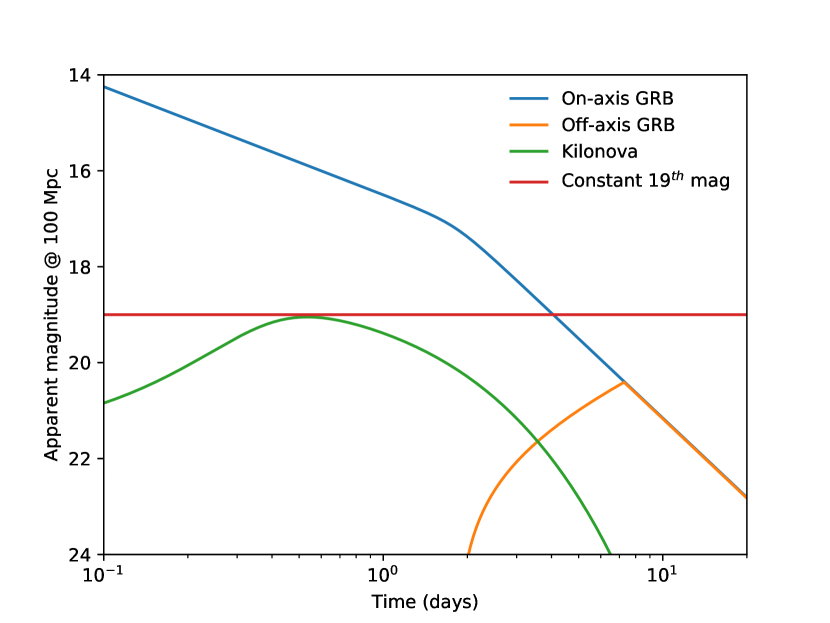
In order to assess our coverage along the radial distance of the LVC skymap, we must define a test source to recover. For this analysis, we define three physically motivated light curves, as well as a reference source with a constant magnitude. Our physically motivated sources are:
-
1.
A gamma-ray burst afterglow, viewed along the jet axis (see Section 3.1).
-
2.
A gamma-ray burst afterglow viewed off-axis.
- 3.
These three phenomena are associated with compact object mergers, though none are necessarily expected to accompany the merger of a BBH. However, we note the possible Fermi-GBM detection of GW150914 (Connaughton et al., 2016), and the subsequent theoretical works that attempt to link (weak) GRBs with BBH mergers, as well as some additional optical phenomena (Perna et al., 2016; Murase et al., 2016; De Mink & King, 2017; Janiuk et al., 2017; Chang & Murray, 2018). A kilonova-like emission profile remains the only electromagnetic accompaniment to have been detected alongside a GW signal within the wavelength range and timescales covered by GOTO (GW 170817/AT2017gfo; Abbott et al., 2017b), albeit from a neutron star origin. A constant source of is also included in our analysis as a comparison case. This allows us to measure how well GOTO-4 would have performed in retrieving a persistent and reasonably bright new object in a given search field.
Our model light curves are all constructed in the and filters. The mean of these two models provides a close match to the GOTO’s L-band, which is used during GW follow-up. Light curves at a representative 100 Mpc distance are shown in Fig. 1.
3.1 Gamma-Ray Burst Models
Our GRB afterglow model light curves are constructed following Sari et al. (1998). We assume fairly typical physical parameters for sGRBs (e.g. Fong et al., 2015; Gompertz et al., 2015). The isotropic equivalent energy in -rays, ergs, the fraction of energy contained in the emitting electrons, , and the fraction of energy contained in the magnetic fields, . The circumburst environment is assumed to have a constant density with radial distance, with a particle density of cm-3. Electrons in the forward shock are assumed to be accelerated into a power law distribution of Lorentz factors with an index of . The half-opening angle of the jet is set to rad (). These parameters result in a jet break at days (cf. Granot et al., 2018).
In the off-axis case, we use the analytical solution from Granot et al. (2018) for the jet break time
| (1) |
and peak flux time
| (2) |
where is the beaming-corrected energy in units of erg. The flux is assumed to be zero at then rises smoothly until its maximum at . At the flux evolves following the standard on-axis evolution. All physical parameters are set to be the same as the on-axis case, including the jet half-opening angle. We assume that the observer is located at an angle of rad () from the jet axis. This choice reflects a more optimistic case that provides a (comparatively) bright signal in the absence of a GRB prompt trigger. As the observer moves further from the jet axis, the expected signal becomes fainter, and the light curve peaks later.
3.2 Kilonova Model
Our Bazin function model is based on the kilonova AT2017gfo. Following the method of Gompertz et al. (2018), we fit Bazin or exponential functions to the full dataset222curated on kilonova.space (Guillochon et al., 2017) (Andreoni et al., 2017; Arcavi et al., 2017; Cowperthwaite et al., 2017; Díaz et al., 2017; Drout et al., 2017; Evans et al., 2017; Lipunov et al., 2017; Pian et al., 2017; Shappee et al., 2017; Smartt et al., 2017; Tanvir et al., 2017; Valenti et al., 2017; Villar et al., 2017; Pozanenko et al., 2018) to obtain the phenomenological evolution of the (including , F475W and filters) and (including , F606W, F625W and filters) bands. The rise and peak of the and bands are unconstrained for AT2017gfo; in both filters the light curve is best fit with an exponential profile that has a decay time of days and days, and a normalisation of Jy and Jy. To avoid over-estimating the flux at early times, we modify both functions from exponential to Bazin by adding a rise time of days, and days, where is the peak emission time. The resulting light curves are consistent with the data, although the rise and peak parameters are not strictly constrained. Our L-band magnitudes are derived by assigning an equal weighting to the and -band models.
4 Method
We first assess the combined GOTO-4 sky coverage for each event. There are two sources of overlap in the observations: firstly, between individual pointings (tiles) on the sky, and secondly, each tile is the combined footprint of 4 UTs, which themselves overlap one another (see Fig. 2). While this setup is advantageous because it eliminates the chip gap problem seen in other survey missions (and aids intra-telescope calibration) it makes calculating sky coverage more complex, because simply summing the on-sky footprint of the each image (1/telecope) results in a lot of double (or more) counting. Fortunately, a natural solution to double counting coverage is available in the form of the pixel grid in the LVC HEALPix maps. The Healpy333https://healpy.readthedocs.io/en/stable/index.html query_polygon routine returns the indices of pixels contained within a user-defined polygon, meaning that we can generate a pixel coverage list by entering the coordinates of the corners of each individual UT snapshot. GOTO-4 sky coverage is then calculated by summing the area of all unique pixel instances in the list. Similarly, the total probability covered is calculated by summing the probability contained within every unique pixel covered. We calculate coverage with the “inclusive” keyword set to False when running query_polygon, meaning that only pixels with centres that lie within our observed area are counted. The typical pixel size of the HEALPix maps is square arc minutes; much smaller than the total areas counted.
4.1 Volumetric Coverage
To assess our volumetric coverage, we compare our test source models (Section 3) at each observing epoch to the limiting magnitude of the science image in order to assess from how far away they could be detected. Model magnitudes are corrected for Galactic extinction using an all-sky foreground reddening, , HEALPix map based on the results of Schlegel et al. (1998), which is available for download from the Goddard Space Flight Center website444lambda.gsfc.nasa.gov/product/foreground/fg_sfd_get.cfm. Extinction corrections are applied based on which pixel of the reddening map each LVC probability map pixel falls into. The two maps typically have comparable resolution (within a factor of two), but variability in the dust maps on scales of less than arc minutes2 is lost due to being averaged over the pixel. Schlegel et al. (1998) values of are converted to the more recent findings of Schlafly & Finkbeiner (2011) using (Schlafly et al., 2010; Schlafly & Finkbeiner, 2011).
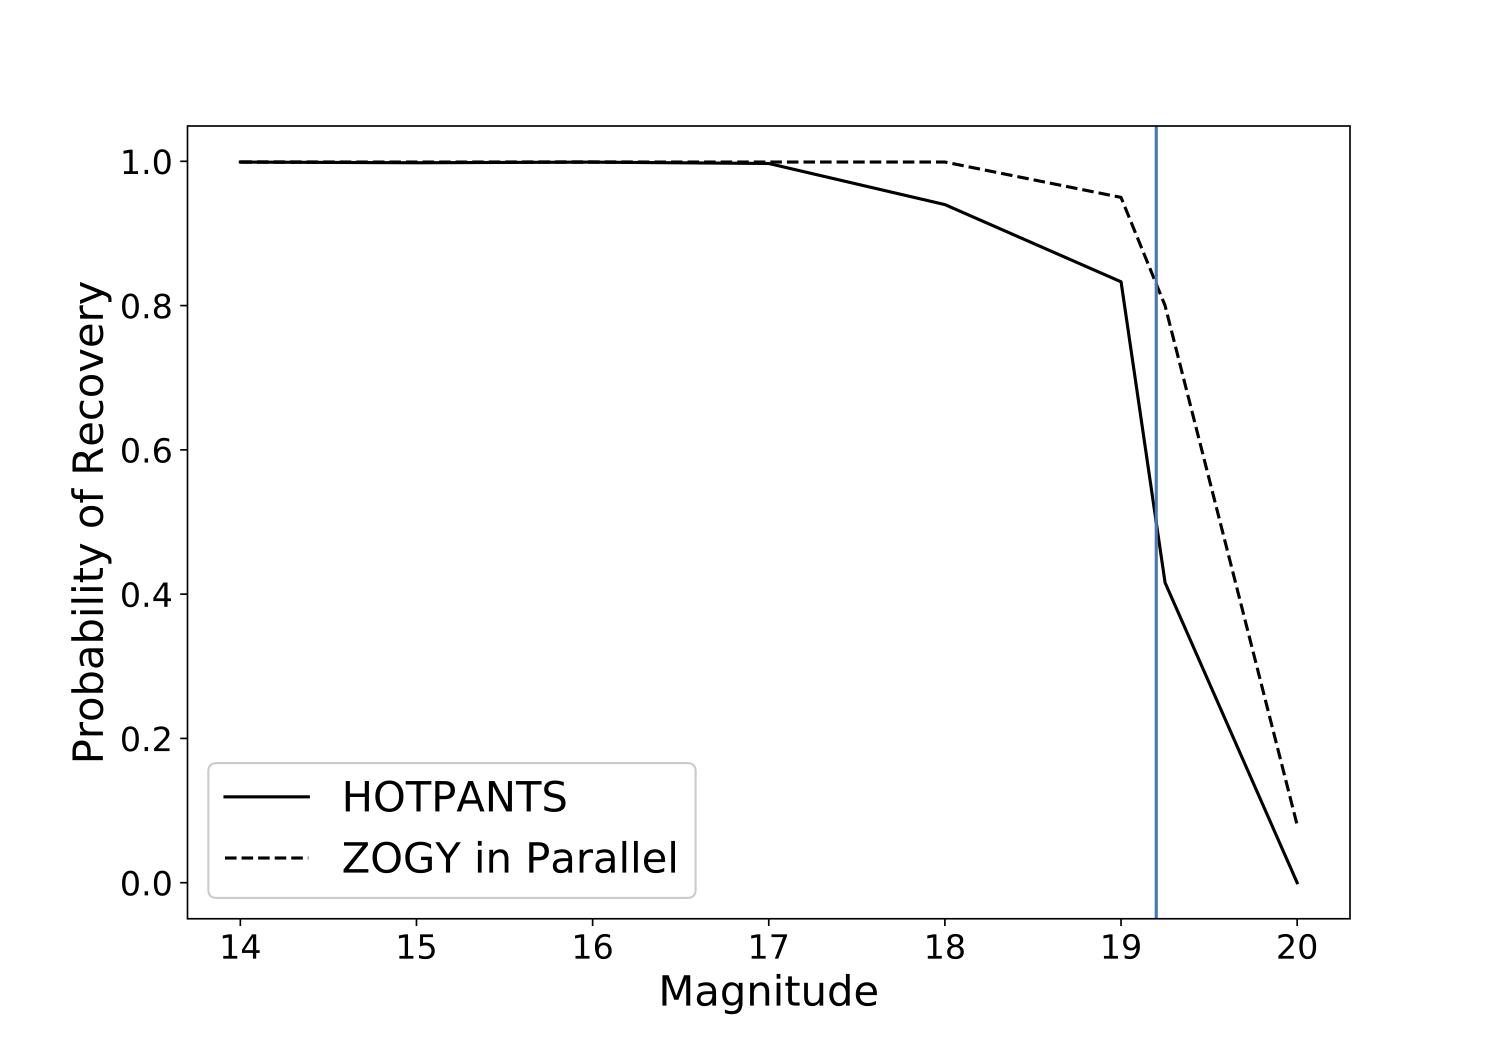
Next, we calculate the horizon out to which our extinction-corrected test-source magnitude could be detected by GOTO-4 for each observation. The horizon is defined as the distance from which the extinction-corrected test-source magnitude would be equal to the 5 upper limit of a given image, . This limit is based off the science frame. This determines the optimal depth the transient search can achieve from image subtraction (assuming the reference image can see deeper). is stored in the FITS header of the GOTO-4 observation, and is defined using the pipeline zero-point derived limiting magnitude. Where there are multiple visits to the same LVC probability map pixel, we take the visit with the farthest horizon, and discard the duplicates. Our definition of the horizon implicitly treats as a “hard” cutoff, where everything brighter is detected and everything fainter is missed. In practice, represents the average magnitude limit for a given image, which means that in some cases brighter objects would be missed within the horizon, and fainter objects could be detected beyond it (e.g. due to background noise fluctuations, proximity to bright stars, etc). However, the recovery curve, while not a box function, is found to be very steep (Fig. 3), making our hard limit assumption a useful working approximation. In brief, the recovery curve was built by injecting a large number of mock transients into the images, using a large sample of images from the O3a observations and covering a wide range of magnitudes. These fields are then image subtracted, using two different methods, and an automatic source extraction test is done using SExtractor. If a source is found within 2 pixels of its injected location it is counted as recovered. Full details of the process are available in Cutter et al. (in prep). The output shown here is expected of a typical GOTO exposure. For our analysis we show both the HOTPANTS curve that is close to the prototype pipeline performance, as well as the ZOGY in Parallel implementation that is under development.
This again supports our working assumption in terms of using our O3 campaigns as guidance towards future strategy, and performance will be further improved. We also note that variations in across the images are significantly larger than this particular effect, and is the dominant contribution in terms of the overall coverage achieved.
Finally, LVC probability map pixels are sorted into groups of equal observable horizon, where their probability density functions are summed (cf. Singer et al., 2016), and the combined probability density function of each group is integrated out to their shared horizon. Our full volumetric probability coverage is then the sum of all of the groups.
4.2 Coverage of an AT2017gfo-like Event
While it is important to assess our coverage of all existing GW events, the main targets of EM follow-up facilities like GOTO are BNS mergers that are (relatively) nearby, since these events are the most likely to produce a detectable signature in the form of a KN. AT2017gfo remains the only KN detected alongside a BNS merger that was confirmed by GW detections, and hence is the gold standard. We therefore also assess our coverage and follow-up strategy by calculating the maximum observable horizon of an AT2017gfo-like event in each LVC probability map, and how much of the 2D probability coverage GOTO obtained can be recovered when increasing the assumed distance to the test source. Note that this test is done in addition to the test described in Section 4.1, which was performed on all four test models including our KN analogue.
The method is largely the same as in Section 4.1, except that the test source is always the composite - and -band Bazin function fit to AT2017gfo. Instead of constructing and integrating the probability density functions from the LVC skymap, we calculate the expected extinction-corrected magnitude of AT2017gfo in each HEALPix pixel for distance increments out to 500 Mpc. These magnitudes are compared to , and the column in each line of sight is considered to be covered for the given distance where the magnitude is brighter.
| Response Time | 2D Coverage | 3D Coverage | KN Range | ||||||||||||
| Event | Area | D50 | D0 | ||||||||||||
| (hours) | (hours) | (deg2) | (%) | (%) | (%) | (%) | (%) | (%) | (Mpc) | (Mpc) | (Mpc) | ||||
| S190408an† | 11.4 | 10.8 | 156.1 | 20.2 | 23.8 | 31 | 70 | 135 | |||||||
| S190412m† | 15.0 | 14.0 | 295.2 | 94.4 | 94.7 | 107 | 117 | 151 | |||||||
| S190421ar | 48.3 | 29.1 | 114.3 | 8.88 | 36.6 | 57 | 61 | 66 | |||||||
| S190425z | 12.4 | 9.50 | 2667.1 | 22.0 | 38.1 | 46 | 134 | 227 | |||||||
| S190426c | 5.30 | 5.00 | 772.7 | 54.1 | 70.2 | 4 | 44 | 136 | |||||||
| S190510g | 1.42 | 0.40 | 116.1 | 0.21 | 0.55 | 48 | 55 | 57 | |||||||
| S190512at | 2.78 | 2.50 | 315.1 | 87.1 | 92.4 | 22 | 60 | 154 | |||||||
| S190513bm† | 0.55 | 0.05 | 116.2 | 28.5 | 76.3 | 56 | 83 | 120 | |||||||
| S190517h† | 15.9 | 15.2 | 112.7 | 14.8 | 51.6 | 49 | 67 | 84 | |||||||
| S190519bj† | 5.35 | 4.35 | 664.8 | 84.7 | 85.3 | 43 | 69 | 161 | |||||||
| S190521g | 0.13 | 0.05 | 393.2 | 43.7 | 86.7 | 94 | 107 | 126 | |||||||
| S190521r† | 15.2 | 15.1 | 720.7 | 91.9 | 92.9 | 9 | 51 | 93 | |||||||
| S190630ag | 2.40 | 2.40 | 1170.3 | 60.9 | 79.5 | 71 | 112 | 150 | |||||||
| S190706ai | 0.33 | 0.03 | 543.9 | 36.7 | 48.5 | 55 | 94 | 168 | |||||||
| S190707q | 12.4 | 11.7 | 722.9 | 34.4 | 59.3 | 18 | 53 | 122 | |||||||
| S190718y† | 6.58 | 6.10 | 242.5 | 61.2 | 72.9 | 10 | 27 | 90 | |||||||
| S190720a | 0.08 | 0.04 | 1358.3 | 62.1 | 73.3 | 42 | 54 | 163 | |||||||
| S190727h | 15.0 | 14.9 | 714.7 | 42.3 | 93.5 | 52 | 66 | 140 | |||||||
| S190728q | 14.8 | 14.5 | 146.9 | 89.5 | 94.0 | 114 | 124 | 139 | |||||||
| S190814bv | 1.83 | 1.50 | 717.9 | 94.1 | 99.1 | 55 | 61 | 81 | |||||||
| S190828j | 16.1 | 15.8 | 442.2 | 9.11 | 81.6 | 34 | 105 | 149 | |||||||
| S190828l | 16.9 | 16.5 | 453.6 | 1.94 | 50.5 | 127 | 138 | 154 | |||||||
| S190901ap | 0.12 | 0.04 | 2523.5 | 38.3 | 45.3 | 62 | 88 | 144 | |||||||
| S190910d | 0.13 | 0.03 | 1675.0 | 41.2 | 85.1 | 28 | 69 | 148 | |||||||
| S190915ak | 29.9 | 29.8 | 18.2 | 0.08 | 0.08 | 10 | 10 | 15 | |||||||
| S190923y† | 13.8 | 13.7 | 723.7 | 39.4 | 59.7 | 46 | 95 | 120 | |||||||
| S190924h | 2.97 | 2.90 | 281.3 | 70.2 | 73.1 | 61 | 75 | 101 | |||||||
| S190930s | 6.28 | 6.20 | 2139.9 | 92.2 | 92.2 | 13 | 89 | 142 | |||||||
| S190930t† | 12.8 | 12.7 | 918.2 | 6.84 | 9.91 | 48 | 109 | 130 | |||||||
| Mean | 9.90 | 8.79 | 732.3 | 45.3 | 64.4 | 48 | 79 | 126 | |||||||
| Median | 6.58 | 6.20 | 543.9 | 41.2 | 73.1 | 1.03 | 0 | 48 | 70 | 136 | |||||
5 Results
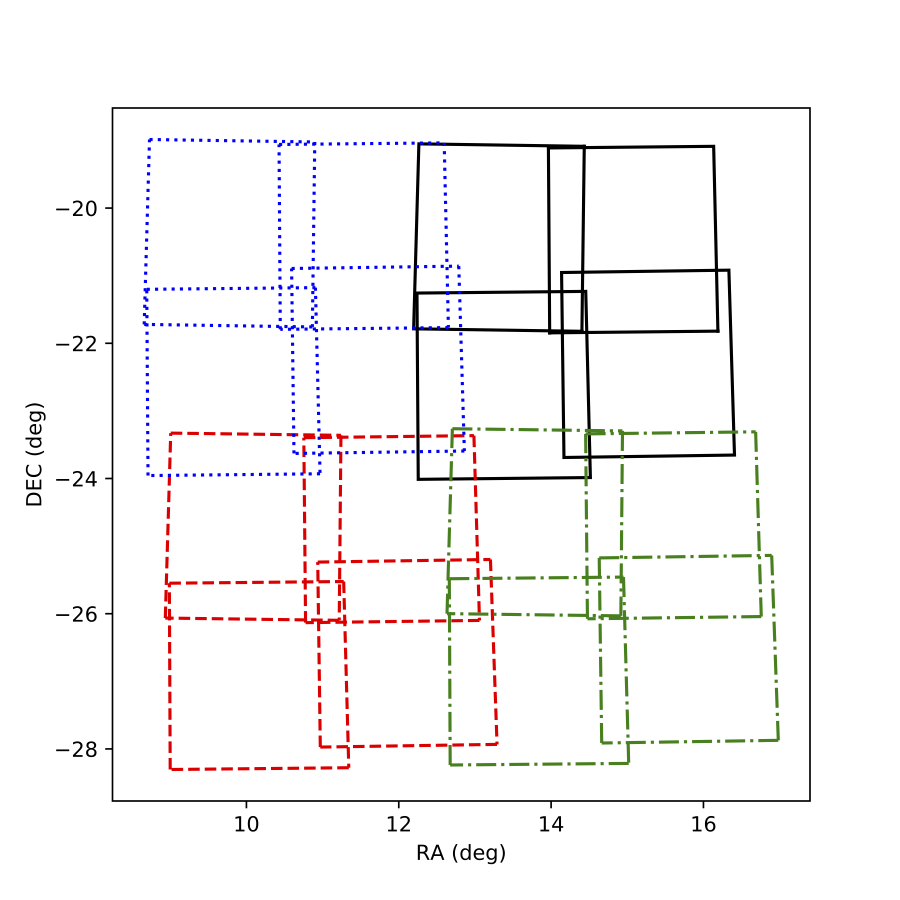
Results of the 29 GOTO-4 follow-up campaigns from the first half of the LVC O3 run are shown in Table 2. On average, GOTO-4 began observations hours after receiving an LVC preliminary alert ( hours after trigger), and tiled square degrees of the sky per LVC superevent, encompassing per cent of the localisation probability. When observations were unconstrained at the time of the alert (i.e. night time, with the field above the altitude limit), GOTO-4 began observations less than a minute after receiving the LVC preliminary notice. As an example, Fig. 4 illustrates our follow-up of S190923y, which represents the ‘mean’ campaign given that we covered square degrees and per cent of the probability in this case (see Table 2). We also calculate the total probability available to GOTO-4 from its site on La Palma for each event, i.e. the probability that lies within the region of the sky above the telescope’s minimum altitude constraint (30 degrees) and away from the Sun. These are shown as pAvis in Table 2. On average, per cent of the total probability was observable for a given event over a 2 to 3 night period, meaning that GOTO-4 tiled per cent of the available probability per event on average.
Notably, GOTO-4 tiled more than 500 square degrees on more than half of its campaigns (15), and more than 1000 square degrees on 6 different occasions. This achievement clearly highlights the value of rapid-response, wide-field instruments when searching for poorly-localised transient events. GOTO-4’s volumetric coverage is also presented in Table 2, expressed as the percentage of the three dimensional probability map probed for each test source. The recovery performance is predictably diminished; EM follow-up facilities are not designed to search for predominantly BBH mergers at a mean distance of Gpc. However, GOTO-4 was able to cover almost 10 per cent of the total probability volume on average for an on-axis GRB model. We can rule out our test case on-axis GRB in the observed area in three events (S190510g, S190814bv and S190930t) to better than . In order to place an approximate limit on emission from a BBH merger, we take the mean of the least constraining observation within one day after trigger across every BBH follow-up campaign. This is a upper limit of on emission from a BBH merger inside the GOTO-4 field of view and during the GOTO observing epochs at times of less than 1 day after GW trigger.
Such wide searches do uncover a significant number of candidate detections. Following the automated classifier mentioned previously, and an automatic check against known MPC objects (which otherwise would dominate), we are typically presented with on average one high confidence transient candidate per 15 deg2 during the O3a searches. Contextual information from external catalogs is used to sort these and flag interesting candidates in the context of the GW search. False positives include un-catalogued variable stars and flare stars, which were ruled out as counterparts via comparison with PS1 images. Many other candidates were disregarded as potential counterparts using the on-sky proximity and redshift of any nearby galaxies through the GLADE catalogue (Dálya et al., 2018), or via a pre-trigger reported detection either in our own detections tables, or already reported by others as a known transient in the Transient Name Server (TNS).
Some of the GOTO photometry of unassociated and uncatalogued transients were reported to the TNS where they were high confidence. However, since O3a was very much a test run for the project and its transient classification stack, we relied on several layers of human confirmation and also required multiple detections. Furthermore, automated TNS submission was not in place and generally we did not report photometry if other projects had already done so, unless it turned out to be a true object of interest. We intend to speed-up this process and improve our classifier robustness going forward so that we can increase our chances of being the first to report.
The expected number of events of each type in our sample are presented in Table 3. We present the results for the localisation map as a whole, for the area tiled by GOTO-4, and for those events closer than 250 Mpc, which are our main targets of interest with GOTO. For off-axis GRBs, KNe and our constant 19th magnitude test sources, the expected rates are essentially unchanged when limiting our results to those events within 250 Mpc. This fact indicates that distant (> 250 Mpc) events do not contribute to the probability of detecting sources of this type. In contrast, the chances of detecting an on-axis GRB is greatly diminished when limiting the search volume; their much greater luminosities mean that they can be detected from much further away.
The GW population is dominated by distant BBH mergers, but for nearby ( Mpc) triggers where the majority of the probability map can be observed and tiled in a two night campaign, GOTO-4 can expect to detect a KN similar to AT2017gfo in fewer than 5 campaigns if one is present in each skymap. This is due to the still relatively poor localisation performance of the current GW detector network, coupled with the relatively limited coverage of the GOTO-4 prototype. This will improve substantially in the future (Abbott et al., 2020a), as further discussed below.
| Events | GRB | Off-axis GRB | KN | 19th mag | |
|---|---|---|---|---|---|
| Whole map | 29 | ||||
| Obs | 29 | ||||
| Nearby | 5 | ||||
| Nearby, obs | 5 | ||||
| BBH | 17 | ||||
| BNS | 5 | ||||
| All non-BBH | 12 |
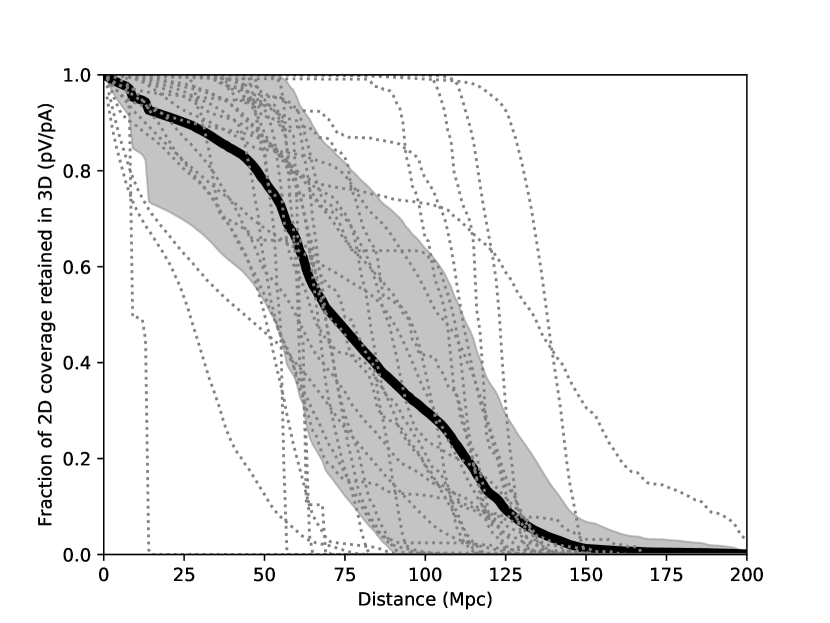
Table 2 includes the horizons out to which we retain 90, 50 and 0 per cent of our 2D coverage for an AT2017gfo analogue, following the method in Section 4.2. For example, if GOTO covered 100 per cent of the probability in the LVC skymap in 2D, represents the distance (in Mpc) out to which we probe deep enough to still cover 90 per cent of the probability – where the lost 10 per cent lies along sight lines that were not probed with sufficient depth to recover the transient. indicates that 50 per cent of the observed probability is retained, and represents the distance at which no GOTO-4 observation was sufficiently deep to recover an AT2017gfo-like KN. This ‘completeness’ versus distance for each event is also shown in Fig. 5, along with the mean of all events. These results show that with reasonable observing conditions, GOTO-4 can detect an AT2017gfo-like event out beyond 100 Mpc, and is capable of achieving 200 Mpc in a favourable line of sight. Of further encouragement is the duplication factor; on average, GOTO-4 observed a given LVC skymap pixel times during a campaign (due to a combination of repeat visits and tile/UT overlap), meaning that there is a great deal of scope to improve the observable horizon through image stacking. In some cases, however, the observable horizon is held back by poor observing conditions. These conditions include clouds, high airmass, a bright moon, or even an unfavourable Galactic pointing resulting in high extinction along the line of sight.
6 Discussion
6.1 General Constraints
We find that limits on EM emission from the O3a population of BBH mergers using GOTO-4 are currently unconstraining. Under the assumption that every event does contain one of our test sources (an assumption that is extremely unlikely to be true in practice), we would require more than BBH events to place any meaningful limits with our O3a configuration. However, with information on the inclination of the system, we may be able to constrain BBH mergers as GRB progenitors after fewer than 50 events. GOTO-4 covered almost 10 per cent of the LVC probability volume on average for an on-axis GRB model during O3a, and hence we would expect to find an on-axis GRB in one in ten events if one is present in each case. These constraints will tighten as coverage is significantly improved going forward, thanks to the scaling up of GOTO and the improved localisation precision from the LVC. More generally, GOTO-4 places a mean limit of in the observed area within one observer frame day from trigger for all BBH events (where observations were taken inside this window). This figure comes from taking the mean value of the least constraining tile from each campaign. However, it does not include foreground extinction, and the observations do not cover the full 24 hour period.
Our analysis suggests that the current GOTO-4 follow-up strategy for GW triggers is not suited for placing constraints on associated off-axis GRBs. This limitation arises for two reasons: the first is that they are faint compared to the other expected transients (see Fig. 1) and the second is that the GOTO follow-up strategy focuses on the first two or three nights after the trigger (as is appropriate for KNe), whereas off-axis GRBs will peak several days later than this. The time of observation is the more impactful of the two factors, and we still expect to find untriggered off-axis GRBs in the survey data, because their intrinsic brightness lies well within GOTO’s capability. In the future, GOTO will be able to go deeper faster as more telescopes are deployed, and the LVC localisations will improve, leaving smaller error regions to search. Our findings here suggest that the GOTO GW follow-up strategy may benefit from returning to a candidate field after – days post-trigger, in order to better constrain the possibility of an off-axis GRB. Such discoveries were indeed made during O3 (Kool et al., 2019; Perley et al., 2019), highlighting the scientific potential for revising the strategy.
Our KN model is based on AT2017gfo, a confirmed BNS merger (Abbott et al., 2017a). NSBH mergers are also expected to produce KNe, and their emission profiles may be quite different. If the NS plunges directly into the BH without material being disrupted (the fate of the NS depends primarily on the binary mass ratio and the BH spin; Shibata & Taniguchi, 2011; Kawaguchi et al., 2015; Kyutoku et al., 2015; Foucart et al., 2018), then no EM transient is expected at all. The LVC analysis suggested that this was the case for all of the NSBH merger candidates during O3a (S190814bv, S190910d, S190923y and S190930t; Ligo Scientific Collaboration & VIRGO Collaboration, 2019u, x, y, z). If tidal stripping occurs during inspiral, then material may remain outside of the BH event horizon, and a KN can be produced. In the optical frequencies at which GOTO-4 observes, this KN may in fact be fainter than an AT2017gfo analogue, unless a significant (M⊙) amount of matter is ejected (e.g. Kawaguchi et al., 2020; Zhu et al., 2020). However, for a larger ejecta mass, this signal may in fact be brighter instead. A KN from an NSBH merger may therefore be brighter than AT2017gfo, fainter, or absent entirely. Like with BNS mergers, we emphasise that a significant diversity of light curves are likely to be produced in nature, and that our use of AT2017gfo (as the best-studied and most concrete example) is as a known representative.
6.2 The Binary Neutron Star Population
When focusing on nearby (< 250 Mpc) events, or those classified as a BNS merger (where BNS is the most probable classification, excluding terrestrial), the prospects of a detection are naturally greatly improved. Table 2 shows that the average GOTO-4 follow-up campaign probes sufficiently deeply to detect AT2017gfo ( Mpc; Hjorth et al., 2017) because the mean Mpc. This means that 90 per cent of observed sight lines, by probability contained, are probed deeply enough to detect AT2017gfo at a distance of 48 Mpc. Similarly, per Table 2, the average response time of hours is fast enough to catch the peak of the emission, and typically per cent of the available probability is covered. In favourable conditions the telescope can detect a similar event out to Mpc. Notably, Table 3 shows that the chances of detecting a KN is a strong function of the 2D coverage, given the large jump in probability when we calculate our expectations for the surveyed area. This fact will be further exploited by the expansion of the GOTO network, both in terms of an increased number of telescopes as well as a 2nd node in the southern hemisphere. When fully deployed, this amounts to 2x16 scopes, a factor of 8 more than the GOTO-4 prototype presented here. This will allow faster tiling and more comprehensive and deeper coverage.
Table 3 indicates that in its current configuration, with no stacking, GOTO-4 can expect to find one AT2017gfo-like KN per few tens of events observed within 250 Mpc. This relatively low estimated discovery rate is primarily due to the O3a BNS sample being more distant on average than pre-O3 expectations, where the ‘most likely’ estimate of Abadie et al. (2010) suggested BNS mergers per year within 100 Mpc (with expectations ranging from to events). More recent rate estimations following the LVC O1 and O2 runs predicted – BNS mergers per year (Abbott et al., 2019), and the most recent estimate from the LVC, which includes GW190425 (The LIGO Scientific Collaboration et al., 2020, here S190425z), constrained the rate of BNS mergers within 100 Mpc to be between and events per year.
A naïve estimate, based on the 5 candidate BNS mergers during the first half of O3 ( months) and using the most distant detection (377 Mpc; S190426c) to define the radius of the observed volume, implies a rate of Mpc-3yr-1. This indicates that based on the observed population of candidate BNS mergers during the first half of O3, only BNS merger events within 100 Mpc are expected; towards the lower end of the Abadie et al. (2010); Abbott et al. (2019) and The LIGO Scientific Collaboration et al. (2020) rate estimates. However, our estimate assumes that the GW detector network was always on during O3a, and does not account for the variation in the measured candidate masses. It also implicitly assumes that all of the candidate BNS events are indeed astrophysical. Such an assumption has further implications for their classifications – for example, under the assumption that S190426c is of astrophysical origin, it is found to more likely be an NSBH merger (Ligo Scientific Collaboration & VIRGO Collaboration, 2019f). Our naïve estimate therefore provides a rough guide as to the volumetric BNS merger rate, but should be treated with caution.
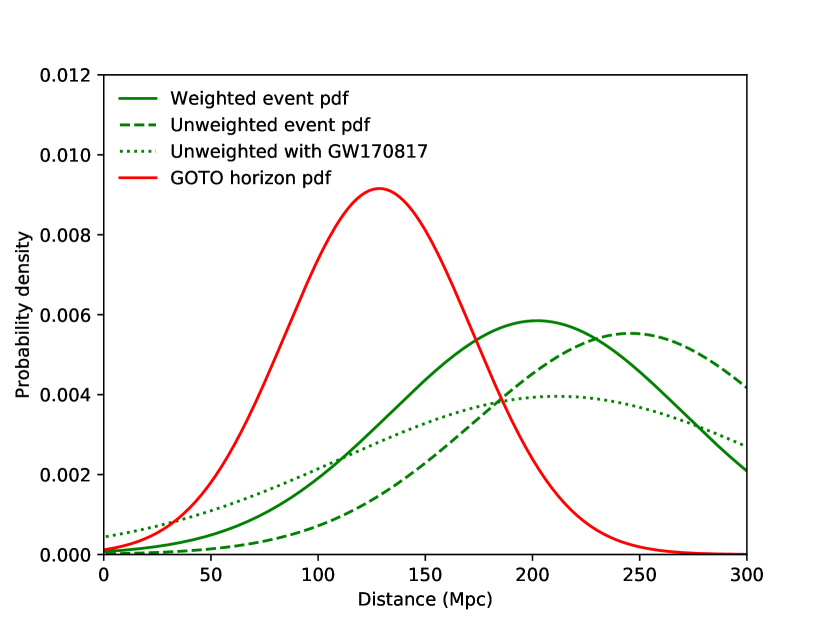
Fig. 6 shows the distance distribution of events classified as BNS by the LVC alongside the distribution of observable horizons (assuming a Bazin model) achieved by GOTO-4 during LVC follow-up. We make 100,000 draws from the GOTO-4 horizon probability density function (PDF), and compare it to 100,000 draws from both the weighted event distance PDF (the weighting for each BNS is , see Table 1), and the unweighted event distance PDF including GW170817. Assuming each draw is a unique event with unique follow-up, we find that GOTO-4 reaches the depth required for a detection in () per cent of cases for the weighted (unweighted + GW170817) distributions.
6.3 Factors that Influence Performance
We further investigate events with unusually high or low observable horizons. The average maximum horizon achieved was Mpc (mean standard deviation in the sample). The LVC superevents with the worst observable horizons are S190915ak, S190510g and S190421ar. At 15 Mpc, S190915ak is the worst by far, and the explanation is an unfortunate combination of high airmass (2) and a bright moon ( per cent illumination). These poor conditions were coupled with a single observing epoch taken almost a full day after peak, when our test model had decayed almost a full magnitude from maximum brightness. For S190510g, we attained a maximum horizon of 57 Mpc. The airmass was though the illumination was low at just 30 per cent. In this case, the largest detrimental factor was actually observing too early; all epochs were within days of the trigger, preceding the rapid rise to peak of the test model (Fig. 1). The contemporaneous model was two magnitudes below peak. S190421ar had a maximum observable horizon of 66 Mpc, an airmass of a fairly high moon illumination of 77 per cent, and also endured high winds, which were on average 21 km/h during exposure. This event also suffered from higher extinction along the line of sight compared to the other campaigns, with a median value of mags; more than double the typical median. Furthermore, this event was only observed two days after trigger; two magnitudes below the model peak.
At the high end of the observable horizon distribution, only S190425z is more than above the mean. The maximum observable horizon achieved in this case was 227 Mpc. The moon illumination was 51 per cent, and the airmass was low, at . While these conditions are clearly better than the three aforementioned cases, perhaps the biggest contributor to the distant horizon is the fact that the bulk of the observations were taken right at the peak of our model flux. The next highest horizon in the sample was 168 Mpc for S190706ai, which had an airmass of and a moon illumination of 34 per cent. These conditions are very similar to S190510g, with the key difference being that S190706ai was observed much closer to the model peak (though not as close as 190425z).
The depth of is clearly affected by the weather, wind shake, airmass, moon brightness, and the telescope optics, among other things. However, the indication from our analysis of the O3a campaign is that while observing conditions do play a role in determining from how far away we can expect to detect a KN (and can render a campaign entirely unconstraining to our models, as in S190915ak), the timing of the observation with respect to peak flux is in fact the dominant variable. This is reflected in the mean values; while S190915ak clearly experienced very poor observing conditions, with , the other four events discussed have mean ranging between (S190421ar) and (S190425z). Despite this, their observing horizons vary greatly due to the differing proximity of the observations to the model peak. For our Bazin model based on AT2017gfo, observing as close to days after trigger as possible is therefore highly desirable. One major caveat to this is that KN evolution at early times ( a few hours) is largely unknown due to a lack of observations. Our model at these times is therefore not well constrained (see Section 3.2), and hence the poor recovery performance of events with only very early observations may be pessimistic. Additionally, AT2017gfo is only one (well studied) event. The indication from cosmological GRBs is that KNe show considerable diversity in their emission (Fong et al., 2017; Gompertz et al., 2018; Ascenzi et al., 2019; Rossi et al., 2020), meaning that the model employed here may be too optimistic/pessimistic in its peak magnitude, or evolve faster/slower than any given future event. AT2017gfo is fainter than all but one sGRB KN candidate, but in several cases non-detections that probe deeper than the AT2017gfo models imply that there is room for a fainter, undetected population (Gompertz et al., 2018; Pandey et al., 2019).
6.4 Future Prospects
In addition to the factors discussed in Section 6.3, improvements in the limiting magnitudes can be made with a simple increase in exposure time. There are two obvious ways that the horizons presented in this paper can be improved: stacking the existing exposures, and/or increasing the exposure time for future follow-up campaigns. The former method could potentially yield depth increases of magnitudes, since our stacking gains scale as where is the number of stacks and our mean duplication factor is . The second method to increase depth will happen naturally as GOTO approaches design specifications; adding more telescopes means that the footprint of an individual tile/pointing becomes larger, and hence the GW probability regions can be tiled faster. The result is more time for repeat visits and/or longer exposure times, as well as more recent reference tiles from a higher survey cadence. Additionally, as the GW detector network expands to design sensitivity, the localisation precision of GW triggers (in particular nearby BNS mergers) is expected to improve (Abbott et al., 2020a), meaning that it may no longer be necessary to tile many thousands of square degrees. The most recent estimates (Abbott et al., 2020a) for the fourth LIGO/Virgo run (O4), which begins in January 2022 and will include the Kamioka Gravitational-wave Detector (KAGRA) suggests that the BNS (BBH) localisation precision will improve from a median () square degree 90 per cent credible interval in O3 to a median () square degree 90 per cent credible interval during O4. These factors will improve the depth of the observations on average. In particular, the flexible design of GOTO enables it to point both mounts at a single tile to improve depth once the localisations have improved to the point where breadth is no longer an issue.
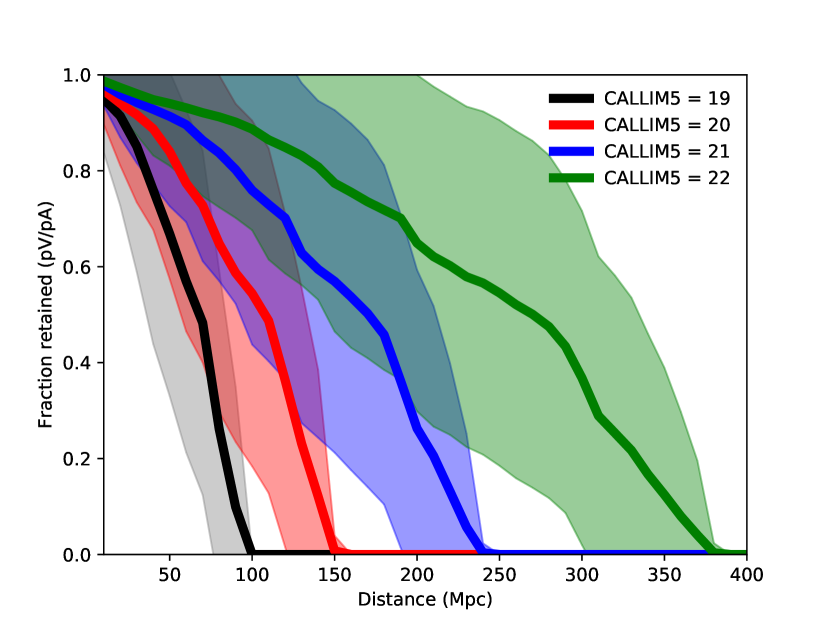
With regards to the sensitivity required, the expected BNS range during O4 (Abbott et al., 2020a) is 160 – 190 Mpc (aLIGO), 90 – 120 Mpc (AdV) and 25 – 130 Mpc (KAGRA). For comparison, Fig. 7 shows GOTO’s expected probability recovery fraction with distance in increments of . This incorporates the real observing conditions and follow-up schedule for each of the 29 events in O3a; it differs from Fig. 5 only in that is held constant for every tile. We find that attaining of magnitude 22 (Fig. 7, green line) will provide the range necessary for the predicted O4 BNS distribution for all but the most distant events. This is attainable for GOTO with an increase in exposure time or further image stacking (see e.g. Steeghs et al., in prep).
The mean response time of hours from the time that the LVC preliminary notice is received is impeded by notices that are received during the La Palma day. The forthcoming upgrade to add a southern node in Australia will further improve GOTO’s response time by increasing the window in which one of the facilities can respond (for overlapping latitudes), as well as greatly increasing the range of observable declinations.
7 Conclusions
We find that even in its 4-telescope prototype configuration, GOTO covered per cent of the available probability region on average when following up LVC superevents. The mean area covered was square degrees, but up to square degrees were covered in a single campaign. Over 500 square degrees were observed during 15 of the campaigns, including more than 1000 square degrees in 6 of them. In cases of well-timed events that fell in unconstrained tiles, GOTO-4 began observations less than a minute after receiving the LVC alert. On average, GOTO began observations hours after receiving an alert ( hours after the GW trigger). Despite no detections of GW-EM counterpart candidates in O3a, the telescope therefore comfortably fulfilled its role as a wide-field GW follow-up facility.
During the first half of O3, a typical GOTO observing campaign covered per cent of the LVC probability map, and could have unearthed an AT2017gfo-like KN up to 126 Mpc away. GOTO-4 achieves a maximum depth sufficient to recover our KN test source in one-in-five follow-up attempts for a distance drawn from the BNS distance distribution in O3a. However, we find that due to their distance, it is not possible to place model-constraining limits on EM emission from the distant (> 250 Mpc) population of BBH mergers detected by the LVC unless they house on-axis gamma-ray bursts; GOTO-4 was able to cover almost 10 per cent of the total probability volume on average for an on-axis GRB model, and rule one out on three occasions. We also note that future GOTO GW follow-up strategy would benefit from returning to a candidate field at – days post-trigger in order to better constrain the possibility of an off-axis GRB.
Based on our findings, the primary focus for GOTO should now be improving depth. The average duplication factor of visits per LVC probability pixel and the recent upgrade to 8 telescopes will help to achieve this goal. We find that reaching a limit of 22 magnitudes will provide KN coverage of almost the entire BNS volume probed by GW interferometers during O4 (though this ‘volume’ will be anisotropic, and many mergers will be detected at or near the horizon, where most of the volume is). This is expected to be comfortably within reach once GOTO attains its full 2 node, 32 telescope configuration. Efforts to improve depth will be aided by improved localisations from the expanding network of GW detectors, which will allow longer GOTO exposures and/or more repeated visits, and the option to point both mounts at a single target. The second GOTO node in Australia will also allow very rapid response in a greater fraction of cases, as well as enable follow-up of triggers whose fields lie predominantly at southern latitudes. The versatile design of GOTO means that it can evolve as the GW detectors do.
Acknowledgements
We thank the anonymous referee for helpful comments that improved the manuscript.
BPG, AJL and KW have received funding from the European Research Council (ERC) under the European Union’s Horizon 2020 research and innovation programme (grant agreement no 725246, TEDE, PI Levan).
DS, KU and JL acknowledge support from the STFC via grants ST/T007184/1, ST/T003103/1 and ST/P000495/1.
Armagh Observatory & Planetarium is core funded by the NI Government through the Dept. for Communities.
EP acknowledges funding from the Spanish Ministry of Economics and Competitiveness through project PGC2018-098153-B-C31.
RPB, MRK and DMS acknowledge support from the ERC under the European Union’s Horizon 2020 research and innovation programme (grant agreement No. 715051; Spiders).
RLCS, POB and RAJEF acknowledge funding from STFC.
The Gravitational-wave Optical Transient Observer (GOTO) project acknowledges the support of the Monash-Warwick Alliance; Warwick University; Monash University; Sheffield University; the University of Leicester; Armagh Observatory & Planetarium; the National Astronomical Research Institute of Thailand (NARIT); the University of Turku; Portsmouth University; and the Instituto de Astrofísica de Canarias (IAC).
Data Availability
Data products will be available as part of planned GOTO public data releases.
References
- Aasi et al. (2013) Aasi J., et al., 2013, Phys. Rev. D, 88, 062001
- Abadie et al. (2010) Abadie J., et al., 2010, Classical and Quantum Gravity, 27, 173001
- Abbott et al. (2016) Abbott B. P., et al., 2016, The Astrophysical journal letters, 826, L13
- Abbott et al. (2017a) Abbott B. P., et al., 2017a, Physical Review Letters, 119, 161101
- Abbott et al. (2017b) Abbott B. P., et al., 2017b, ApJ, 848, L12
- Abbott et al. (2019) Abbott B. P., et al., 2019, Phys. Rev. X, 9, 031040
- Abbott et al. (2020a) Abbott B. P., et al., 2020a, Living Reviews in Relativity, 21, 3
- Abbott et al. (2020b) Abbott B. P., et al., 2020b, ApJ, 892, L3
- Ackley et al. (2020) Ackley K., et al., 2020, arXiv e-prints, p. arXiv:2002.01950
- Anand et al. (2020) Anand S., et al., 2020, arXiv e-prints, p. arXiv:2003.05516
- Andreoni et al. (2017) Andreoni I., et al., 2017, Publ. Astron. Soc. Australia, 34, e069
- Andreoni et al. (2020) Andreoni I., et al., 2020, ApJ, 890, 131
- Antier et al. (2020a) Antier S., et al., 2020a, arXiv e-prints, p. arXiv:2004.04277
- Antier et al. (2020b) Antier S., et al., 2020b, MNRAS, 492, 3904
- Arcavi et al. (2017) Arcavi I., et al., 2017, Nature, 551, 64
- Ascenzi et al. (2019) Ascenzi S., et al., 2019, MNRAS, 486, 672
- Barbieri et al. (2019) Barbieri C., Salafia O. S., Perego A., Colpi M., Ghirlanda G., 2019, A&A, 625, A152
- Barnes & Kasen (2013) Barnes J., Kasen D., 2013, ApJ, 775, 18
- Bazin et al. (2011) Bazin G., et al., 2011, Astronomy & Astrophysics, 534, A43
- Becker (2015) Becker A., 2015, Astrophysics Source Code Library
- Belczynski et al. (2006) Belczynski K., Perna R., Bulik T., Kalogera V., Ivanova N., Lamb D. Q., 2006, The Astrophysical Journal, 648, 1110
- Bellm et al. (2019) Bellm E. C., et al., 2019, PASP, 131, 018002
- Berger et al. (2013) Berger E., Fong W., Chornock R., 2013, ApJ, 774, L23
- Blanchard et al. (2017) Blanchard P. K., et al., 2017, ApJ, 848, L22
- Blandford & McKee (1976) Blandford R. D., McKee C. F., 1976, Physics of Fluids, 19, 1130
- Blinnikov et al. (1984) Blinnikov S. I., Novikov I. D., Perevodchikova T. V., Polnarev A. G., 1984, Soviet Astronomy Letters, 10, 177
- Bloemen et al. (2016) Bloemen S., et al., 2016, in Hall H. J., Gilmozzi R., Marshall H. K., eds, Vol. 9906, Ground-based and Airborne Telescopes VI. SPIE, pp 2118 – 2126, doi:10.1117/12.2232522, https://doi.org/10.1117/12.2232522
- Bloom et al. (2012) Bloom J. S., et al., 2012, PASP, 124, 1175
- Boër (2001) Boër M., 2001, Astronomische Nachrichten, 322, 343
- Capaccioli & Schipani (2011) Capaccioli M., Schipani P., 2011, The Messenger, 146, 2
- Chang & Murray (2018) Chang P., Murray N., 2018, MNRAS, 474, L12
- Chornock et al. (2017) Chornock R., et al., 2017, ApJ, 848, L19
- Connaughton et al. (2016) Connaughton V., et al., 2016, The Astrophysical Journal Letters, 826, L6
- Coughlin et al. (2019) Coughlin M. W., et al., 2019, ApJ, 885, L19
- Coughlin et al. (2020) Coughlin M. W., et al., 2020, MNRAS, 492, 863
- Coulter et al. (2017) Coulter D. A., et al., 2017, Science, 358, 1556
- Covino et al. (2017) Covino S., et al., 2017, Nature Astronomy, 1, 791
- Cowperthwaite et al. (2017) Cowperthwaite P. S., et al., 2017, ApJ, 848, L17
- D’Avanzo et al. (2018) D’Avanzo P., et al., 2018, A&A, 613, L1
- Dálya et al. (2018) Dálya G., et al., 2018, Monthly Notices of the Royal Astronomical Society, 479, 2374
- Dark Energy Survey Collaboration et al. (2016) Dark Energy Survey Collaboration et al., 2016, MNRAS, 460, 1270
- De Mink & King (2017) De Mink S., King A., 2017, The Astrophysical Journal Letters, 839, L7
- Díaz et al. (2017) Díaz M. C., et al., 2017, ApJ, 848, L29
- Dobie et al. (2019) Dobie D., et al., 2019, ApJ, 887, L13
- Drout et al. (2017) Drout M. R., et al., 2017, Science, 358, 1570
- Dyer et al. (2018) Dyer M. J., Dhillon V. S., Littlefair S., Steeghs D., Ulaczyk K., Chote P., Galloway D., Rol E., 2018, in Proc. SPIE. p. 107040C (arXiv:1807.01614), doi:10.1117/12.2311865
- Eichler et al. (1989) Eichler D., Livio M., Piran T., Schramm D. N., 1989, Nature, 340, 126
- Evans et al. (2017) Evans P. A., et al., 2017, Science, 358, 1565
- Fong & Berger (2013) Fong W., Berger E., 2013, ApJ, 776, 18
- Fong et al. (2015) Fong W., Berger E., Margutti R., Zauderer B. A., 2015, ApJ, 815, 102
- Fong et al. (2017) Fong W., et al., 2017, ApJ, 848, L23
- Fong et al. (2019) Fong W., et al., 2019, ApJ, 883, L1
- Foucart et al. (2018) Foucart F., Hinderer T., Nissanke S., 2018, Phys. Rev. D, 98, 081501
- Foucart et al. (2019) Foucart F., Duez M. D., Kidder L. E., Nissanke S. M., Pfeiffer H. P., Scheel M. A., 2019, Phys. Rev. D, 99, 103025
- Freiburghaus et al. (1999) Freiburghaus C., Rosswog S., Thielemann F.-K., 1999, ApJ, 525, L121
- Goldstein et al. (2017) Goldstein A., et al., 2017, ApJ, 848, L14
- Goldstein et al. (2019) Goldstein D. A., et al., 2019, ApJ, 881, L7
- Gomez et al. (2019) Gomez S., et al., 2019, ApJ, 884, L55
- Gompertz et al. (2015) Gompertz B. P., van der Horst A., O’Brien P. T., Wynn G. A., Wiersema K., 2015, Monthly Notices of the Royal Astronomical Society, 448, 629
- Gompertz et al. (2018) Gompertz B., et al., 2018, The Astrophysical Journal, 860, 62
- Gompertz et al. (2020) Gompertz B. P., Levan A. J., Tanvir N. R., 2020, arXiv e-prints, p. arXiv:2001.08706
- Górski et al. (2005) Górski K. M., Hivon E., Banday A. J., Wand elt B. D., Hansen F. K., Reinecke M., Bartelmann M., 2005, ApJ, 622, 759
- Granot et al. (2018) Granot J., Gill R., Guetta D., De Colle F., 2018, MNRAS, 481, 1597
- Guillochon et al. (2017) Guillochon J., Parrent J., Kelley L. Z., Margutti R., 2017, ApJ, 835, 64
- Haggard et al. (2017) Haggard D., Nynka M., Ruan J. J., Kalogera V., Cenko S. B., Evans P., Kennea J. A., 2017, ApJ, 848, L25
- Hallinan et al. (2017) Hallinan G., et al., 2017, Science, 358, 1579
- Henden et al. (2016) Henden A., Templeton M., Terrell D., Smith T., Levine S., Welch D., 2016, VizieR Online Data Catalog, 2336
- Hjorth et al. (2017) Hjorth J., et al., 2017, ApJ, 848, L31
- Hosseinzadeh et al. (2019) Hosseinzadeh G., et al., 2019, ApJ, 880, L4
- Janiuk et al. (2017) Janiuk A., Bejger M., Charzyński S., Sukova P., 2017, New Astronomy, 51, 7
- Jin et al. (2016) Jin Z.-P., et al., 2016, Nature Communications, 7, 12898
- Jin et al. (2018) Jin Z.-P., et al., 2018, ApJ, 857, 128
- Jin et al. (2020) Jin Z.-P., Covino S., Liao N.-H., Li X., D’Avanzo P., Fan Y.-Z., Wei D.-M., 2020, Nature Astronomy, 4, 77
- Kaiser et al. (2010) Kaiser N., et al., 2010, in Proc. SPIE. p. 77330E, doi:10.1117/12.859188
- Kasliwal et al. (2017) Kasliwal M. M., Korobkin O., Lau R. M., Wollaeger R., Fryer C. L., 2017, ApJ, 843, L34
- Kawaguchi et al. (2015) Kawaguchi K., Kyutoku K., Nakano H., Okawa H., Shibata M., Taniguchi K., 2015, Phys. Rev. D, 92, 024014
- Kawaguchi et al. (2016) Kawaguchi K., Kyutoku K., Shibata M., Tanaka M., 2016, ApJ, 825, 52
- Kawaguchi et al. (2020) Kawaguchi K., Shibata M., Tanaka M., 2020, ApJ, 889, 171
- Kim et al. (2016) Kim S.-L., et al., 2016, Journal of Korean Astronomical Society, 49, 37
- Kim et al. (2017) Kim S., et al., 2017, ApJ, 850, L21
- Kool et al. (2019) Kool E., et al., 2019, GCN, 25616, 1
- Kouveliotou et al. (1993) Kouveliotou C., Meegan C. A., Fishman G. J., Bhat N. P., Briggs M. S., Koshut T. M., Paciesas W. S., Pendleton G. N., 1993, ApJ, 413, L101
- Kyutoku et al. (2015) Kyutoku K., Ioka K., Okawa H., Shibata M., Taniguchi K., 2015, Phys. Rev. D, 92, 044028
- LIGO Scientific Collaboration & Virgo Collaboration (2019) LIGO Scientific Collaboration Virgo Collaboration 2019, GRB Coordinates Network, 25333, 1
- Lamb & Kobayashi (2018) Lamb G. P., Kobayashi S., 2018, MNRAS, 478, 733
- Lamb et al. (2019a) Lamb G. P., et al., 2019a, ApJ, 870, L15
- Lamb et al. (2019b) Lamb G. P., et al., 2019b, ApJ, 883, 48
- Lang et al. (2010) Lang D., Hogg D. W., Mierle K., Blanton M., Roweis S., 2010, The astronomical journal, 139, 1782
- Lattimer & Schramm (1974) Lattimer J. M., Schramm D. N., 1974, ApJ, 192, L145
- Lazzati et al. (2017) Lazzati D., Perna R., Morsony B. J., López-Cámara D., Cantiello M., Ciolfi R., giacomazzo B., Workman J. C., 2017, preprint, (arXiv:1712.03237)
- Levan et al. (2017) Levan A. J., et al., 2017, ApJ, 848, L28
- Li & Paczyński (1998) Li L.-X., Paczyński B., 1998, ApJ, 507, L59
- Ligo Collaboration & VIRGO Collaboration (2019a) Ligo Collaboration VIRGO Collaboration 2019a, GRB Coordinates Network, 25606, 1
- Ligo Collaboration & VIRGO Collaboration (2019b) Ligo Collaboration VIRGO Collaboration 2019b, GRB Coordinates Network, 25753, 1
- Ligo Collaboration & VIRGO Collaboration (2019c) Ligo Collaboration VIRGO Collaboration 2019c, GRB Coordinates Network, 25829, 1
- Ligo Collaboration & VIRGO Collaboration (2019d) Ligo Collaboration VIRGO Collaboration 2019d, GRB Coordinates Network, 25871, 1
- Ligo Scientific Collaboration & VIRGO Collaboration (2019a) Ligo Scientific Collaboration VIRGO Collaboration 2019a, GRB Coordinates Network, 24069, 1
- Ligo Scientific Collaboration & VIRGO Collaboration (2019b) Ligo Scientific Collaboration VIRGO Collaboration 2019b, GRB Coordinates Network, 24098, 1
- Ligo Scientific Collaboration & VIRGO Collaboration (2019c) Ligo Scientific Collaboration VIRGO Collaboration 2019c, GRB Coordinates Network, 24141, 1
- Ligo Scientific Collaboration & VIRGO Collaboration (2019d) Ligo Scientific Collaboration VIRGO Collaboration 2019d, GRB Coordinates Network, 24168, 1
- Ligo Scientific Collaboration & VIRGO Collaboration (2019e) Ligo Scientific Collaboration VIRGO Collaboration 2019e, GRB Coordinates Network, 24237, 1
- Ligo Scientific Collaboration & VIRGO Collaboration (2019f) Ligo Scientific Collaboration VIRGO Collaboration 2019f, GRB Coordinates Network, 24411, 1
- Ligo Scientific Collaboration & VIRGO Collaboration (2019g) Ligo Scientific Collaboration VIRGO Collaboration 2019g, GRB Coordinates Network, 24442, 1
- Ligo Scientific Collaboration & VIRGO Collaboration (2019h) Ligo Scientific Collaboration VIRGO Collaboration 2019h, GRB Coordinates Network, 24503, 1
- Ligo Scientific Collaboration & VIRGO Collaboration (2019i) Ligo Scientific Collaboration VIRGO Collaboration 2019i, GRB Coordinates Network, 24522, 1
- Ligo Scientific Collaboration & VIRGO Collaboration (2019j) Ligo Scientific Collaboration VIRGO Collaboration 2019j, GRB Coordinates Network, 24570, 1
- Ligo Scientific Collaboration & VIRGO Collaboration (2019k) Ligo Scientific Collaboration VIRGO Collaboration 2019k, GRB Coordinates Network, 24598, 1
- Ligo Scientific Collaboration & VIRGO Collaboration (2019l) Ligo Scientific Collaboration VIRGO Collaboration 2019l, GRB Coordinates Network, 24621, 1
- Ligo Scientific Collaboration & VIRGO Collaboration (2019m) Ligo Scientific Collaboration VIRGO Collaboration 2019m, GRB Coordinates Network, 24632, 1
- Ligo Scientific Collaboration & VIRGO Collaboration (2019n) Ligo Scientific Collaboration VIRGO Collaboration 2019n, GRB Coordinates Network, 24922, 1
- Ligo Scientific Collaboration & VIRGO Collaboration (2019o) Ligo Scientific Collaboration VIRGO Collaboration 2019o, GRB Coordinates Network, 24998, 1
- Ligo Scientific Collaboration & VIRGO Collaboration (2019p) Ligo Scientific Collaboration VIRGO Collaboration 2019p, GRB Coordinates Network, 25012, 1
- Ligo Scientific Collaboration & VIRGO Collaboration (2019q) Ligo Scientific Collaboration VIRGO Collaboration 2019q, GRB Coordinates Network, 25087, 1
- Ligo Scientific Collaboration & VIRGO Collaboration (2019r) Ligo Scientific Collaboration VIRGO Collaboration 2019r, GRB Coordinates Network, 25115, 1
- Ligo Scientific Collaboration & VIRGO Collaboration (2019s) Ligo Scientific Collaboration VIRGO Collaboration 2019s, GRB Coordinates Network, 25164, 1
- Ligo Scientific Collaboration & VIRGO Collaboration (2019t) Ligo Scientific Collaboration VIRGO Collaboration 2019t, GRB Coordinates Network, 25187, 1
- Ligo Scientific Collaboration & VIRGO Collaboration (2019u) Ligo Scientific Collaboration VIRGO Collaboration 2019u, GRB Coordinates Network, 25324, 1
- Ligo Scientific Collaboration & VIRGO Collaboration (2019v) Ligo Scientific Collaboration VIRGO Collaboration 2019v, GRB Coordinates Network, 25497, 1
- Ligo Scientific Collaboration & VIRGO Collaboration (2019w) Ligo Scientific Collaboration VIRGO Collaboration 2019w, GRB Coordinates Network, 25503, 1
- Ligo Scientific Collaboration & VIRGO Collaboration (2019x) Ligo Scientific Collaboration VIRGO Collaboration 2019x, GRB Coordinates Network, 25695, 1
- Ligo Scientific Collaboration & VIRGO Collaboration (2019y) Ligo Scientific Collaboration VIRGO Collaboration 2019y, GRB Coordinates Network, 25814, 1
- Ligo Scientific Collaboration & VIRGO Collaboration (2019z) Ligo Scientific Collaboration VIRGO Collaboration 2019z, GRB Coordinates Network, 25876, 1
- Lipunov et al. (2010) Lipunov V., et al., 2010, Advances in Astronomy, 2010, 349171
- Lipunov et al. (2017) Lipunov V. M., et al., 2017, ApJ, 850, L1
- Loeb (2016) Loeb A., 2016, The Astrophysical Journal Letters, 819, L21
- Lundquist et al. (2019) Lundquist M. J., et al., 2019, ApJ, 881, L26
- Lyman et al. (2018) Lyman J. D., et al., 2018, Nature Astronomy,
- Mandel (2018) Mandel I., 2018, ApJ, 853, L12
- Margutti et al. (2017) Margutti R., et al., 2017, ApJ, 848, L20
- Margutti et al. (2018) Margutti R., et al., 2018, ApJ, 856, L18
- McKernan et al. (2019) McKernan B., et al., 2019, ApJ, 884, L50
- Metzger (2017) Metzger B. D., 2017, Living Reviews in Relativity, 20, 3
- Metzger et al. (2010) Metzger B., et al., 2010, Monthly Notices of the Royal Astronomical Society, 406, 2650
- Moesta et al. (2012) Moesta P., Alic D., Rezzolla L., Zanotti O., Palenzuela C., 2012, The Astrophysical Journal Letters, 749, L32
- Mooley et al. (2018) Mooley K. P., et al., 2018, ApJ, 868, L11
- Murase et al. (2016) Murase K., Kashiyama K., Mészáros P., Shoemaker I., Senno N., 2016, The Astrophysical Journal Letters, 822, L9
- Narayan et al. (1992) Narayan R., Paczynski B., Piran T., 1992, ApJ, 395, L83
- Nicholl et al. (2017) Nicholl M., et al., 2017, ApJ, 848, L18
- Paczynski (1986) Paczynski B., 1986, The Astrophysical Journal, 308, L43
- Palenzuela et al. (2010) Palenzuela C., Lehner L., Yoshida S., 2010, Physical Review D, 81, 084007
- Pandey et al. (2019) Pandey S. B., et al., 2019, MNRAS, 485, 5294
- Perley et al. (2019) Perley D., Ho A., Copperwheat C., Collaboration G., et al., 2019, GCN, 25643, 1
- Perna et al. (2016) Perna R., Lazzati D., Giacomazzo B., 2016, The Astrophysical Journal Letters, 821, L18
- Pian et al. (2017) Pian E., et al., 2017, Nature, 551, 67
- Planck Collaboration et al. (2018) Planck Collaboration et al., 2018, arXiv e-prints, p. arXiv:1807.06209
- Pozanenko et al. (2018) Pozanenko A. S., et al., 2018, ApJ, 852, L30
- Rossi et al. (2020) Rossi A., et al., 2020, MNRAS, 493, 3379
- Rosswog (2005) Rosswog S., 2005, ApJ, 634, 1202
- Rosswog et al. (2003) Rosswog S., Ramirez-Ruiz E., Davies M. B., 2003, MNRAS, 345, 1077
- Sagués Carracedo et al. (2020) Sagués Carracedo A., Bulla M., Feindt U., Goobar A., 2020, arXiv e-prints, p. arXiv:2004.06137
- Sari et al. (1998) Sari R., Piran T., Narayan R., 1998, ApJ, 497, L17
- Savchenko et al. (2017) Savchenko V., et al., 2017, ApJ, 848, L15
- Schlafly & Finkbeiner (2011) Schlafly E. F., Finkbeiner D. P., 2011, ApJ, 737, 103
- Schlafly et al. (2010) Schlafly E. F., Finkbeiner D. P., Schlegel D. J., Jurić M., Ivezić Ž., Gibson R. R., Knapp G. R., Weaver B. A., 2010, ApJ, 725, 1175
- Schlegel et al. (1998) Schlegel D. J., Finkbeiner D. P., Davis M., 1998, ApJ, 500, 525
- Shappee et al. (2014) Shappee B., et al., 2014, in American Astronomical Society Meeting Abstracts #223. p. 236.03
- Shappee et al. (2017) Shappee B. J., et al., 2017, Science, 358, 1574
- Shibata & Taniguchi (2011) Shibata M., Taniguchi K., 2011, Living Reviews in Relativity, 14, 6
- Singer (2015) Singer L. P., 2015, PhD thesis, California Institute of Technology
- Singer et al. (2014) Singer L. P., et al., 2014, ApJ, 795, 105
- Singer et al. (2016) Singer L. P., et al., 2016, ApJS, 226, 10
- Smartt et al. (2017) Smartt S. J., et al., 2017, Nature, 551, 75
- Soares-Santos et al. (2017) Soares-Santos M., et al., 2017, ApJ, 848, L16
- Sutherland et al. (2015) Sutherland W., et al., 2015, A&A, 575, A25
- Tanaka et al. (2018) Tanaka M., et al., 2018, ApJ, 852, 109
- Tanvir et al. (2013) Tanvir N. R., Levan A. J., Fruchter A. S., Hjorth J., Hounsell R. A., Wiersema K., Tunnicliffe R. L., 2013, Nature, 500, 547
- Tanvir et al. (2017) Tanvir N. R., et al., 2017, ApJ, 848, L27
- The LIGO Scientific Collaboration et al. (2020) The LIGO Scientific Collaboration et al., 2020, arXiv e-prints, p. arXiv:2001.01761
- Tonry et al. (2018) Tonry J. L., et al., 2018, PASP, 130, 064505
- Troja et al. (2008) Troja E., King A. R., O’Brien P. T., Lyons N., Cusumano G., 2008, MNRAS, 385, L10
- Troja et al. (2017) Troja E., et al., 2017, Nature, 551, 71
- Troja et al. (2018a) Troja E., et al., 2018a, Nature Communications, 9, 4089
- Troja et al. (2018b) Troja E., et al., 2018b, MNRAS, 478, L18
- Troja et al. (2019) Troja E., et al., 2019, arXiv e-prints, p. arXiv:1905.01290
- Valenti et al. (2017) Valenti S., et al., 2017, ApJ, 848, L24
- Veitch et al. (2015) Veitch J., et al., 2015, Physical Review D, 91, 042003
- Vieira et al. (2020) Vieira N., et al., 2020, arXiv e-prints, p. arXiv:2003.09437
- Villar et al. (2017) Villar V. A., et al., 2017, ApJ, 851, L21
- Watson et al. (2016) Watson A. M., et al., 2016, in Proc. SPIE. p. 99100G (arXiv:1606.00695), doi:10.1117/12.2232898
- Watson et al. (2020) Watson A. M., et al., 2020, MNRAS, 492, 5916
- Wells et al. (1981) Wells D. C., Greisen E. W., Harten R. H., 1981, A&AS, 44, 363
- Wu & MacFadyen (2019) Wu Y., MacFadyen A., 2019, ApJ, 880, L23
- Yang et al. (2015) Yang B., et al., 2015, Nature Communications, 6, 7323
- Zhu et al. (2020) Zhu J.-P., Yang Y.-P., Liu L.-D., Huang Y., Zhang B., Li Z., Yu Y.-W., Gao H., 2020, arXiv e-prints, p. arXiv:2003.06733