Absolute dimensions of the unevolved F-type eclipsing binary BT Vulpeculae
Abstract
We report extensive differential -band photometry and high-resolution spectroscopy for the 1.14 day, detached, double-lined eclipsing binary BT Vul (F0+F7). Our radial-velocity monitoring and light curve analysis lead to absolute masses and radii of and for the primary, and and for the secondary. The effective temperatures are K and K, respectively. Both stars are rapid rotators, and the orbit is circular. A comparison with stellar evolution models from the MIST series shows excellent agreement with these determinations, for a composition of and an age of 350 Myr. The two components of BT Vul are very near the zero-age main sequence.
1. Introduction
The discovery of the photometric variability of BT Vul (HD 340072, TYC 2164-161-1, Gaia DR2 1836032243422750464; , SpT F0+F7) was made by S. Beljawsky (see Guthnick & Schneller, 1939), although the original period given (3.988 days) was incorrect. Other than measurements of the times of eclipse since its discovery, no detailed studies of this short-period system ( days) have appeared in the literature. In this paper we report the first systematic photometric and spectroscopic monitoring of the binary, leading to a full determination of its physical properties.
Section 2 presents our observations, beginning in Section 2.1 with a determination of a highly precise ephemeris based on more than six decades of timing observations. Section 2.2 then reports our spectroscopic observations of BT Vul, with the derivation of the radial velocities and spectroscopic orbital elements. Our extensive photometric -band measurements are described in Section 2.3. The analysis of the lightcurves is found in Section 3, and is followed in Section 4 by a determination of the absolute dimensions of the system, and in Section 5 with a comparison of the physical properties with current models of stellar evolution. Final remarks appear in Section 6.
2. Observations
2.1. Eclipse timings
Times of minimum light have been gathered for BT Vul since 1953 using photographic, visual, and photoelectric/CCD techniques. The available measurements are collected in Table 1, which contains 115 timings for the primary minimum and 40 for the secondary over more than 65 years. Many of them are based on the differential photometric observations we describe in this paper.
A linear ephemeris was derived by weighted least squares, in which the published uncertainties, when available, were scaled in order to achieve reduced values near unity for each type of eclipse and each type of observation. For measurements with no reported uncertainties we adopted suitable values to the same end (see Table 1). The linear ephemeris obtained is:
with the uncertainties indicated in parentheses. Independent periods determined from the primary and secondary minima do not differ significantly. A solution allowing for separate reference times of primary and secondary minima resulted in a phase difference of , suggesting negligible eccentricity. For the rest of this work we have therefore assumed the orbit to be circular.
| HJD | ||||||
|---|---|---|---|---|---|---|
| (2,400,000+) | Year | Epoch | (days) | (days) | Ecl | Type |
| 34740.28 | 1953.9912 | 16421.0 | 0.0063 | +0.004269 | 1 | PG |
| 35402.18 | 1955.8034 | 15841.0 | 0.0063 | +0.007879 | 1 | PG |
| 43351.786 | 1977.5682 | 8875.0 | 0.0100 | +0.009984 | 1 | V |
| 43779.735 | 1978.7399 | 8500.0 | 0.0100 | +0.008731 | 1 | V |
| 44022.812 | 1979.4054 | 8287.0 | 0.0100 | +0.009988 | 1 | V |
Note. — ‘Ecl’ is 1 for the primary and 2 for the secondary minimum; ‘Type’ is PG, V, and PE for the photographic, visual, and photoelectric/CCD techniques. The ‘Epoch’ is counted from the reference time of primary minimum in this section. For measurements with published uncertainties the errors reported here have been multiplied by scale factors of 3.35 and 2.75 for the photoelectric timings of the primary and secondary minima (see text), and scale factors of 4.35 and 1.28 for the visual observations. Measurements with no published errors have been assigned values of 0.0063 days, 0.010 days, and 0.0058 days for the photographic, visual, and photoelectric techniques, respectively. Sources for the individual measurements are listed at http://var2.astro.cz/EN/brno/eclipsing_binaries.php and https://www.bav-astro.eu/index.php/veroeffentlichungen/service-for-scientists/lkdb-engl. (This table is available in its entirety in machine-readable form.)
2.2. Spectroscopy
Spectroscopic monitoring of BT Vul was carried out at two facilities. Observations at the Center for Astrophysics (CfA) began in June of 2010 and continued until October of 2015. They were made with the Tillinghast Reflector Echelle Spectrograph (TRES; Szentgyorgyi & Fűrész, 2007; Fűrész, 2008), a fiber-fed, bench-mounted instrument attached to the 1.5m Tillinghast reflector at the Fred L. Whipple Observatory on Mount Hopkins (Arizona, USA). A total of 39 spectra were gathered at a resolving power of , and cover the wavelength region 3800–9100 Å in 51 orders. For the order centered at 5187 Å, which contains the Mg I b triplet, the signal-to-noise ratios range from 24 to 65 per resolution element of 6.8 km s-1. The wavelength reference was provided by exposures of a thorium-argon lamp before and after each science frame, and the reductions were carried out with a dedicated pipeline.
| HJD | Orbital | ||||
|---|---|---|---|---|---|
| (2,400,000+) | (km s-1) | (km s-1) | (km s-1) | (km s-1) | Phase |
| 55368.9509 | 139.96 | 136.65 | 4.56 | 4.60 | 0.29074 |
| 55527.5607 | 142.87 | 135.21 | 3.54 | 3.57 | 0.27576 |
| 55850.5866 | 129.49 | 121.77 | 2.50 | 2.52 | 0.33369 |
| 55903.5554 | 103.22 | 177.41 | 3.99 | 4.02 | 0.74866 |
| 56024.0077 | 143.75 | 133.62 | 1.86 | 1.87 | 0.29741 |
Note. — Orbital phases are counted from the reference time of primary eclipse. (This table is available in its entirety in machine-readable form.)
For the radial velocity measurements we used the two-dimensional cross-correlation algorithm TODCOR (Zucker & Mazeh, 1994), with separate templates for the primary and secondary selected from a large library of pre-computed synthetic spectra based on model atmospheres by R. L. Kurucz, and a line list tuned to better match the spectra of real stars (see Nordström et al., 1994; Latham et al., 2002). The synthetic spectra cover a limited wavelength region of about 300 Å centered around 5187 Å, and the velocity measurements were made using the central 100 Å, which contains most of the information on the velocities. The main template parameters (effective temperature, , and rotational broadening, ) were determined by running extensive grids of cross-correlations as described by Torres et al. (2002), with adopted surface gravities of and 4.5 for the primary and secondary, which are the closest in our grid to the final values derived later. Solar metallicity was assumed for these measurements. For the primary we obtained K and . Estimated uncertainties are 100 K and 3 km s-1, respectively, based on the scatter from the individual spectra conservatively increased to account for possible systematic errors. For the secondary we obtained . However, the significant rotational broadening of both stars together with the faintness of the secondary (see below) conspire to make it difficult to establish a reliable temperature for that star. For this we therefore made use of results from the light curve analysis described later. Specifically, we used the surface brightness ratio, which provides a good measure of the relative temperature. As described in more detail in Section 4, this then leads to a secondary temperature of 6260 K. The primary/secondary template parameters in our grid closest to the above values are 7000 / 6250 K for the temperatures, and 70 / 55 km s-1 for the rotational broadening.
Previous experience at CfA has shown that the raw radial velocities can sometimes be affected by systematic errors that may arise due to lines shifting in and out of the spectral window as a function of orbital phase, or due to the barycentric velocity of the Earth (see Latham et al., 1996; Torres et al., 1997). Following these authors we applied corrections for this effect based on simulations, the details of which may be found in those papers. In the case of the primary the adjustments are very small (), but they can reach 2 km s-1 for the secondary. The resulting radial velocities in the heliocentric frame, including corrections, are listed in Table 2 along with their uncertainties. The flux ratio we measure using TODCOR is , at the mean wavelength of our observations (5187 Å).
Further spectroscopic observations of BT Vul were obtained from 2011 November through 2018 September at Fairborn Observatory, which is situated in southeast Arizona near Washington Camp. The observations were acquired with the Tennessee State University 2m Astronomical Spectroscopic Telescope (AST) and a fiber-fed echelle spectrograph (Eaton & Williamson, 2007). The detector was a Fairchild 486 CCD consisting of a 4K 4K array of 15 pixels. This spectrograph and CCD combination resulted in 48 orders covering a wavelength range of 3800–8260 Å (Fekel et al., 2013). The faintness of the star required our largest diameter fiber that produced a spectral resolution of 0.4 Å. As a result, our 52 AST spectra have a resolving power of 15,000 at 6000 Å, and an average signal-to-noise ratio of 35.
| HJD | Orbital | ||
|---|---|---|---|
| (2,400,000+) | (km s-1) | (km s-1) | Phase |
| 55867.7441 | 115.7 | 97.0 | 0.36829 |
| 56010.9947 | 53.1 | 122.1 | 0.89451 |
| 56023.9539 | 151.9 | 136.7 | 0.25027 |
| 56058.9383 | 53.5 | 107.2 | 0.90605 |
| 56060.8952 | 67.2 | 129.2 | 0.62082 |
Note. — Typical uncertainties for the velocities are 3.0 km s-1 for the primary and 3.4 km s-1 for the secondary. Orbital phases are counted from the reference time of primary eclipse. (This table is available in its entirety in machine-readable form.)
A general description of the reduction of the AST spectra was provided by Fekel et al. (2009). In particular, for BT Vul a solar line list of 168 mostly neutral Fe lines was used in the wavelength region 4920–7100 Å. The individual lines were fitted with a rotational broadening function (Sandberg Lacy & Fekel, 2011). A value of 0.6 km s-1, determined from our unpublished measurements of IAU velocity standards, has been added to the AST velocities to bring them into accord with the results of Scarfe (2010). The corrected AST velocities are listed in Table 3, and have typical uncertainties of 3.0 km s-1 for the primary and 3.4 km s-1 for the secondary.
Rotational broadening fits in the 23 best AST spectra resulted in values of and for the primary and secondary stars, respectively. Similarly, the average secondary-to-primary equivalent width ratio was determined to be . To convert this value to a true flux ratio, we applied a correction for the difference in line blocking determined by measuring equivalent widths for some 150 lines in a synthetic spectrum for the primary star and another for the secondary. These synthetic spectra were were calculated with the SPECTRUM code (Gray & Corbally, 1994)111http://www.appstate.edu/~grayro/spectrum/spectrum.html, and were both normalized to a continuum of unity. With the resulting correction factor of , the final spectroscopic flux ratio for BT Vul at 6000 Å is .
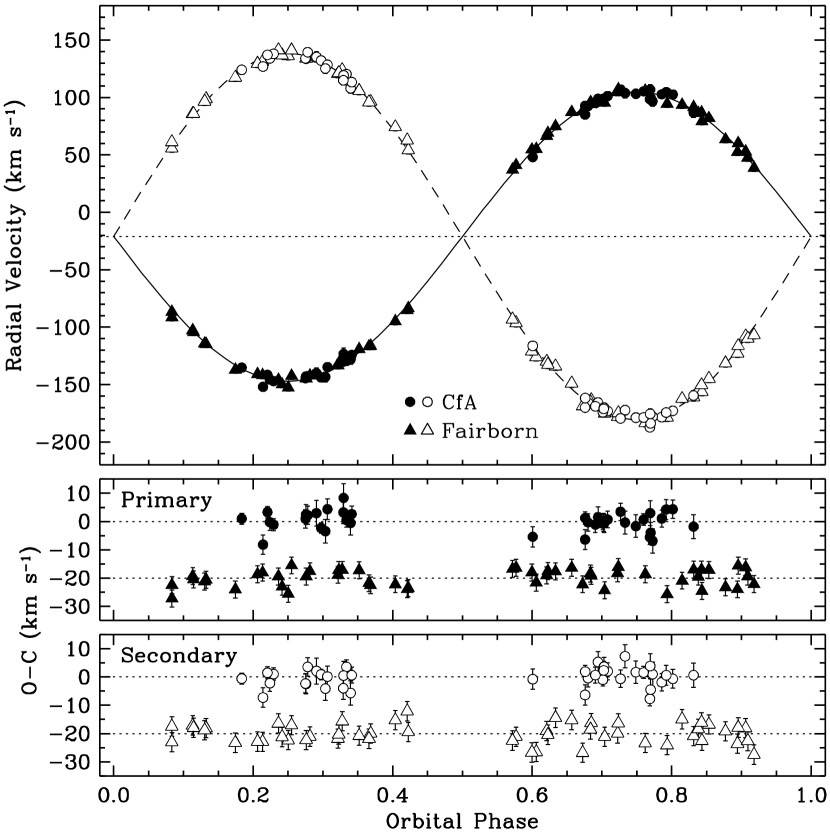
Independent spectroscopic orbital solutions using the CfA and Fairborn measurements give the results presented in Table 4, in which the period has been held fixed at the value from Section 2.1. Slight differences are seen in the velocity semiamplitudes of both stars, with the CfA values being smaller, although the values are consistent within 1.3 times their combined uncertainties. The CfA solution indicates a small systematic offset between the primary and secondary velocities (, in the sense primary minus secondary), which can sometimes occur because of a mismatch between the adopted cross-correlation templates for TODCOR and the spectra of the real stars. Experiments with a range of different templates did not reduce the effect. In this case, however, the shift is not large enough to affect the semiamplitudes significantly. The Fairborn velocities show no such offset. For the final solution we used the two data sets together, solving also for a systematic zero-point difference between Fairborn and CfA. The results are listed in the last column of the table, and the observations along with the model may be seen in Figure 1. A joint solution allowing for eccentricity resulted in a value consistent with zero (), supporting our assumption of a circular orbit.
| Parameter | CfA | Fairborn | Combined |
|---|---|---|---|
| (km s-1) | 125.46 (52) | 126.45 (52) | 125.92 (37) |
| (km s-1) | 159.32 (52) | 159.60 (61) | 159.42 (39) |
| (km s-1) | (50) | (42) | (48) |
| Min I () | 53479.9332 (14) | 53479.93152 (67) | 53479.931995 (66) |
| CfA prim/sec (km s-1) | (74) | (68) | |
| Fairborn prim/sec (km s-1) | (64) | (64) | |
| CfA Fairborn (km s-1) | (64) | ||
| Derived quantities | |||
| 0.7875 (41) | 0.7923 (45) | 0.7899 (30) | |
| () | 1.528 (12) | 1.544 (14) | 1.5348 (90) |
| () | 1.203 (10) | 1.223 (11) | 1.2124 (74) |
| () | 6.424 (17) | 6.453 (18) | 6.437 (12) |
| Other quantities pertaining to the fits | |||
| (km s-1) | 3.14 | 3.00 | 3.00 , 3.02 |
| (km s-1) | 3.16 | 3.52 | 3.02 , 3.45 |
| 39 | 52 | 39 + 52 | |
| Time span (days) | 1929 | 2509 | 3008 |
Note. — The orbital period has been held fixed according to the ephemeris of Section 2.1. Uncertainties are indicated in parentheses in units of the last significant place.
2.3. Photometry
Two web-based telescopes were used to gather differential photometric observations of BT Vul: the URSA WebScope (see Torres et al., 2009) and the NFO WebScope (see Grauer et al., 2008). The measurement apertures were pixels square (30 arcsec square) for the URSA images, and pixels square (22 arcsec square) for the NFO images. We measured a total of 5451 URSA images and 6018 NFO images, all taken through a Bessel filter. BT Vul (‘var’) and three comparison stars (TYC 2164-0403-1, TYC 2164-0974-1, and TYC 2164-0904-1) were measured in each image. The three comparison stars appeared to be constant in brightness at the level of 0.010 mag for the URSA images and 0.007 mag for the NFO images, so the measurement that was used in this analysis was ‘varcomps’, where ‘comps’ is the sum of the brightness of all three comparison stars. A total of 102 nights of data were gathered for URSA, and 197 nights for NFO. The measurements are listed in Tables 5 and 6.
BT Vul.
| HJD | |
|---|---|
| (2,400,000+) | (mag) |
| 52831.67233 | 1.656 |
| 52831.67423 | 1.682 |
| 52831.67611 | 1.687 |
| 52831.67799 | 1.716 |
| 52831.67988 | 1.750 |
Note. — (This table is available in its entirety in machine-readable form.)
BT Vul.
| HJD | |
|---|---|
| (2,400,000+) | (mag) |
| 53479.88217 | 1.712 |
| 53479.88499 | 1.753 |
| 53479.88777 | 1.783 |
| 53479.89060 | 1.800 |
| 53479.89337 | 1.834 |
Note. — (This table is available in its entirety in machine-readable form.)
As we have noted in the past (see, e.g., Lacy et al., 2008; Torres et al., 2014), these telescopes suffer from systematic shifts of a few hundredths of a magnitude in the photometric zero point from night to night, which remain after the reductions. While the effect is noticeable for the NFO WebScope, it is much less so for URSA. This adds scatter to the light curves that is addressed below.
3. Light curve analysis
For the solution of the light curves we used the eb code of Irwin et al. (2011), based on the Nelson-Davis-Etzel binary model (Etzel, 1981; Popper & Etzel, 1981). This model approximates the star shapes as biaxial spheroids for calculating proximity effects, and is adequate for well-detached systems in which the stars are nearly spherical, as is the case here (see below). We solved for the orbital period () and reference epoch of primary eclipse (), the sum of the relative radii normalized by the semimajor axis (), the radius ratio (), the central surface brightness ratio (), the cosine of the inclination angle (), and the magnitude level at first quadrature (). For the limb darkening prescription we adopted the linear law, with a coefficient for each star. Experiments with a quadratic law gave no improvement. The gravity darkening coefficients were adopted from Claret & Bloemen (2011), and are and for the primary and secondary, interpolated to our final temperatures, surface gravities, and metallicity reported below. The bolometric reflection albedos (, ) were set to 0.5, and the mass ratio was fixed to our spectroscopic value, .
A cone search of the Gaia/DR2 catalog (Gaia Collaboration et al., 2018) around the position of BT Vul revealed about a dozen nearby stars within the photometric apertures used for URSA and NFO, but none are bright enough to contaminate the photometry in a significant way. Nevertheless, as a precaution we included third light () as an additional parameter in our fits. We did this both to account for the possible presence of closer companions than Gaia can resolve, and also because of the likelihood of a third, physical component in the BT Vul system, given that the vast majority of short-period binaries appear to have them (see Tokovinin et al., 2006). Third light is defined here such that , and the values for the primary and secondary for this normalization correspond to the light at first quadrature.
Our fits were carried out within a Markov chain Monte Carlo framework using the emcee code of Foreman-Mackey et al. (2013).222https://github.com/dfm/emcee We used 100 walkers with chain lengths of 10,000 each, discarding 5,000 links as burnin (for a total remaining samples). Priors were uniform for most parameters, with suitable broad ranges in each case. Convergence was checked both by visual examination of the chains and by requiring a Gelman-Rubin statistic of 1.05 or smaller for all parameters (Gelman & Rubin, 1992). As a final adjustable parameter we included a multiplicative scale factor for the photometric errors, which we solved for self-consistently and simultaneously with the other orbital quantities (see Gregory, 2005). We allowed to be different for URSA and NFO, as the latter photometry shows more scatter. The prior for was assumed to be log-uniform. The initial error assumed for the photometric measurements was 0.017 mag, estimated from the out-of-eclipse scatter in the URSA light curve. Formal 68.3% confidence intervals for all parameters were derived directly from the posterior distributions.
We performed independent analyses using the URSA and NFO photometry, the results of which are presented in Table 7. Preliminary solutions produced limb-darkening coefficients near unity for the primary and near zero for the secondary, which are very different from their theoretically predicted values and seem unrealistic. We suspect this may be caused by the systematic offsets in the photometry from night to night mentioned in Section 2.3, which represent non-Gaussian errors that can overwhelm the rather subtle effect limb darkening has on the shape of the light curves. For the remainder of the analysis we therefore chose to hold the limb-darkening coefficients fixed following the tabulation of Claret & Bloemen (2011), at values of and .
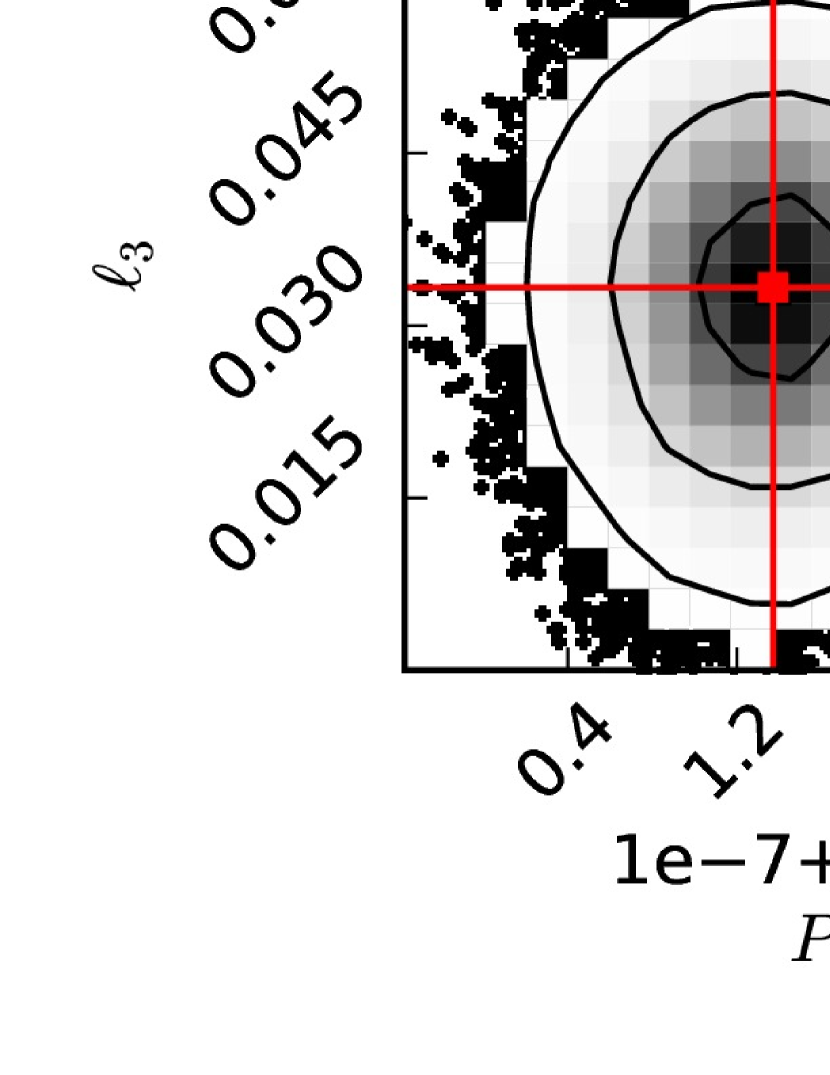
There is good agreement between the URSA and NFO results in Table 7. The third-light parameter is seen to be consistent with zero in both cases. Our final solution combines the URSA and NFO photometry, and is presented in the last column of Table 7. While most parameters are largely uncorrelated, a few show stronger degeneracies (, , , , , and ), with correlation coefficients among some of them being in the range of about 0.7–0.9, in absolute value. A graphical illustration of the correlations among those parameters is shown in Figure 4.
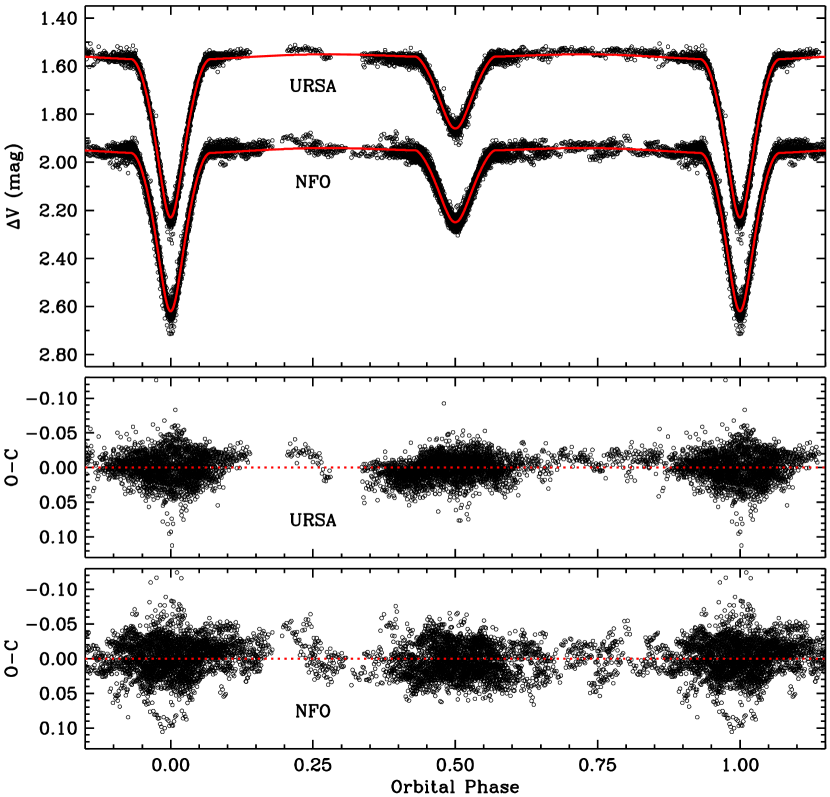
The oblateness of the stars, as defined by Binnendijk (1960), is calculated to be 0.016 for the primary and 0.011 for the secondary, which are well below the safe limit for this binary model (0.04; see, e.g., Popper & Etzel, 1981). Both eclipses are partial. Figure 3 shows the model and photometric observations and residuals.
| Parameter | URSA | NFO | Combined | Prior |
|---|---|---|---|---|
| (day) | 1.14120067 (11) | 1.14120088 (20) | 1.14120073 (9) | [1, 2] |
| (HJD2,400,000) | 53479.93184 (15) | 53479.93178 (29) | 53479.93184 (13) | [53479, 53480] |
| 0.532 (26) | 0.542 (26) | 0.537 (30) | [0.05, 1.00] | |
| 0.4149 (44) | 0.4153 (43) | 0.4166 (43) | [0.05, 0.80] | |
| 0.740 (30) | 0.733 (41) | 0.749 (24) | [0.1, 1.0] | |
| 0.067 (12) | 0.066 (16) | 0.063 (12) | [0, 1] | |
| URSA (mag) | 1.5656 (30) | 1.5650 (36) | [1, 2] | |
| NFO (mag) | 1.5541 (26) | 1.5549 (34) | [1, 2] | |
| 0.548 | 0.548 | 0.548 | [0, 1] | |
| 0.609 | 0.609 | 0.609 | [0, 1] | |
| 0.013 (18) | 0.005 (16) | 0.033 (17) | [0.0, 0.5] | |
| URSA | 1.077 (12) | 1.078 (15) | [-5, 2]* | |
| NFO | 1.455 (14) | 1.456 (15) | [-5, 2]* | |
| 5451 | 6018 | 5451 + 6018 | ||
| Derived quantities | ||||
| 0.2384 (32) | 0.2396 (43) | 0.2382 (28) | ||
| 0.1764 (54) | 0.1756 (67) | 0.1784 (44) | ||
| (degree) | 86.13 (71) | 86.24 (91) | 86.40 (70) | |
| 0.294 (22) | 0.294 (31) | 0.305 (17) | ||
Note. — Uncertainties are indicated in parentheses in units of the last significant place. They are the quadrature sum of the formal 68.3% confidence intervals calculated from the posterior distributions, with a contribution from systematic errors based on the residual permutation exercise described in the text. Priors indicated in square brackets are uniform over the specified ranges, except those for (marked with asterisks), which are log-uniform. The limb-darkening coefficients and were held fixed.
Because of the presence of time-correlated (“red”) noise in the NFO photometry, and to a lesser extent also in the URSA data, in principle there could be subtle biases in the parameters of both solutions that would propagate through to the absolute masses, radii, and other properties, although the good agreement found above between the two completely independent data sets makes this appear unlikely. A consistency test based on the flux ratios supporting this conclusion is presented in the next section.
An additional consequence of time-correlated noise is that the parameter uncertainties may be underestimated, because the MCMC procedure assumes noise is purely Gaussian. To address this concern, we carried out a residual permutation test in which we shifted the residuals from the URSA and NFO solutions separately by a random number of time indices, and added them back into the model curve at each time of observation, wrapping around at the ends of the data sets. This preserves the time-correlated nature of the errors. These artificial data sets were then subjected to a new MCMC solution, simultaneously perturbing the quantities that we held fixed in the original runs (the spectroscopic mass ratio , the limb darkening coefficients and , the gravity darkening coefficients and , and the albedos and ). The perturbed mass ratios were generated by adding Gaussian noise to the spectroscopically determined value, with a standard deviation equal to its measurement error. The other six quantities were similarly perturbed from their adopted values with a standard deviation of 0.1. We repeated this 50 times for each of the three solutions (URSA, NFO, and combined), and adopted the standard deviation of the resulting distribution for each fitted parameter as a more realistic measure of the uncertainty. Finally, we added these uncertainties in quadrature with the internal errors from the MCMC procedure, resulting in the final uncertainties reported in Table 7. For most parameters the additional error contribution from red noise is typically 2–10 times larger than the internal errors, and occasionally even larger.
4. Absolute dimensions
The derived absolute masses, radii, and other properties of BT Vul are listed in Table 8. The masses have relative errors of about 0.6% for both stars, and the radii are good to 1.2% for the primary and 2.5% for the secondary, placing the system among the eclipsing binaries with the best determined properties (see, e.g., Torres et al., 2010).
| Parameter | Primary | Secondary |
|---|---|---|
| () | ||
| () | ||
| (dex) | ||
| () | ||
| (K) | ||
| () | ||
| (mag) | ||
| (mag) | ||
| (mag) | ||
| (km s-1)aaSynchronous projected rotational velocity assuming spin-orbit alignment. | ||
| (km s-1)bbSpectroscopically measured projected rotational velocities. | ||
| (mag) | 0.148 0.033 | |
| (mag) | 0.46 0.10 | |
| Dist. modulus (mag) | ||
| Distance (pc) | ||
| (mas) | ||
| (mas)ccA global parallax zero-point correction of mas has been added to the original Gaia/DR2 parallax (Lindegren et al., 2018a), and 0.021 mas added in quadrature to the internal error (see Lindegren et al., 2018b). | ||
Note. — The masses, radii, and semimajor axis are expressed in units of the nominal solar mass and radius (, ) as recommended by 2015 IAU Resolution B3 (see Prša et al., 2016), and the adopted solar temperature is 5772 K (2015 IAU Resolution B2). Bolometric corrections are from the work of Flower (1996), with conservative uncertainties of 0.1 mag, and the bolometric magnitude adopted for the Sun appropriate for this scale is (see Torres, 2010). See text for the source of the reddening. For the apparent visual magnitude of BT Vul out of eclipse we used (Henden et al., 2015).
Effective temperatures are more challenging to determine accurately than the masses or radii. As indicated in Section 2.2, we are only able to derive a spectroscopic value for the primary star, and the secondary scales directly with it. Degeneracies with surface gravity and metallicity in the way we determine the primary make it sensitive to those quantities, such that increasing or [Fe/H] by 0.5 dex results in a temperature between 200 and 300 K hotter. To our knowledge there is no spectroscopic determination of the metallicity of BT Vul, which would be challenging because of the significant line broadening in both stars. While the radial-velocity determinations from the CfA spectra do not typically require knowledge of or [Fe/H] to much better than 0.5 dex, for the highest accuracy in the absolute dimensions we have chosen to interpolate the primary to the final values of (Table 8) and [Fe/H] (see next section). We obtained K, which we report in the table. The temperature difference between the primary and secondary may be derived from the disk-averaged surface brightness ratio (a function of and the limb-darkening coefficients) through the use of the visual absolute flux scale of Popper (1980). The result, K, combined with the primary temperature, leads to an estimate for the secondary of K, which is listed also in Table 8. These temperatures correspond to spectral types of approximately F0 and F7, according to the tabulation by Pecaut & Mamajek (2013).
While the measured projected rotational velocity for the primary of BT Vul agrees with the value expected if the star’s spin were synchronized and aligned with the orbital motion, the secondary’s value appears slightly higher than predicted, although the difference is small and may not be significant. Tidal theory predicts both stars in a binary with a period as short as this should synchronize on a timescale much less than 1 Myr (see, e.g. Hilditch, 2001).
Interstellar reddening toward BT Vul was estimated from the 3-D extinction map of Green et al. (2019)555http://argonaut.skymaps.info/, and is mag. With the corresponding visual extinction, mag (assuming ), along with the apparent visual magnitude of the system out of eclipse (; Henden et al., 2015) and bolometric corrections from Flower (1996), we infer a distance of pc. This is in very good agreement with the distance of pc inferred from the trigonometric parallax listed in the Gaia/DR2 catalog, after a small correction to the published value and to its uncertainty as explained in Table 8.
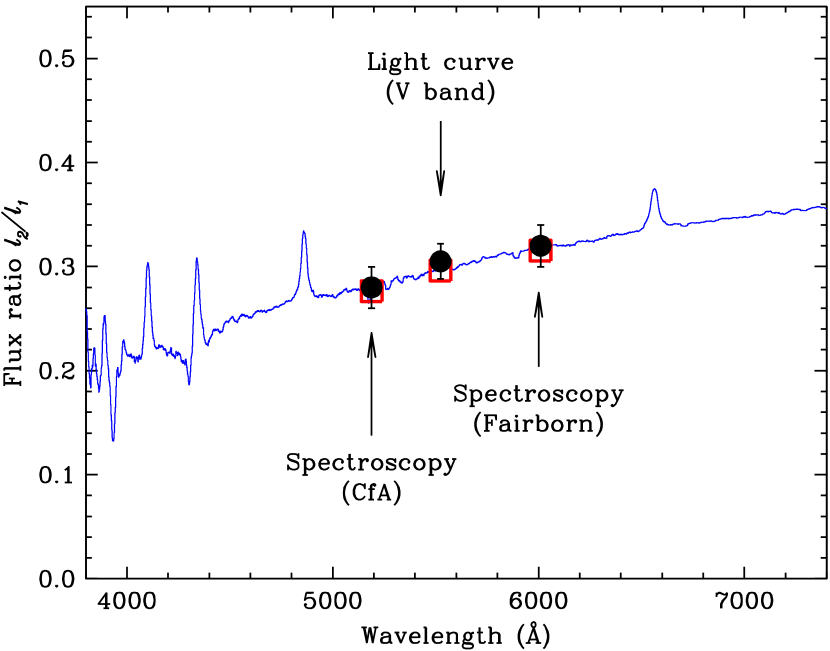
Our spectroscopic measurements of the flux ratio between the components present an opportunity for a check on the internal consistency of our analysis. Neither of those two empirical values of is at the same wavelength as the photometry, so a direct comparison with the -band ratio from the lightcurve analysis is not possible. In its place, we have used synthetic spectra based on PHOENIX models from the library of Husser et al. (2013) for temperatures near our adopted values for the components, in order to predict the flux ratio as a function of wavelength. This is seen in Figure 4, where the normalization of the ratio of the stellar fluxes was carried out using our photometric radius ratio . Both spectroscopic flux ratios, as well as the one derived at from the light curve, agree very well with the prediction, within their uncertainties, supporting the accuracy of our determinations.
5. Comparison with stellar evolution models
Our mass, radius, and temperature determinations for the components of BT Vul are displayed in the mass-radius and mass-temperature diagrams of Figure 5, where they are compared against stellar evolution models from the MIST series (Choi et al., 2016). The dotted lines represent model isochrones for ages between 100 and 700 Myr, in steps of 200 Myr. The best-fit age of 350 Myr is represented with a heavy dashed line. The model metallicity adopted for this comparison (assuming no -element enhancement) is , which is the abundance that provides the best match to the effective temperatures. Note that the empirical values are tied to our spectroscopic determination for the primary from the CfA observations, which, as explained in Section 2.2, is in turn dependent on the chemical composition. We therefore proceeded by iterations, changing the model abundance and then adjusting the spectroscopic temperatures accordingly until reaching agreement between the predicted and observed temperatures at the same composition. There is very good consistency between theory and our , , and determinations.

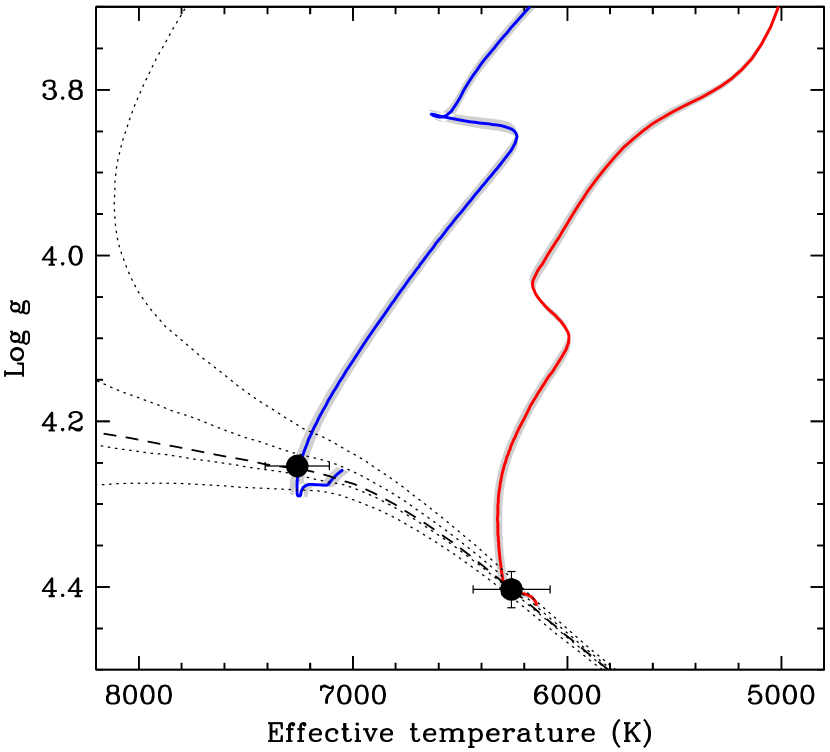
The models point to a fairly young system. The evolutionary state of BT Vul is illustrated more clearly in the Kiel diagram of Figure 6, in which evolutionary tracks are shown for the exact masses we measure. Both stars are seen to be very near the zero-age main sequence (ZAMS). The dotted and dashed lines represent the same isochrones from Figure 5.
6. Final remarks
Our photometric and spectroscopic monitoring of the neglected F-type detached eclipsing binary BT Vul have allowed us to accurately characterize the components, and to measure their masses to a precision of about 0.6% and their radii to 1.2 and 2.5% for the primary and secondary. The comparison with stellar evolution models indicates a system age of about 350 Myr, both stars being very near the ZAMS. Our distance estimate (520 pc) and center-of-mass velocity, along with the Gaia proper motion and position, imply space velocity components of [, , ] = [, , ] km s-1, which are typical of the thin disk in the Milky Way and are consistent with the young age and near-solar composition we infer.
In an astrometric survey of solar-type spectroscopic binaries for additional companions, Tokovinin et al. (2006) have estimated that the vast majority (as many as 96%) of short-period binaries with periods under 3 days are in fact triple or higher-order systems. This is interpreted as evidence for the importance of dynamical processes at play early-on in the evolution of multiple systems, such as Kozai cycles with tidal friction (e.g., Eggleton & Kiseleva-Eggleton, 2001; Fabrycky & Tremaine, 2007). These mechanisms gradually tighten the inner binary through angular momentum exchange with the third star.
Given its orbital period of 1.14 days, it would not be surprising if BT Vul turned out to be a triple system as well, although there is currently no compelling evidence for this in the observations at hand. We detect no long-term trend in the velocity residuals from our spectroscopic orbital solution, and although our final lightcurve solution does return a non-zero value for the third-light parameter () that could be caused by a tertiary star, the measurement is only marginally significant. Additionally, we have examined our CfA spectra with TRICOR (Zucker et al., 1995), an extension of TODCOR to three dimensions, and we see no indication of a third set of lines in our spectra.
The Gaia/DR2 catalog reports a small level of excess astrometric noise in their 5-parameter solution for BT Vul of 0.090 mas, with a dimensionless statistical significance of (see Gaia Collaboration et al., 2018). This is somewhat above the adopted threshold for the catalog that would indicate real unmodeled effects (). While this extra noise could in principle be due to motion in a triple system, it is currently not possible to rule out instrumental effects. High-resolution imaging with adaptive optics in the near infrared, where the contrast with a presumably late-type tertiary star would be more favorable, could shed more light on this issue.
References
- Binnendijk (1960) Binnendijk, L. 1960, Properties of Double Stars, (Univ. of Pennsylvania Press: Philadelphia), p. 290
- Choi et al. (2016) Choi, J., Dotter, A., Conroy, C., et al. 2016, ApJ, 823, 102
- Claret & Bloemen (2011) Claret, A., & Bloemen, S. 2011, A&A, 529, A75
- Eaton & Williamson (2007) Eaton, J. A., & Williamson, M. H. 2007, PASP, 119, 886
- Eggleton & Kiseleva-Eggleton (2001) Eggleton, P. P., & Kiseleva-Eggleton, L. 2001, ApJ, 562, 1012
- Etzel (1981) Etzel, P. B. 1981, Photometric and Spectroscopic Binary Systems, Proc. NATO Adv. Study Inst., ed. E. B. Carling & Z. Kopal (Dordrecht: Reidel), p. 111
- Fabrycky & Tremaine (2007) Fabrycky, D., & Tremaine, S. 2007, ApJ, 669, 1298
- Fekel et al. (2013) Fekel, F. C., Rajabi, S., Muterspaugh, M. W., & Williamson, M. H. 2013, AJ, 145, 111
- Fekel et al. (2009) Fekel, F. C., Tomkin, J., & Williamson, M. H. 2009, AJ, 137, 3900
- Flower (1996) Flower, P. J. 1996, ApJ, 469, 355
- Foreman-Mackey (2016) Foreman-Mackey, D. 2016, The Journal of Open Source Software, 24, http://dx.doi.org/10.5281/zenodo.45906
- Foreman-Mackey et al. (2013) Foreman-Mackey, D., Hogg, D. W., Lang, D., & Goodman, J. 2013, PASP, 125, 306
- Fűrész (2008) Fűrész, G. 2008, PhD thesis, University of Szeged, Hungary
- Gaia Collaboration et al. (2018) Gaia Collaboration, Brown, A. G. A., Vallenari, A., et al. 2018, A&A, 616, A1
- Gelman & Rubin (1992) Gelman, A., & Rubin, D. B. 1992, Statistical Science, 7, 457
- Grauer et al. (2008) Grauer, A. D., Neely, A. W., & Sandberg Lacy, C. H. 2008, PASP, 120, 992
- Gray & Corbally (1994) Gray, R. O., & Corbally, C. J. 1994, AJ, 107, 742
- Green et al. (2019) Green, G. M., Schlafly, E., Zucker, C., et al. 2019, ApJ, 887, 93
- Gregory (2005) Gregory, P. C. 2005, ApJ, 631, 1198
- Guthnick & Schneller (1939) Guthnick, P., & Schneller, H. 1939, Astronomische Nachrichten, 268, 165
- Henden et al. (2015) Henden, A. A., Levine, S., Terrell, D., & Welch, D. L. 2015, American Astronomical Society Meeting Abstracts #225, 225, 336.16
- Hilditch (2001) Hilditch, R. W. 2001, An Introduction to Close Binary Stars (Cambridge, UK: Cambridge University Press) p. 152
- Husser et al. (2013) Husser, T.-O., Wende-von Berg, S., Dreizler, S., et al. 2013, A&A, 553, A6
- Irwin et al. (2011) Irwin, J. M., Quinn, S. N., Berta, Z. K., et al. 2011, ApJ, 742, 123
- Lacy et al. (2008) Lacy, C. H. S., Torres, G., & Claret, A. 2008, AJ, 135, 1757
- Latham et al. (1996) Latham, D. W., Nordström, B., Andersen, J., Torres, G., Stefanik, R. P., Thaller, M., & Bester, M. 1996, A&A, 314, 864
- Latham et al. (2002) Latham, D. W., Stefanik, R. P., Torres, G., et al. 2002, AJ, 124, 1144
- Lindegren et al. (2018a) Lindegren, L., Hernández, J., Bombrun, A., et al. 2018a, A&A, 616, A2
- Lindegren et al. (2018b) Lindegren, L., Hernández, J., Bombrun, A., et al. 2018b, Gaia DR2 astrometry presentation, https://www.cosmos.esa.int/documents/29201/1770596/Lindegren_GaiaDR2_Astrometry_extended.pdf/1ebddb25-f010-6437-cb14-0e360e2d9f09, p. 35
- Nordström et al. (1994) Nordström, B., Latham, D. W., Morse, J. A., et al. 1994, A&A, 287, 33
- Pecaut & Mamajek (2013) Pecaut, M. J., & Mamajek, E. E. 2013, ApJS, 208, 9
- Popper (1980) Popper, D. M. 1980, ARA&A, 18, 115
- Popper & Etzel (1981) Popper, D. M., & Etzel, P. B. 1981, AJ, 86, 102
- Prša et al. (2016) Prša, A., Harmanec, P., Torres, G., et al. 2016, AJ, 152, 41
- Sandberg Lacy & Fekel (2011) Sandberg Lacy, & Fekel F. C. 2011, AJ, 142, 185
- Scarfe (2010) Scarfe, C. D. 2010, The Observatory, 130, 214
- Szentgyorgyi & Fűrész (2007) Szentgyorgyi, A. H., & Fűrész, G. 2007, Precision Radial Velocities for the Kepler Era, in The 3rd Mexico-Korea Conference on Astrophysics: Telescopes of the Future and San Pedro Mártir, ed. S. Kurtz, RMxAC, 28, 129
- Tokovinin et al. (2006) Tokovinin, A., Thomas, S., Sterzik, M., et al. 2006, A&A, 450, 681
- Torres (2010) Torres, G. 2010, AJ, 140, 1158
- Torres et al. (2010) Torres, G., Andersen, J., & Giménez, A. 2010, A&A Rev., 18, 67
- Torres et al. (2009) Torres, G., Sandberg Lacy, C. H., & Claret, A. 2009, AJ, 138, 1622
- Torres et al. (2002) Torres, G., Neuhäuser, R., & Guenther, E. W. 2002, AJ, 123, 1701
- Torres et al. (1997) Torres, G., Stefanik, R. P., Andersen, J., Nordström, B., Latham, D. W., & Clausen, J. V. 1997, AJ, 114, 2764
- Torres et al. (2014) Torres, G., Vaz, L. P. R., Sandberg Lacy, C. H., et al. 2014, AJ, 147, 36
- Zucker et al. (1995) Zucker, S., Torres, G., & Mazeh, T. 1995, ApJ, 452, 863
- Zucker & Mazeh (1994) Zucker, S., & Mazeh, T. 1994, ApJ, 420, 806