Discovery of topological Weyl fermion lines and drumhead surface states in a room temperature magnet
Abstract
Topological matter is known to exhibit unconventional surface states and anomalous transport owing to unusual bulk electronic topology. In this study, we use photoemission spectroscopy and quantum transport to elucidate the topology of the room temperature magnet Co2MnGa. We observe sharp bulk Weyl fermion line dispersions indicative of nontrivial topological invariants present in the magnetic phase. On the surface of the magnet, we observe electronic wave functions that take the form of drumheads, enabling us to directly visualize the crucial components of the bulk-boundary topological correspondence. By considering the Berry curvature field associated with the observed topological Weyl fermion lines, we quantitatively account for the giant anomalous Hall response observed in our samples. Our experimental results suggest a rich interplay of strongly correlated electrons and topology in this quantum magnet.
The discovery of topological phases of matter has led to a new paradigm in physics, which not only explores the analogs of particles relevant for high energy physics, but also offers new perspectives and pathways for the application of quantum materials news_Castelvecchi ; ReviewQuantumMaterials_KeimerMoore ; ReviewQuantumMaterials_Hsieh ; ReviewQuantumMaterials_Nagaosa ; RMPTopoBandThy_Bansil ; Review_ZahidSuyangGuang ; ARCMP_me ; RMPWeylDirac_Armitage ; PbTaSe2_Guang ; Co2MnGa_Guoqing . To date, most topological phases have been discovered in non-magnetic materials Review_ZahidSuyangGuang ; RMPWeylDirac_Armitage ; ARCMP_me , which severely limits their magnetic field tunability and electronic/magnetic functionality. Identifying and understanding electronic topology in magnetic materials will not only provide indispensable information to make their existing magnetic properties more robust, but also has the potential to lead to the discovery of novel magnetic response that can be used to explore future spintronics technology. Recently, several magnets were found to exhibit a large anomalous Hall response in transport, which has been linked to a large Berry curvature in their electronic structures Co2MnGa_Kaustuv ; Co2MnGa_Nakatsuji ; Co3Sn2S2_Enke ; Fe3GeTe2_Kim_Pohang ; Fe3Sn2_Jiaxin . However, it is largely unclear in experiment whether the Berry curvature originates from a topological band structure, such as Dirac/Weyl point or line nodes, due to the lack of spectroscopic investigation. In particular, there is no direct visualization of a topological magnetic phase demonstrating a bulk-boundary correspondence with associated anomalous transport.
Here we use angle-resolved photoemission spectroscopy (ARPES), ab initio calculation and transport to explore the electronic topological phase of the ferromagnet Co2MnGa Co2MnGa_Guoqing . In our ARPES spectra we discover a line node in the bulk of the sample. Taken together with our ab initio calculations, we conclude that we observe Weyl lines protected by crystalline mirror symmetry and requiring magnetic order. In ARPES we further observe drumhead surface states connecting the bulk Weyl lines, revealing a bulk-boundary correspondence in a magnet. Combining our ARPES and ab initio calculation results with transport, we further find that Berry curvature concentrated by the Weyl lines accounts for the giant intrinsic anomalous Hall response in Co2MnGa.
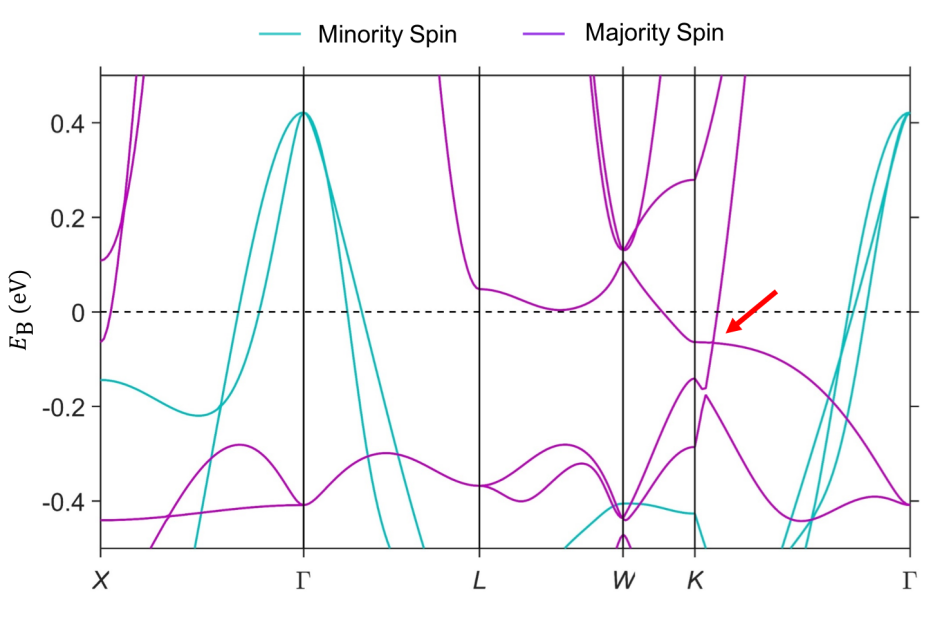
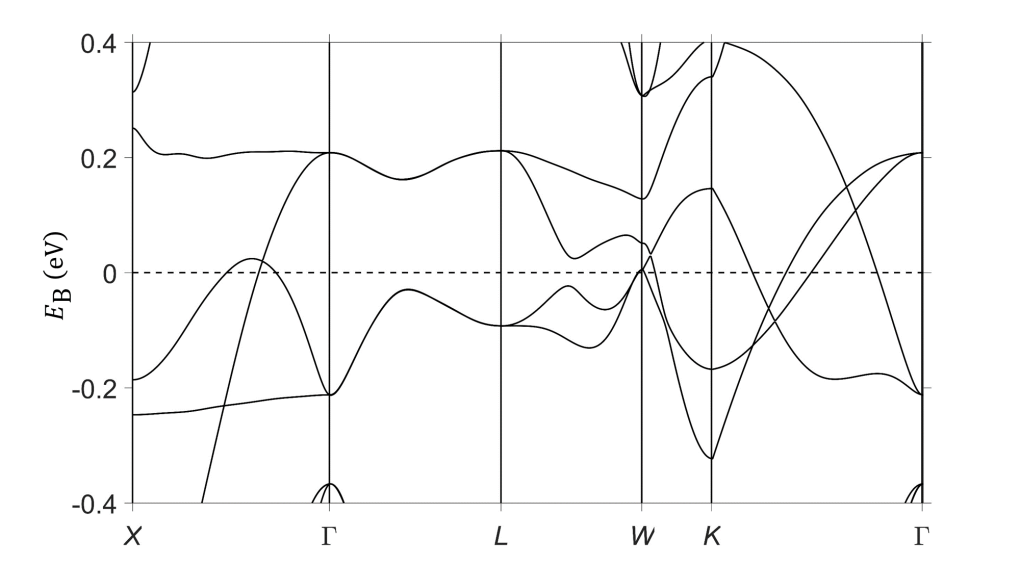
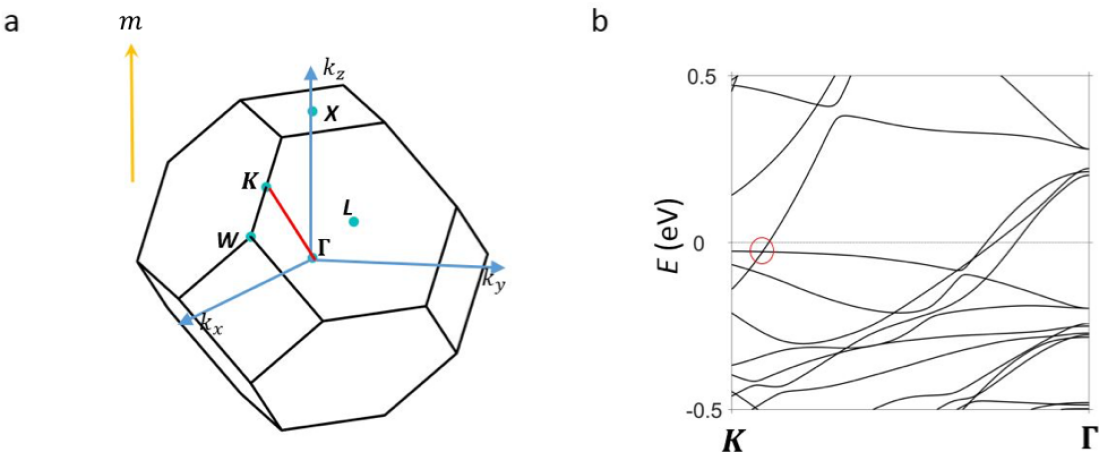
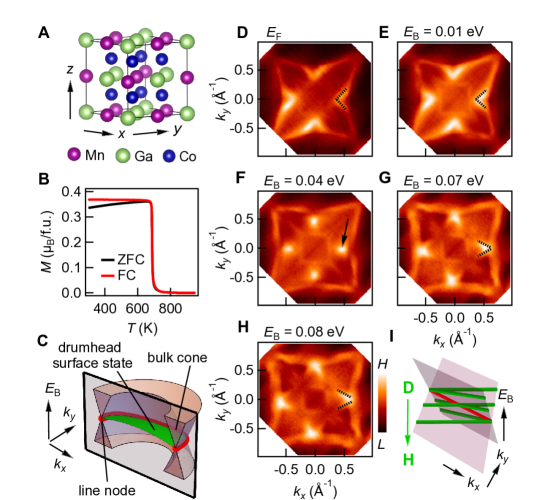
Weyl lines can be understood within a simple framework where one categorizes a topological phase by the dimensionality of the band touching: there are topological insulators, point node semimetals and line node semimetals ClassificationGapped_Schnyder ; RMPWeylDirac_Armitage ; ClassificationReflection_Schnyder ; TINI_Balents . Point nodes are often further sub-categorized as Dirac points, Weyl points and other exotic point touchings RMPWeylDirac_Armitage . Analogously, line nodes can include Dirac lines (four-fold degenerate), Weyl lines (two-fold degenerate) and possibly other one-dimensional band crossings WeylDiracLoop_Nandkishore ; WeylLoopSuperconductor_Nandkishore ; WeylLines_Kane . Line nodes can be protected by crystal mirror symmetry, giving rise to drumhead surface states TINI_Balents ; Ca3P2_Schnyder ; ClassificationReflection_Schnyder ; PbTaSe2_Guang ; NodalChain_Soluyanov ; RMPClassification_ChingKai ; DiracLineNodes_WeiderKane . Co2MnGa takes the full-Heusler crystal structure (Fig. 1A), with a cubic face-centered Bravais lattice, space group (No. 225), indicating the presence of several mirror symmetries in the system. Moreover, the material is ferromagnetic with Co and Mn moments Co2MnGa_neutron and Curie temperature K (Fig. 1B) Co2MnGa_CurieTemp , indicating broken time-reversal symmetry. This suggests that all bands are generically singly-degenerate and that mirror symmetry may give rise to two-fold degenerate line nodes. In a detailed theoretical analysis, we studied the band structure of Co2MnGa by ab initio calculation, neglecting spin-orbit coupling (SOC). We observed that the ferromagnetic exchange splitting drives a phase with two majority spin bands near the Fermi level that exhibit two-fold degeneracies on the mirror planes [18]. These degeneracies, which arise due to a crossing of bands with opposite mirror eigenvalues, form three families of Weyl lines (Fig. 1C, Fig. S10), which are pinned to each other, forming a nodal chain, and some of which further form Hopf-like links with one another. The predicted Weyl lines are protected only when the spin-orbit coupling (SOC) is strictly zero, but numerical results in the presence of SOC suggest that the gap opened is negligible (Fig. S9).
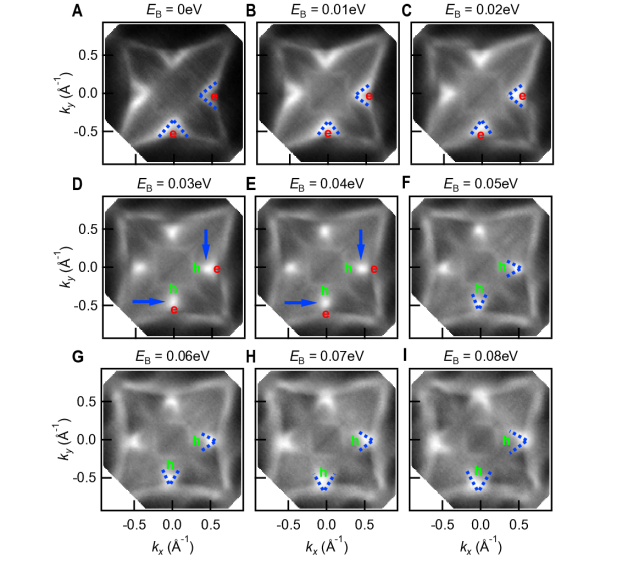
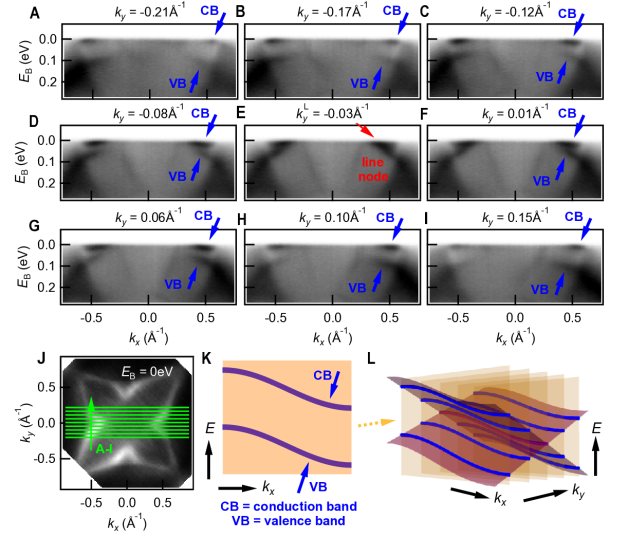
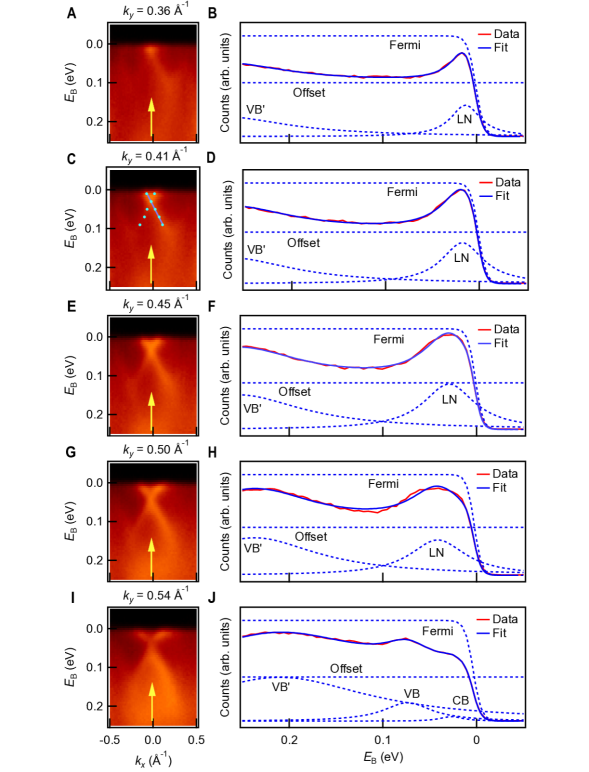
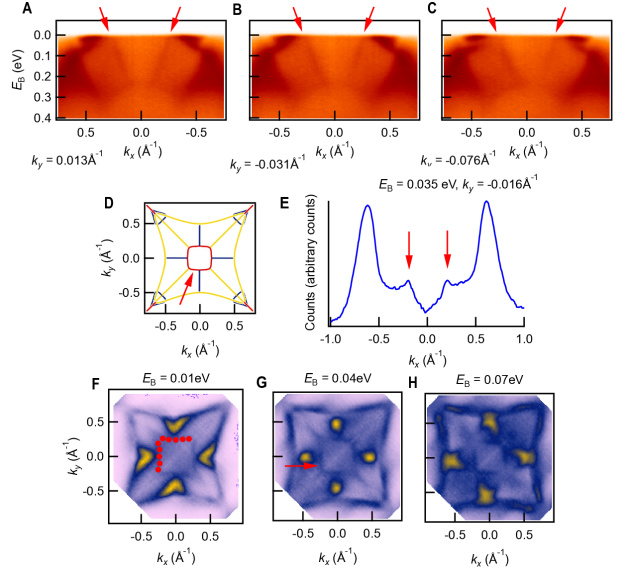
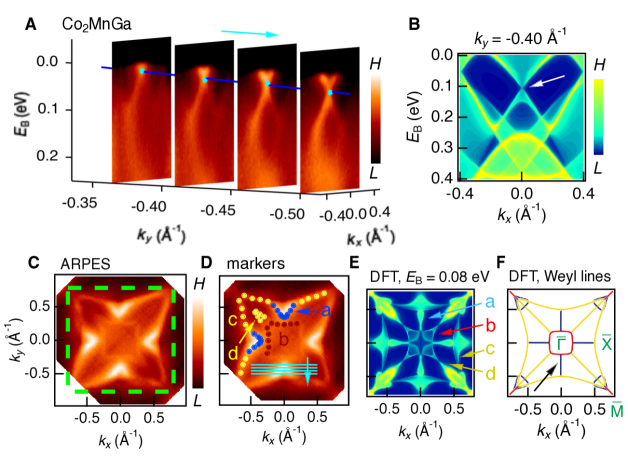
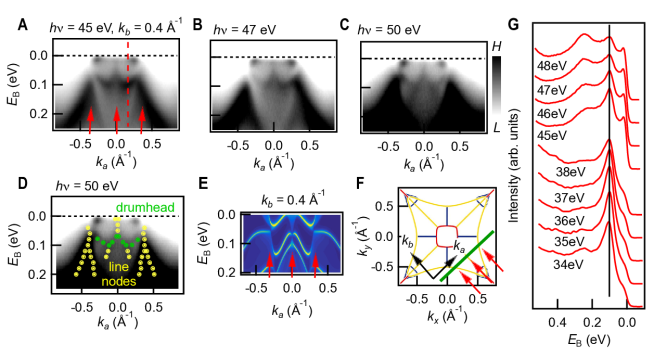
Motivated by these considerations, we investigate Co2MnGa single crystals by ARPES. We focus first on the constant energy surfaces at different binding energies, . We readily observe a feature which exhibits an unusual evolution from a shape (Fig. 1D,E) to a dot (Fig. 1F) to a shape (Fig. 1G-H). This feature suggests that we observe a pair of bands which touch at a series of points in momentum space. As we shift downward in , the touching point moves from left to right (black guides to the eye) and we note that at certain (Fig. 1F) the spectral weight appears to be dominated by the crossing point. This series of momentum-space patterns is characteristic of a line node (Fig. 1I). For the constant-energy surfaces of a line node, as we slide down in the touching point slides from one end of the line node to the other, gradually zipping closed an electron-like pocket (upper band) and unzipping a hole-like pocket (lower band). To better understand this result, we consider cuts passing through the line node feature (Fig. 2A). On these cuts, we observe a candidate band crossing near . We further find that this crossing persists in a range of and moves downward in energy as we cut further from (more negative ). We can fit the candidate band crossing with a single Lorentzian peak, suggestive of a series of touching points between the upper and lower bands (Fig. S13). Taking these fitted touching points, we can in turn fit the dispersion of the candidate line node to linear order, obtaining a slope . Lastly, we observe that at a given , the bands disperse linearly in energy away from the touching points. In this way, our ARPES results suggest the presence of a line node at the Fermi level in Co2MnGa.
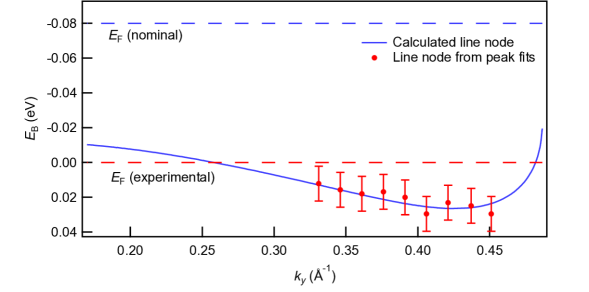
To better understand our experimental results, we compare our spectra with an ab initio calculation of Co2MnGa in the ferromagnetic state Co2MnGa_Guoqing . We consider the spectral weight of bulk states on the (001) surface and we study an cut in the region of interest (Fig. 2B) SM . At we observe a band crossing (white arrow) which we can trace back in numerics to a line node near the point of the bulk Brillouin zone (blue line node in Fig. S10). According to our earlier theoretical analysis, it arises on the (and equivalent) mirror planes Co2MnGa_Guoqing . This line node is a Weyl line, in the sense that it is a two-fold degenerate band crossing extended along one dimension WeylDiracLoop_Nandkishore ; WeylLoopSuperconductor_Nandkishore ; WeylLines_Kane . It is predicted to be pinned to a second, distinct Weyl line, forming part of a nodal chain. To compare experiment and theory in greater detail, we plot the calculated dispersion of the Weyl line against the dispersion as extracted from Lorentzian fits of ARPES data (Fig. S13). We observe a hole-doping of experiment relative to theory of . We speculate that this shift may be due to a chemical doping of the sample or an approximation in the way that DFT captures magnetism in this material. The correspondence between the crossing observed in ab initio calculation and ARPES suggests that we have observed a magnetic Weyl line in Co2MnGa.
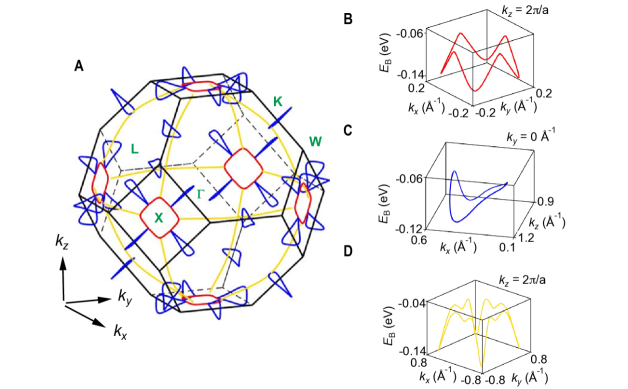
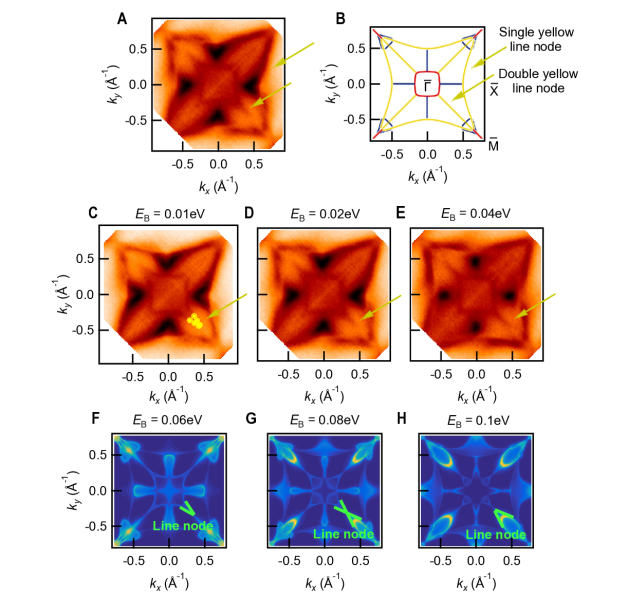
Having considered the blue line node, we search for other line nodes in our data. We compare an ARPES spectrum (Fig. 2C,D) to an ab initio calculation of the surface spectral weight of bulk states, taking into account the observed effective hole-doping of our sample (Fig. 2E). In addition to the blue Weyl line (labelled here as ), we observe a correspondence between three features in experiment and theory: , and . To better understand the origin of these features, we consider all of the predicted Weyl lines in Co2MnGa Co2MnGa_Guoqing and we plot their surface projection with the energy axis collapsed (Fig. 2F). We observe a correspondence between in the ARPES spectrum and the red Weyl line. Similarly, we see that and match with predicted yellow Weyl lines. To further test this correspondence, we look again at our ARPES constant-energy cuts and we find that exhibits a to transition suggestive of a line node (Figs. S16, S17). The comparison between ARPES and ab initio calculation suggests that an entire network of magnetic Weyl lines is realized in Co2MnGa.
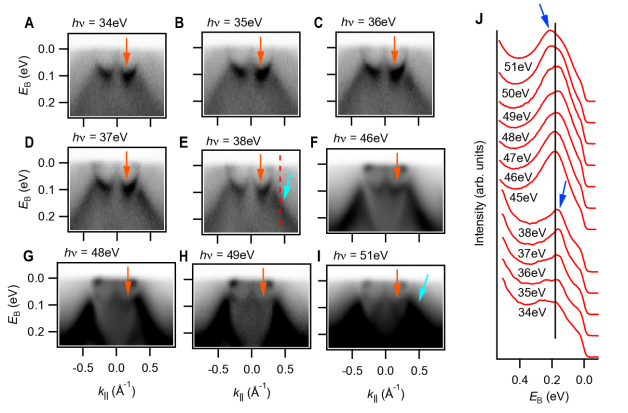
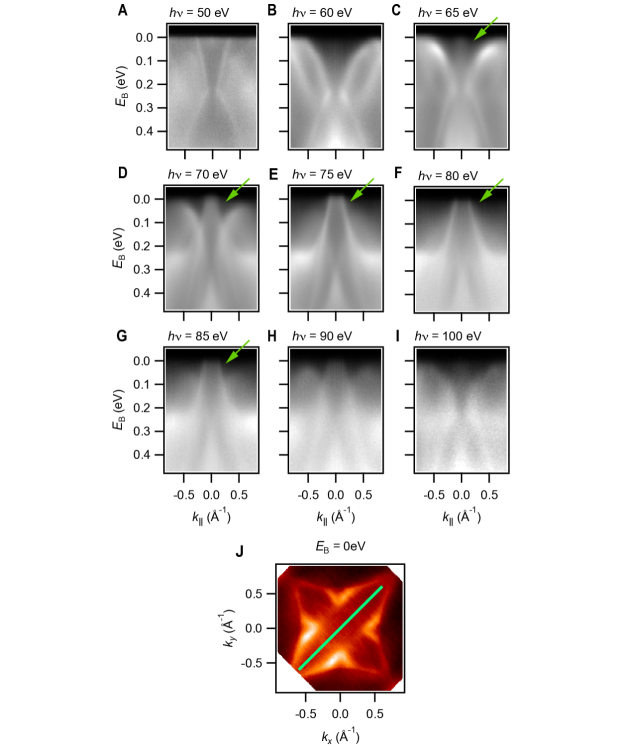
Next we explore the topological surface states. We study the ARPES spectrum along , as marked by the green line in Fig. 3F. On this cut we observe three cones (red arrows in Fig. 3A) which are consistent with the yellow Weyl lines. Interestingly, we also observe a pair of states which appear to connect one cone to the next (Fig. 3A-C). Moreover, these extra states consistently terminate on the candidate yellow Weyl lines as we vary (Fig. S20). We further carry out a photon energy dependence and we discover that these extra states do not disperse with photon energy from to eV, suggestive of a surface state (Fig. 3G). In ab initio calculation, we observe a similar pattern of yellow Weyl lines pinning a surface state (Fig. 3E) SM . These observations suggest that we have observed a drumhead surface state stretching across Weyl lines in Co2MnGa. The pinning of the surface states to the cones further points to a bulk-boundary correspondence between the bulk Weyl lines and the drumhead surface state dispersion.
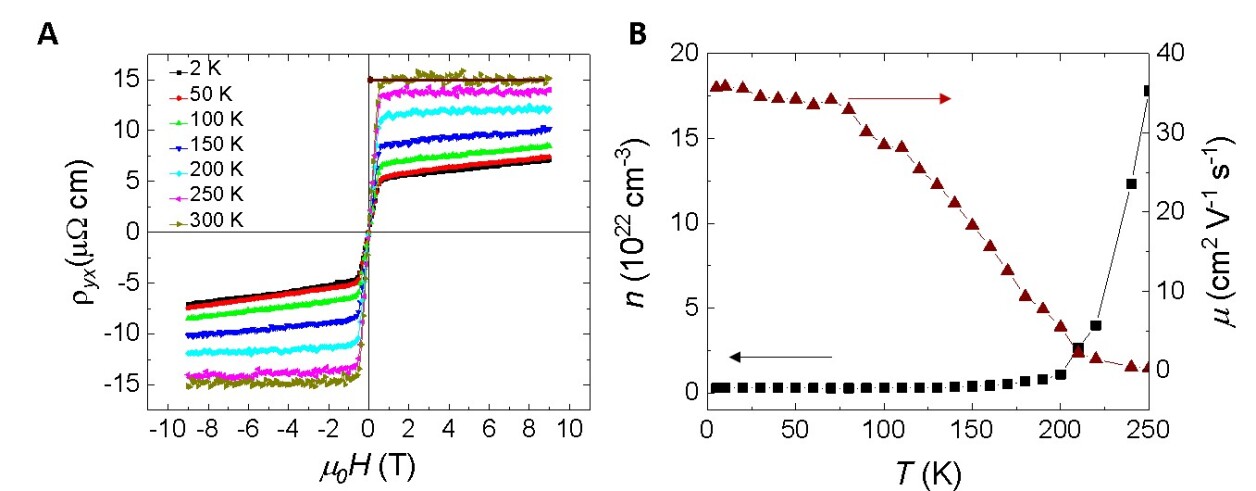
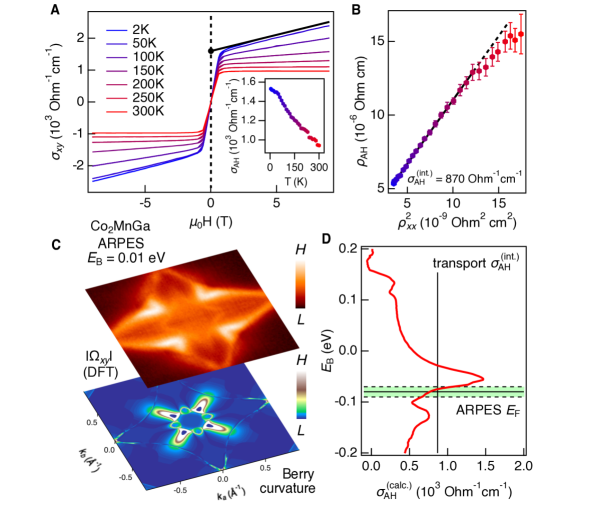
Now that we have provided spectroscopic evidence for a magnetic bulk-boundary correspondence in Co2MnGa, we investigate the relationship between the topological line nodes and the anomalous Hall effect (AHE). We study the Hall conductivity under magnetic field at different temperatures and we extract the anomalous Hall conductivity (Fig. 4A). We obtain a very large AHE value of at 2 K, consistent with earlier reports Co2MnGa_Kaustuv ; Co2MnGa_Nakatsuji . To understand the origin of the large AHE, we study the scaling relation between the anomalous Hall resistivity, , and the square of the longitudinal resistivity, , both considered as a function of temperature. It has been shown that under the appropriate conditions, the scaling relation takes the form,
where is the residual longitudinal resistivity, represents the contribution from skew scattering, represents the side-jump term and represents the intrinsic Berry curvature contribution to the AHE ScalingAHE_TianYeJin_2009 ; ScalingAHE_TianJinNiu_2015 ; ScalingAHE_TianJin_2016 . When we plot against , we observe that a linear scaling appears to hold below K (Fig. 4B). It is possible that the deviation from linearity at high temperature arises from cancellations of Berry curvature associated with thermal broadening of the Fermi-Dirac distribution, as recently proposed for the AHE in metals ScalingAHE_YeTianJinXiao_2012 . From the linear fit, we find that the intrinsic Berry curvature contribution to the AHE is . This large intrinsic AHE leads us to consider the role of the Weyl lines in producing a large Berry curvature. To explore this question, we compare the intrinsic AHE measured in transport with a prediction based on ARPES and DFT. We observe in first-principles that the Berry curvature distribution, which we calculate in the presence of spin-orbit coupling, is dominated by the topological line nodes (Fig. 4C) SM . Next we integrate the Berry curvature up to a given binding energy to predict as a function of the Fermi level. Then we set the Fermi level from ARPES, predicting (Fig. 4D). This is in remarkable agreement with the value extracted from transport, suggesting that the topological line nodes contribute significantly to the large AHE in Co2MnGa.
In summary, our ARPES and corresponding transport experiments, supported by ab initio calculation, provide evidence for magnetic Weyl lines in the room-temperature ferromagnet Co2MnGa. We further find that the Weyl lines give rise to drumhead surface states and a large anomalous Hall response, providing the first demonstration of a topological magnetic bulk-boundary correspondence with associated anomalous transport. Since there are 1651 magnetic space groups and thousands of magnets in three-dimensional solids, the experimental methodology of transport-bulk-boundary exploration established here can be a valuable guideline in probing and discovering novel topological phenomena on the surfaces and the bulk of magnetic materials.
I Acknowledgments
Funding: Work at Princeton University is supported by the U.S. Department of Energy (DOE) under Basic Energy Sciences, grant no. DOE/BES DE-FG-02-05ER46200. I.B. acknowledges the support of the Harold W. Dodds Fellowship of Princeton University. The work at Northeastern University was supported by DOE, Office of Science, Basic Energy Sciences grant no. DE-FG02-07ER46352 and benefited from Northeastern University’s Advanced Scientific Computation Center (ASCC) and the NERSC supercomputing center through DOE grant no. DE-AC02-05CH11231. Use of the Stanford Synchrotron Radiation Lightsource (SSRL), SLAC National Accelerator Laboratory, is supported by the U.S. Department of Energy, Office of Science, Office of Basic Energy Sciences, under contract no. DE-AC02-76SF00515. This research used resources of the Advanced Light Source, which is a DOE Office of Science User Facility under contract no. DE-AC02-05CH11231. K.M., B.E., and C.F. acknowledge the financial support by the ERC Advanced Grant no. 291472 “Idea Heusler” and 742068 “TOPMAT.” T.-R.C was supported by the Young Scholar Fellowship Program of the Ministry of Science and Technology (MOST) of Taiwan, under MOST Grant for the Columbus Program no. MOST 108-2636-M-006-002, National Cheng Kung University, Taiwan, and the National Center for Theoretical Sciences (NCTS), Taiwan. This work was further partially supported by the MOST, Taiwan, grant no. MOST 107-2627-E-006-001. This research was supported in part by the Higher Education Sprout Project, Ministry of Education to the Headquarters of University Advancement at National Cheng Kung University. STM characterization of samples was supported by the Gordon and Betty Moore Foundation (GBMF4547/Hasan). M.Z.H. acknowledges support from the Miller Institute of Basic Research in Science at the University of California at Berkeley and Lawrence Berkeley National Laboratory in the form of a Visiting Miller Professorship during the early stages of this work. M.Z.H. also acknowledges visiting scientist support from IQIM at the California Institute of Technology.
Scientific support: We thank D. Lu and M. Hashimoto at Beamlines 5-2 and 5-4 of the Stanford Synchrotron Radiation Lightsource (SSRL) at the SLAC National Accelerator Laboratory, CA, USA, and J. Denlinger at Beamline 4.0.3 and S.-K. Mo at Beamline 10.0.1 of the Advanced Light Source (ALS) at Lawrence Berkeley National Laboratory (LBNL), CA, USA, for support.
Author contributions: The project was initiated by I.B., K.M., C.F., and M.Z.H. I.B. and D.S.S. carried out ARPES measurements and analyzed ARPES data with assistance from G.C., J.Y., S.S.Z., T.C., N.S., H.Z., G.B., D.M., M.L., S.-Y.X., and M.Z.H. K.M. synthesized the single-crystal samples and carried out the transport and magnetization measurements with assistance from B.E. I.B. and K.M. analyzed the transport data with assistance from G.C. and T.C. G.C. performed first-principles calculations and theoretical analysis with assistance and guidance from B.S., G.B., X.Z., S.-M.H., B.W., T.-R.C., S.-Y.X., A.B., and H.L. The project was supervised by C.F., H.L., and M.Z.H. All authors discussed the results and contributed to writing the manuscript.
Competing interests: The authors declare no competing interests.
Data and materials availability: The data presented in this work are available on Zenodo Source .
II Supplementary Materials
References DFT2 ; DFT3 ; DFT4 ; Co2MnGa_exchange ; Co2MnAl_Jakob ; ReviewAHE_Nagaosa_Ong .
References
- (1) D. Castelvecchi, The strange topology that is reshaping physics. Nature 547, 272 (2017).
- (2) B. Keimer, J. E. Moore, The physics of quantum materials. Nat. Phys. 13, 1045 (2017).
- (3) D. N. Basov, R. D. Averitt, D. Hsieh, Towards properties on demand in quantum materials. Nat. Mat. 16, 1077 (2017).
- (4) Y. Tokura, M. Kawasaki, N. Nagaosa, Emergent functions of quantum materials. Nat. Phys. 13, 1056 (2017).
- (5) A. Bansil, H. Lin, T. Das, Topological band theory. Rev. Mod. Phys. 88, 021004 (2016).
- (6) M. Z. Hasan, S.-Y. Xu, G. Bian, Topological insulators, topological superconductors and weyl fermion semimetals: discoveries, perspectives and outlooks. Phys. Scr. 2015, T164 (2015).
- (7) M. Z. Hasan, S.-Y. Xu, I. Belopolski, S.-M. Huang, Discovery of Weyl fermion semimetals and topological Fermi arc states. Ann. Rev. Cond. Matt. Phys. 2017, 289 (8).
- (8) N. P. Armitage, E. J. Mele, A. Vishwanath, Weyl and Dirac semimetals in three-dimensional solids. Rev. Mod. Phys. 90, 015001 (2018).
- (9) G. Bian, et al., Topological nodal-line fermions in spin-orbit metal PbTaSe2. Nat. Commun. 7, 10556 (2016).
- (10) G. Chang, et al., Topological Hopf and chain link semimetal states and their application to Co2MnGa. Phys. Rev. Lett. 119, 156401 (2017).
- (11) K. Manna, et al., From colossal to zero: Controlling the anomalous Hall effect in magnetic Heusler compounds via Berry curvature design (2017). arXiv:1712.10174.
- (12) A. Sakai, et al., Giant anomalous Nernst effect and quantum-critical scaling in a ferromagnetic semimetal. Nat. Phys. (2018). DOI:10.1038/s41567-018-0225-6.
- (13) E. Liu, et al., Giant anomalous Hall effect in a ferromagnetic kagome-lattice semimetal. Nat. Phys. (2018). DOI:10.1038/s41567-018-0234-5.
- (14) K. Kim, et al., Large anomalous Hall current induced by topological nodal lines in a ferromagnetic van der Waals semimetal. Nat. Mat. (2018). DOI:10.1038/s41563-018-0132-3.
- (15) J.-X. Yin, et al., Giant and anisotropic many-body spin-orbit tunability in a strongly correlated kagome magnet. Nature 562, 91 (2018).
- (16) A. P. Schnyder, S. Ryu, A. Furusaki, A. W. Ludwig, Classification of topological insulators and superconductors in three spatial dimensions. Phys. Rev. B 78, 195125 (2008).
- (17) C.-K. Chiu, A. P. Schnyder, Classification of reflection-symmetry-protected topological semimetals and nodal superconductors. Phys. Rev. B 90, 205136 (2014).
- (18) A. A. Burkov, M. D. Hook, L. Balents, Topological nodal semimetals. Phys. Rev. B 84, 235126 (2011).
- (19) R. Nandkishore, Weyl and Dirac loop superconductors. Phys. Rev. B 93, 020506 (2016).
- (20) Y. Wang, R. Nandkishore, Topological surface superconductivity in doped Weyl loop materials. Phys. Rev. B 95, 060506 (2017).
- (21) O. Stenull, C. L. Kane, T. C. Lubensky, Topological phonons and Weyl lines in three dimensions. Phys. Rev. Lett. 117, 068001 (2016).
- (22) Y.-H. Chan, C.-K. Chiu, M. Y. Chou, A. P. Schnyder, Ca3P2 and other topological semimetals with line nodes and drumhead surface states. Phys. Rev. B 93, 205132 (2016).
- (23) T. Bzdus̆ek, Q. Wu, A. Rüegg, M. Sigrist, A. A. Soluyanov, Nodal-chain metals. Nature 538, 75 (2016).
- (24) C.-K. Chiu, J. C. Y. Teo, A. P. Schnyder, S. Ryu, Classification of topological quantum matter with symmetries. Rev. Mod. Phys. 88, 035005 (2016).
- (25) Y. Kim, B. J. Wieder, C. L. Kane, A. M. Rappe, Dirac line nodes in inversion-symmetric crystals. Phys. Rev. Lett. 115, 036806 (2015).
- (26) P. J. Webster, Magnetic and chemical order in heusler alloys containing cobalt and manganese. J. Phys. Chem. Solids 32, 1221 (1971).
- (27) H. Ido, S. Yasuda, Magnetic properties of Co-Heusler and related mixed alloys. J. de Physique 49, C8 (1988).
- (28) See supplementary materials.
- (29) Y. Tian, L. Ye, X. Jin, Proper scaling of the anomalous Hall effect. Phys. Rev. Lett. 103, 087206 (2009).
- (30) D. Hou et al., Multivariable scaling for the anomalous Hall effect. Phys. Rev. Lett. 114, 217203 (2015).
- (31) L. Wu, K. Zhu, D. Yue, Y. Tian, X. Jin, Anomalous Hall effect in localization regime. Phys. Rev. B 93, 214418 (2016).
- (32) L. Ye, Y. Tian, X. Jin, D. Xiao, Temperature dependence of the intrinsic anomalous Hall effect in nickel. Phys. Rev. B 85, 220403 (2012).
- (33) G. Bryant, Surface states of ternary semiconductor alloys: Effect of alloy fluctuations in one-dimensional models with realistic atoms. Phys. Rev. B 31, 5166 (1985).
- (34) I. Belopolski et al., Source data for “Discovery of topological Weyl lines and drumhead surface states in a room temperature magnet.” Zenodo (2019); DOI:10.5281/zenodo.2669915.
- (35) G. Kresse, J. Furthmueller, Efficient iterative schemes for ab initio total-energy calculations using a plane-wave basis set. Phys. Rev. B 54, 11169 (1996).
- (36) G. Kresse, D. Joubert, From ultrasoft pseudopotentials to the projector augmented-wave method. Phys. Rev. B 59, 1758 (1999).
- (37) J. P. Perdew, K. Burke, M. Ernzerhof, Generalized gradient approximation made simple. Phys. Rev. Lett. 77, 3865 (1996).
- (38) Y. Kurtulus, R. Dronskowski, G. D. Samolyuk, V. P. Antropov, Electronic structure and magnetic exchange coupling in ferromagnetic full Heusler alloys. Phys. Rev. B 71, 014425 (2005).
- (39) E. V. Vidal, G. Stryganyuk, H. Schneider, C. Felser, G. Jakob, Exploring Co2MnAl Heusler compound for anomalous Hall effect sensors. App. Phys. Lett. 99, 132509 (2011).
- (40) N. Nagaosa, J. Sinova, S. Onoda, A. H. MacDonald, N. P. Ong, Anomalous Hall effect. Rev. of Mod. Phys. 82, 1539 (2010).
Supplementary Materials for:
Discovery of topological Weyl fermion lines and drumhead surface states in a room temperature magnet
Ilya Belopolski∗
Kaustuv Manna∗
Daniel S. Sanchez∗
Guoqing Chang∗
Benedikt Ernst
Jiaxin Yin
Songtian S. Zhang
Tyler A. Cochran
Nana Shumiya
Hao Zheng
Bahadur Singh
Guang Bian
Daniel Multer
Maksim Litskevich
Xiaoting Zhou
Shin-Ming Huang
Baokai Wang
Tay-Rong Chang
Su-Yang Xu
Arun Bansil
Claudia Felser
Hsin Lin
M. Zahid Hasan
III Materials and Methods
III.1 Single crystal growth
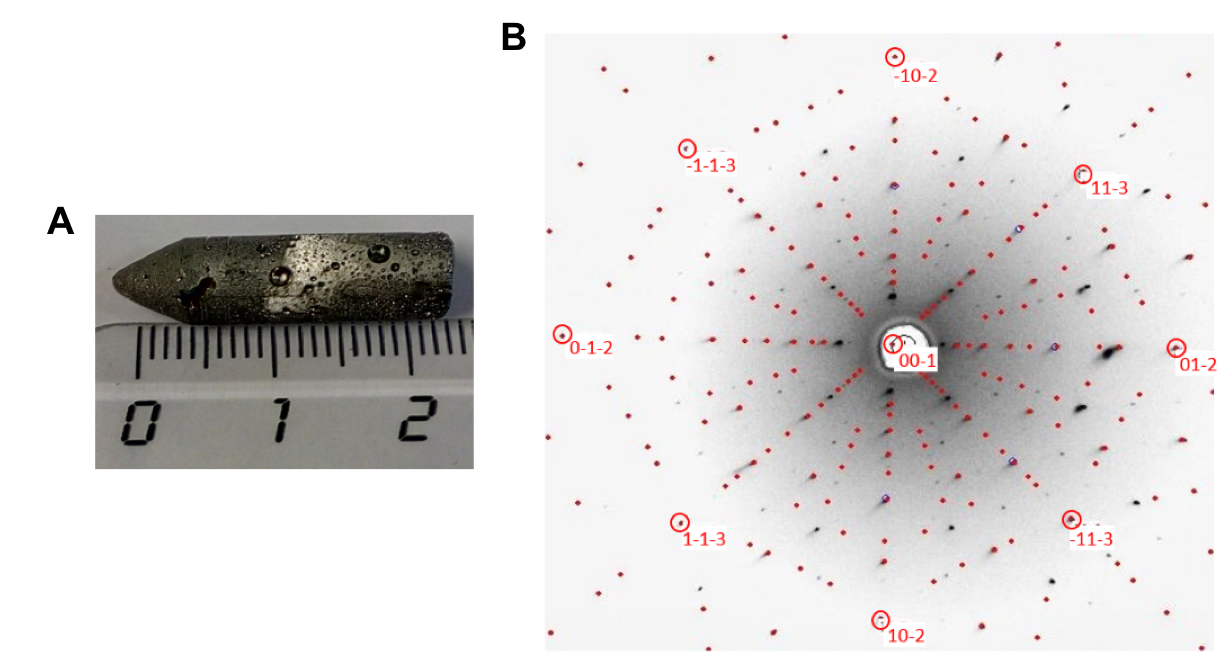
Single crystals of Co2MnGa were grown using the Bridgman-Stockbarger crystal growth technique. First, we prepared a polycrystalline ingot using the induction melt technique with the stoichiometric mixture of Co, Mn and Ga metal pieces of 99.99% purity. Then, we poured the powdered material into an alumina crucible and sealed it in a tantalum tube. The growth temperature was controlled with a thermocouple attached to the bottom of the crucible. For the heating cycle, the entire material was melted above 1200∘C and then slowly cooled below 900∘C (Fig. S1A). We analyzed the crystals with white beam backscattering Laue X-ray diffraction at room temperature (Fig. S1B). The samples show very sharp spots that can be indexed by a single pattern, suggesting excellent quality of the grown crystals without any twinning or domains. We show a representative Laue diffraction pattern of the grown Co2MnGa crystal superimposed on a theoretically-simulated pattern, Fig. S1B. The crystal structure is found to be cubic with lattice parameter Å.
III.2 Magnetization, transport
Magnetic measurements were performed using a Quantum Design vibrating sample magnetometer (VSM) operating in a temperature range of K with magnetic field up to 7 T. The transport experiments were performed in a Quantum Design physical property measurement system (PPMS, ACT option) in a temperature range of K with magnetic field up to 9 T. For the longitudinal and Hall resistivity measurements, we employed a 4-wire and 5-wire geometry, respectively, with a 25 m platinum wire spot-welded on the surface of the oriented Co2MnGa single crystals.
III.3 Angle-resolved photoemission spectroscopy
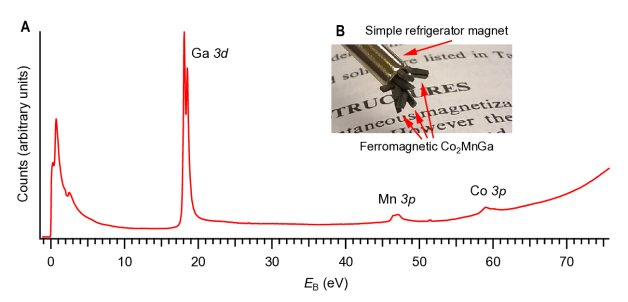
Ultraviolet ARPES measurements were carried out at Beamlines 5-2 and 5-4 of the Stanford Synchrotron Radiation Lightsource, SLAC in Menlo Park, CA, USA with a Scienta R4000 electron analyzer. The angular resolution was better than 0.2∘ and the energy resolution better than 20 meV, with a beam spot size of about m for Beamline 5-2 and m for Beamline 5-4. Samples were cleaved in situ and measured under vacuum better than Torr at temperatures 25 K. A core level spectrum of Co2MnGa measured with 100 eV photons showed peaks consistent with the elemental composition (Fig. SS2).
III.4 First-principles calculations
Numerical calculations of Co2MnGa were performed within the density functional theory (DFT) framework using the projector augmented wave method as implemented in the VASP package DFT2 ; DFT3 . The generalized gradient approximation (GGA) DFT4 and a -centered -point mesh were used. Ga orbitals and Mn, Co orbitals were used to generate a real space tight-binding model, giving the Wannier functions. The surface states on a (001) semi-infinite slab were calculated from the Wannier functions by an iterative Green’s function method.
IV Supplementary Text
IV.1 Magnetism & transport
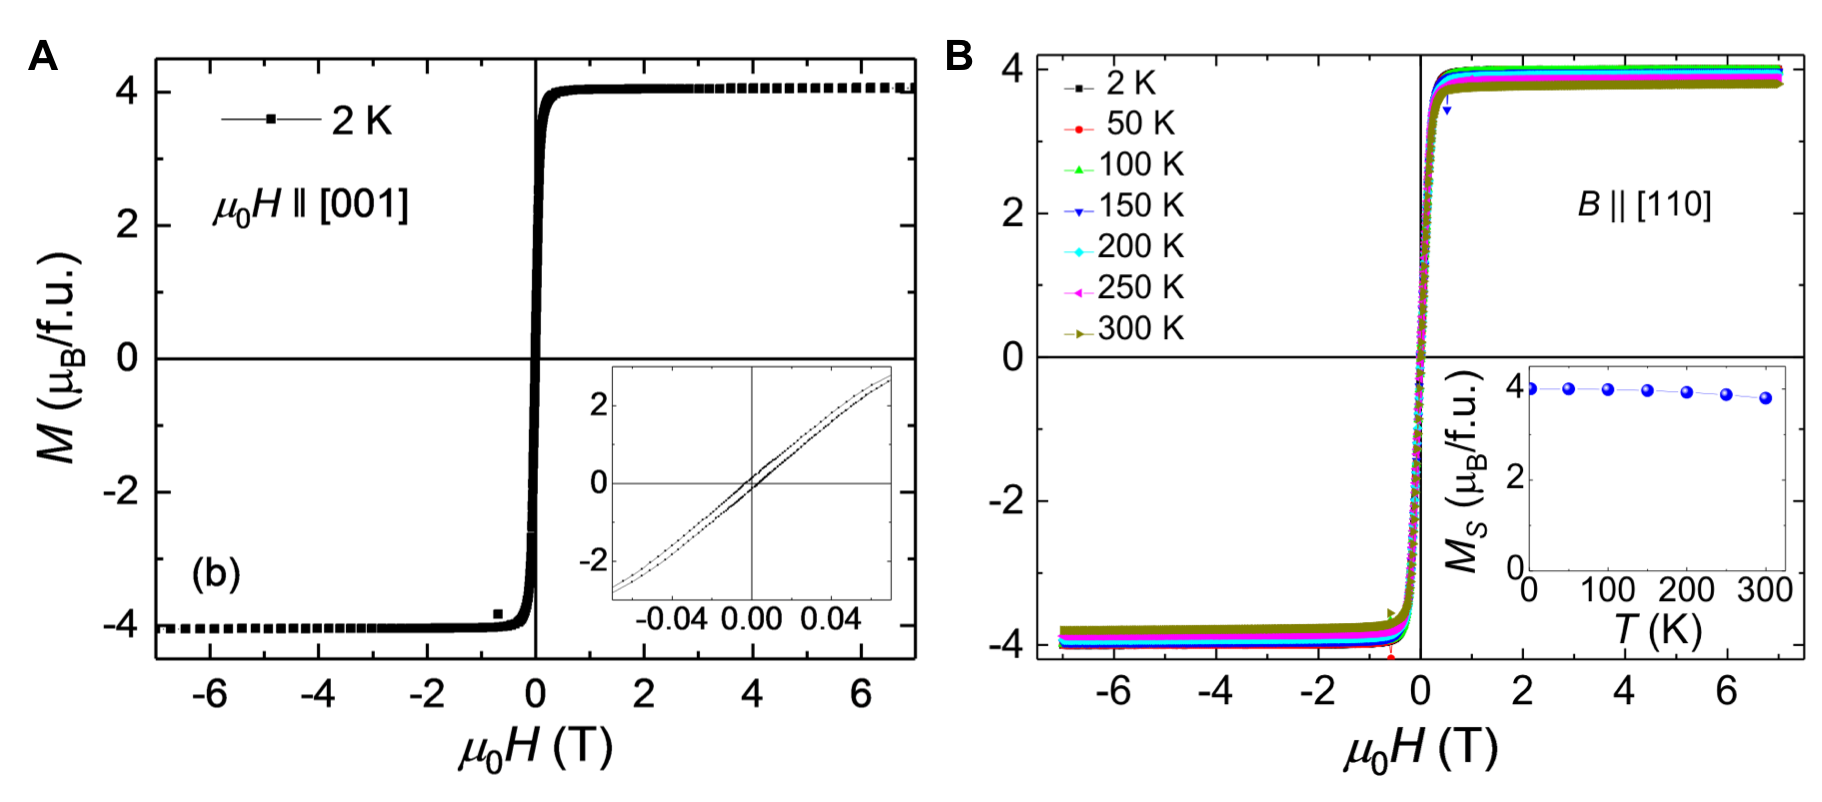
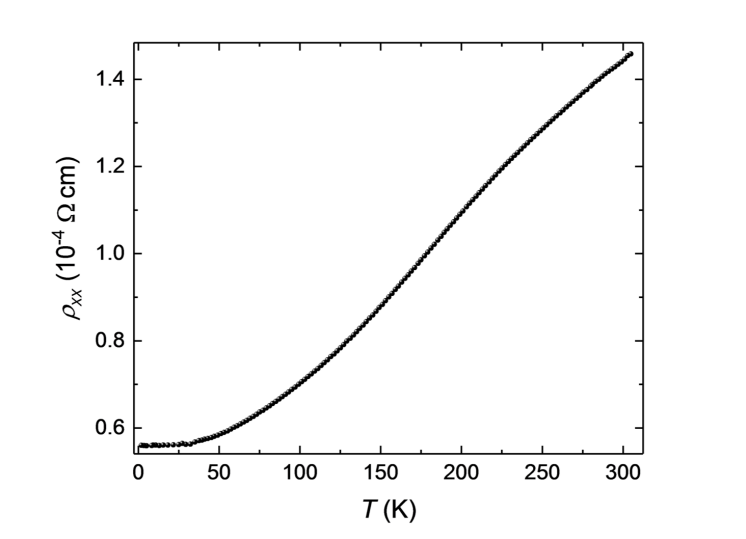
The magnetic hysteresis loop recorded at 2 K shows a soft ferromagnetic behavior, (Fig. S3A). The magnetization saturates above T field with saturation magnetization /f.u. Earlier neutron diffraction experiments reported a moment of Mn atom and Co atom, with negligible moment on Ga and total moment /f.u. Co2MnGa_neutron , consistent with our saturation magnetization measurement. Evidently, the compound follows the Slater-Pauling rule, , where is the number of valence electrons, for Co2MnGa. We see a ferromagnetic loop opening with coercive field Oe (Fig. S3A, inset). We observe that decreases slightly with increasing temperature (Fig. S3B). An earlier work addressing the origin of the ferromagnetic phase performed a first-principles calculation of exchange interaction parameters in Co2MnGa and found that the leading contribution is provided by exchange between 3 orbitals on nearest-neighbor Mn and Co sites, see Tables II and III in Co2MnGa_exchange . This nearest-neighbor Mn-Co exchange was found in calculation to have a positive sign, favoring ferromagnetic alignment. Next, we study the temperature dependent longitudinal resistivity of our samples , with zero applied magnetic field (Fig. S4). We measure current along the [100] direction. Clearly the compound shows metallic behavior throughout the temperature range with very low residual resistivity: cm and residual resistivity ratio (RRR) .
We provide some additional background on the Hall measurements presented in maintext Fig. 4. The Hall resistivity is generally expressed as,
where is known as the ordinary Hall coefficient arising from the Lorentz force and is the anomalous Hall contribution ReviewAHE_Nagaosa_Ong . The Hall conductivity is defined from the matrix inverse of ,
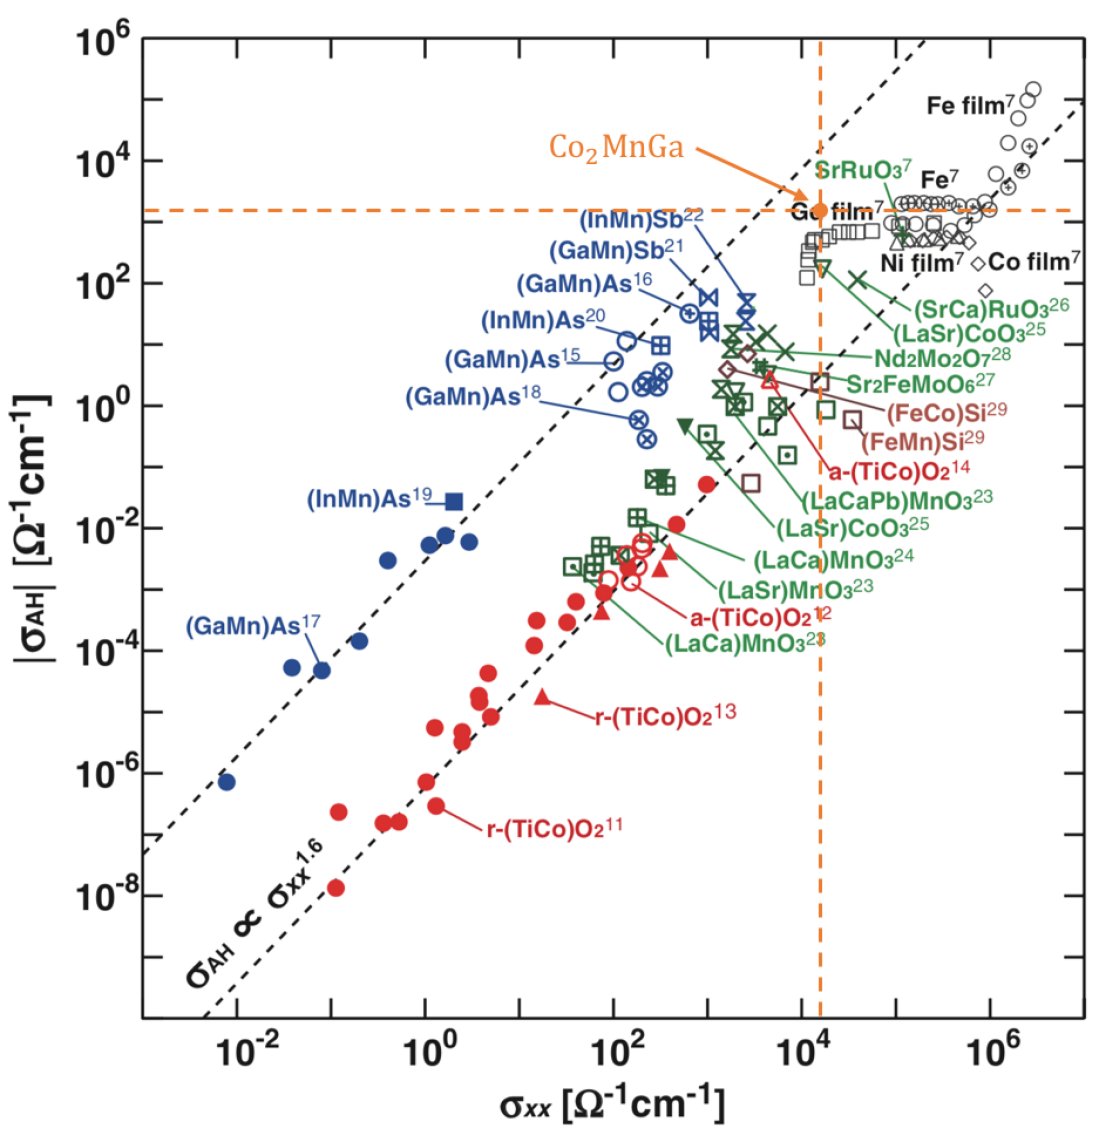
where is the longitudinal resistivity. Therefore, we can obtain (or, in a similar way, ) by extrapolating the high field value back to to find the intercept, as shown in main text Fig. 4A and Fig. S5A. We find at 2 K, the largest anomalous Hall response in any known material except Fe and Co2MnAl, Fig. S6 and Ref. Co2MnAl_Jakob . Further, from the high field slope of as a function of , we find an ordinary Hall coefficient at 2 K and at 300 K. The positive sign of suggests that the charge carriers in Co2MnGa are majority hole type through the full temperature range. We estimate the carrier concentration as and the carrier mobility as , where is the electron charge, Fig. S5B.
IV.2 Survey band structure calculation
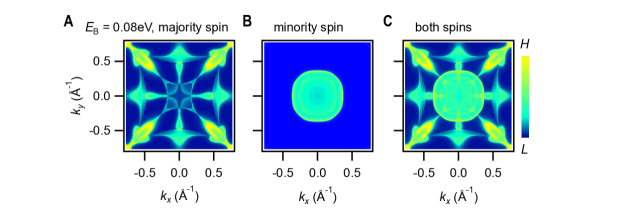
We consider a bird’s eye view of the ab initio bulk band structure in the ferromagnetic state (Fig. S7). We observe two majority spin bands near the Fermi level—these are the bands which form the Weyl lines Co2MnGa_Guoqing . There is also a large, irrelevant minority spin pocket around which we experimentally suppress by judicious choice of photon energy in ARPES. For completeness, we present ARPES measurements on this minority spin pocket below (Fig. S22). Without magnet order, the ab initio band structure changes drastically (Fig. S8). This provides additional evidence that in ARPES we access the magnetic state of Co2MnGa. Moreover, this result suggests that the Weyl lines we observe are essentially magnetic in the sense that they disappear if we remove the magnetic order.
We also perform a band structure calculation taking into account spin-orbit coupling (SOC) and we find that the gap opened is of order meV, negligible for our ARPES measurements (Fig. S9).
IV.3 Weyl lines from calculation
Here we give a more systematic introduction to the full network of Weyl lines in Co2MnGa as predicted by ab initio Co2MnGa_Guoqing . Recall that a Weyl line is a one-dimensional crossing between a pair of singly-degenerate bands. In Co2MnGa, the Weyl lines are contained in the mirror planes of the bulk Brillouin zone but they are allowed to disperse in energy. As a result, it is instructive to plot each Weyl line as a function of and , where and without loss of generality are the two momentum axes of the mirror plane. Ab initio predicts three independent Weyl lines in Co2MnGa, which we denote the red, blue and yellow Weyl lines (Fig. S10B-D). The energies are marked with respect to the Fermi level observed in numerics. Since we find in experiment that the Fermi level is at eV relative to calculation, the experimental Fermi level cuts through all of the Weyl lines. To better view the full pattern of line nodes throughout the bulk Brillouin zone, we collapse the energy axis and plot the line nodes in (Fig. S10A). Although we start with three independent line nodes, these are each copied many times by the symmetries of the crystal lattice, giving rise to a rich line node network.
Since we are studying the (001) surface, it’s useful to consider more carefully how the line nodes project onto the surface Brillouin zone—in other words, to see how Fig. 2F arises from Fig. S10A. To start, the center red line node will project straight up on its face around . By contrast, the adjacent blue line nodes are “standing up” and will project on their side, so that in fact there will be a “double” cone in the surface projection. Moreover, the blue line node projection will form an open line node segment. The other red line nodes will also project on their side, forming “double” red cones along an open line segment. The yellow line nodes also projects in two distinct ways. The yellow line nodes in the plane will produce a single yellow line node projection, while the yellow line nodes in the and planes are standing up, so they will produce a double yellow line node in an open segment. Band folding associated with the (001) surface projection further sends the yellow line node towards .
IV.4 ARPES systematics on the blue Weyl line
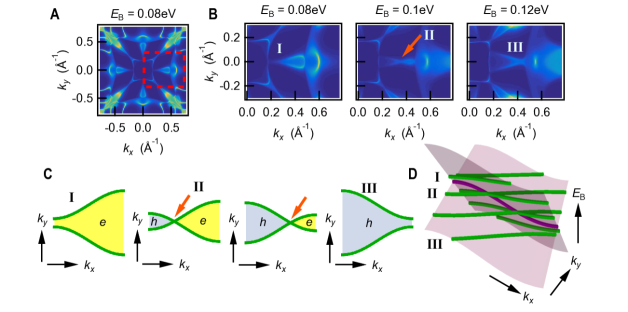
We present an extended dataset for main text Fig. 1D-H (Fig. S11), with a finer sampling. We observe in greater detail the evolution of the dispersion from a to a dot to a . For instance, we find that the crossing point moves systematically away from with deeper , consistent with a line node. In ab initio, we observe a similar evolution for the blue Weyl line (Fig. S12A,B). We can better understand this evolution by considering the constant-energy surfaces for a generic line node (Fig. S12C,D). For above the line node, the slice intersects only the upper cone, giving I. For which cross the line node, we find electron and hole pockets intersecting at a point, as in II. As we continue to move downward the intersection point traces out the line node, shifting from left to right. Comparing to our ARPES spectra, we observe that the photoemission cross-section appears to be dominated by the intersection point for this range of . Lastly, as we scan below the line node, the intersection point completely zips closed the electron pocket and zips open the hole pocket, as in III. A detailed study of the dependence of the constant energy surface in ARPES again suggests a line node in Co2MnGa.
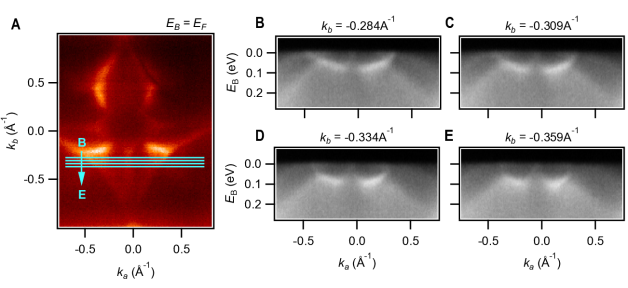
To provide another perspective, we cut parallel to the blue Weyl line (Fig. S13). In contrast to main text Figs. 1,2, here we cut along the Weyl line. Sweeping in , we see the conduction and valence bands approach (Fig. S13A-D), touch each other at fixed along a finite range of (Fig. S13E) and then move apart again (Fig. S13F-I). These parallel cuts again suggest a line node dispersion.
Next, we perform a Lorentzian peak fitting of the blue Weyl line. We begin with the cuts discussed in main text Fig. 2 and we choose the energy distribution curve (EDC) passing through the crossing point (Fig. S14). We fit these EDCs to the following form,
We include two Lorentzian peaks and , where the first peak corresponds to the line node crossing LN, while the second peak corresponds to a deeper valence band VB’ which is useful for improving the fit. We also include the Fermi-Dirac distribution and a constant offset which we interpret as a background spectral weight approximately constant within the energy range of the fit. We find a high-quality fit close to (Fig. S14A-D) using a single LN peak. Away from the crossing point, the peaks are well-described by a linear dispersion, further suggesting a band crossing (Fig. S14C). At , we observe that the fit begins to deviate from the data, and at there is an even more noticeable error (Fig. S14E-H). We speculate that this deviation may arise due to our finite resolution/linewidth as well as the fact that these spectra cut near the extremum of the Weyl line, producing a smeared-out energy gap. Another explanation considers the detailed dispersion of the blue Weyl line, which exhibits a rapid upward dispersion at its extremum (Fig. S10C). Due to broadening along , we may capture LN peaks from a range of , smearing out this rapid dispersion and producing a plateau structure in the EDC. For , we clearly observe two peaks on the EDC, so we fit with an additional Lorentzian (Fig. S14I-J). This gives VB and CB, the peaks corresponding to the conduction and valence bands of the line node. This interpretation is consistent with ab initio, which predicts that the blue Weyl line ends at .
Lastly, we take the results of our peak fitting and compare them with the calculated blue line node dispersion. We plot the LN peak maxima and the standard deviation of the peak positions, Fig. S15. We ignore EDCs at because the plateau shape in the EDC is poorly described by a single Lorentzian, as discussed above. We compare these numerical fitting results with a first-principles calculation of the blue Weyl line dispersion, shifted by eV. We find a reasonable quantitative agreement between the fit and calculated dispersion. Note that there is some expected contribution to the error from the ab initio calculation as well as corrections to the Lorentzian fitting form. These results support our observation of a line node in our ARPES spectra on Co2MnGa.
IV.5 ARPES study of the yellow Weyl line
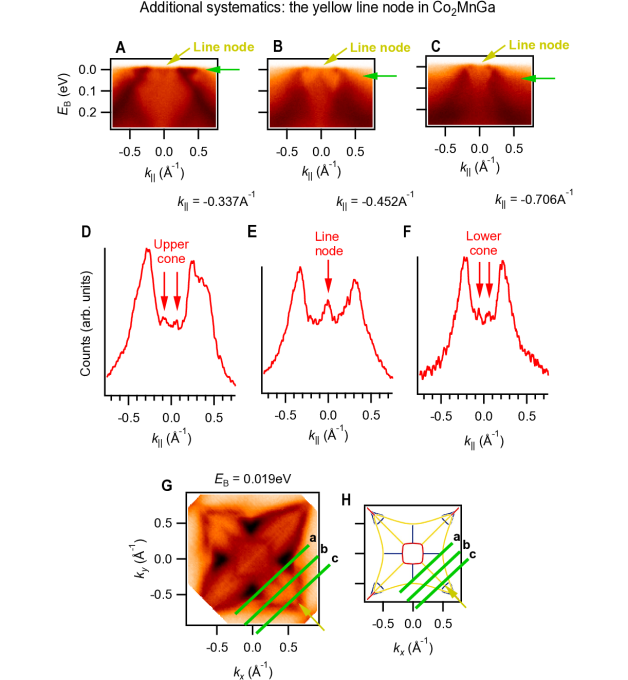
We can also observe signatures of yellow Weyl lines in our ARPES data, at incident photon energy . We can identify a candidate yellow Weyl line by comparing an ARPES constant-energy surface and the projected nodal lines (Fig. S16A, B). We reiterate that there are two different ways in which the yellow Weyl lines can project on the (001) surface. In particular, the four yellow Weyl lines along are “standing up”, so two crossings project onto the same point in the surface Brillouin zone, similar to the blue Weyl line we discussed above. By contrast, the outer yellow Weyl line runs in a single large loop around the entire surface Brillouin zone. It projects “lying down”, with single crossing projections. Here we focus on the double yellow line node. We study constant-energy surfaces at various binding energies (Fig. S16C-E) and we observe the same to switch that we discussed in the case of the blue Weyl line. We see similar behavior on an ab initio constant energy surface (Fig. S16I-K). Note crucially that the electron-to-hole transition occurs in the same direction in the ARPES spectra and calculation, suggesting that the line node dispersion has the same slope in experiment and theory. This provides additional evidence for the yellow Weyl line. Next we search for signatures of the yellow Weyl line on a series of cuts (green lines in Fig. S17G, H). We observe the upper cone near the center of the cut for closest to (Fig. S17A), corresponding to the yellow markers in Fig. S16C. As we slide away from , we observe the band crossing and lower cone (Fig. S17B, C). To pinpoint the cone, we study MDCs through the line node. We observe twin peaks corresponding to the upper and lower cone (S17D,F), as well as a single peak when we cut through the line node (S17E). In this way, we observe signatures of the “double” yellow Weyl line of Co2MnGa in our ARPES spectra.
Lastly, we search for signatures of the other, “single” yellow Weyl line. The outer features in Fig. S17B, C, as well as the large off-center peaks in Fig. S17E, F, correspond well to the predicted locations of the single yellow Weyl line. The valence band further shows a cone shape. However, we note that the conduction band appears to be shifted/offset in momentum relative to the valence band, for instance near the Fermi level at (Fig. S17B). This suggests that we are perhaps observing a surface state or surface resonance which partly traces out the line node. This explanation appears to be consistent with our calculations, compare main text Fig. 3E, which show a similar surface resonance. In summary, we provide evidence for the yellow Weyl lines in our ARPES spectra.
IV.6 ARPES study of the red Weyl line
Having discussed the blue and yellow Weyl lines, we search for ARPES signatures of the red Weyl line. On the constant-energy surfaces, we observe a square feature around (Fig. S18F-H). This corresponds well to the predicted red Weyl line (Fig. S18D). Next, we study a series of cuts passing through the center square feature. We see two clear branches dispersing away from as we approach the Fermi level (red arrows, Fig. S18A-C). We can mark these features on an MDC (Fig. S18E). However, we observe no cone or crossing. We speculate that this may be because the other branch of the Weyl line has low photoemission cross-section under these measurement conditions.
IV.7 Photon energy dependence of the drumhead surface state
We present an extended dataset to accompany main text Fig. 3, showing the drumhead surface states. In main text Fig. 3, we presented an energy distribution curve (EDC) stack cutting through the drumhead surface state at different photon energies. Here we present the full cut for each photon energy included in the stack. We observe the drumhead surface state consistently at all energies (orange arrow, Fig. S19A-I). Additionally, we show an EDC stack at a different momentum, , which cuts not through the drumhead surface state but the yellow line node cone (Fig. S19J) analogous to main text Fig. 3G. When cutting through the candidate drumhead, the EDC stack showed no dispersion in the peak energy as a function of photon energy, indicating no dispersion and suggesting a surface state. Here, by contrast, we can observe that the peak positions shift with photon energy (blue arrows). This shift suggests that the yellow line node lives in the bulk.
IV.8 In-plane dispersion of the drumhead surface state
We briefly study the in-plane dispersion of the drumhead surface states. At eV, with Fermi surface as shown in Fig. S20A, we study a sequence of cuts scanning through the drumhead surface state, Fig. S20B-E. We observe that the surface state disperses slightly downward in energy as we scan away from and that it narrows in , as expected because the line node cones move towards each other as we approach the corner of the Brillouin zone. The dispersion of the candidate drumhead in-plane (but not out-of-plane) is consistent with the behavior of a surface state.
IV.9 ARPES and ab initio study of the minority spin pocket
We briefly noted that Co2MnGa has a large minority spin pocket around the point (Fig. S7). We can omit this pocket from our ARPES measurements by an appropriate choice of photon energy , which then corresponds to a away from . In particular, at eV, main text Fig. 2, we find that we cut near the top of the Brillouin zone (near the point) and far from the point. As a result, we then compare our data with the majority spin bands from ab initio, as in main text Fig. 2E. However, to further compare ARPES and DFT, it is useful to search for this irrelevant pocket in ARPES and better understand why it does not compete with the line node and drumhead states in photoemission. In the DFT bulk projection, the minority spin projects onto a large pocket around , see Fig. S21A-C. Experimentally, we performed a photon energy dependence on a cut passing through . For eV we find that the red Weyl line disappears and a large hole pocket appears near (Fig. S22B-J). This pocket matches well with the minority spin pocket in calculation. This photon energy dependence suggests that the minority spin pocket does not interfere with our measurements of the Weyl lines because at eV we cut near the top of the bulk Brillouin zone in (near the point).