Infostop: Scalable stop-location detection in multi-user mobility data.
Abstract
Data-driven research in mobility has prospered in recent years, providing solutions to real-world challenges including forecasting epidemics and planning transportation. These advancements were facilitated by computational tools enabling the analysis of large-scale data-sets of digital traces. One of the challenges when pre-processing spatial trajectories is the so-called stop location detection, that entails the reduction of raw time series to sequences of destinations where an individual was stationary. The most widely adopted solution was proposed by Hariharan and Toyama (2004) and involves filtering out non-stationary measurements, then applying agglomerative clustering on the stationary points. The state-of-the-art method, however, suffers of two limitations: (i) frequently visited places located very close (such as adjacent buildings) are likely to be merged into a unique location, due to inherent measurement noise, (ii) traces for multiple users can not be analysed simultaneously, thus the definition of destination is not shared across users. In this paper, we describe the Infostop algorithm for stop location detection that overcomes the limitations of the state-of-the-art solution by leveraging the flow-based network community detection algorithm Infomap. We test Infostop for a population of individuals with highly overlapping mobility. We show that the size of locations detected by Infostop saturates for increasing number of users and that time complexity grows slower than for previous solutions. We demonstrate that Infostop can be used to easily infer social meetings. Finally, we provide an open-source implementation of Infostop, written in Python and C++, that has a simple API and can be used both for labeling time-ordered coordinate sequences (GPS or otherwise), and unordered sets of spatial points.
I Introduction
Understanding human mobility is paramount to tackle real-world challenges, from containing epidemics to modelling transportation Barbosa et al. (2018). Since the end of the century, studies on individual and collective human movements were carried out in a broad range of disciplinesBarbosa et al. (2018). Until recently, these analyses relied on data collected from census, surveys and self-reported travel diaries, which suffered from limitations including limited resolution, small sample sizes and reporting biases Barbosa et al. (2018). In the last decade, the introduction and diffusion of mobile phone devices and other positioning technologies have renewed the interest of the scientific community for human mobility. Today, trajectories can be inferred from sources including mobile phone call logs, location based social networks information, and data collected from GPS devices Barbosa et al. (2018). Using data collected by electronics, media and telecommunication companies Blondel et al. (2012) or by running large-scale experimentsStopczynski et al. (2014), scientists can base their studies on large datasets collecting the positions of millions of individuals over months and years, at the resolution of meters and seconds. These novel datasets offer incredible new possibilities, but also call for novel tools.
One of the key challenges related to the pre-processing of digital traces is translating raw sequences of spatial coordinates into comprehensible data. Typically, raw data is a stream of records (id, lat, lon,t), where id is the identifier of a phone or other positioning object, and lat and lon characterize its position in space at time t. Due to inherent measurement noise, lat and lon can fluctuate even when the sensor is perfectly still. In this format, the data is far from being simply understood. In fact, we think of human trajectories as sequences of trips between destinations and stays at destinations. For example, Alice was at home today from to , she then went to the office, where she stayed from to , and then went back home, where she has been from until . Understanding individual trajectory as sequences of stays and trips is the first step necessary to compute relevant metrics that characterize mobility behaviour, including the total distance an individual has travelled, the radius of gyration, or the number of unique locations visited Barbosa et al. (2018).
Several solutions were proposed to transform streams of spatio-temporal records into stays and trips sequences Gong et al. (2015); Cao et al. (2010); Montoliu and Gatica-Perez (2010); Do and Gatica-Perez (2013); Wan and Lin (2013); Zhao et al. (2015). To date, the most adopted solution is the ‘Lachesis Project’ developed by Hariharan and Toyama (2004) Hariharan and Toyama (2004). The algorithm is designed to process one individual trace at the time and it is based on a two-steps procedure. (i) First, it identifies stays as periods when an individual does not stray further than a maximum distance for a minimum duration , where and are parameters. Each stay is described as a tuple (, , , ), such that an individual was stationary between and at the location identified by latitude and longitude . (ii) Then, it uses spatial clustering, with parameter , to cluster the coordinates of all stays, in order to identify destinations. This step attaches a label to each of the stays identified in the previous step. For example, if Alice has two stays, one in the morning and one in the evening, that are located closer than from each other, they will be identified as two stays in the same destination (see Hariharan and Toyama (2004) for more details). In the most widely used formulation of the algorithm, scientists use the DBSCAN clustering algorithm Ester et al. (1996) to perform step (ii) Pappalardo (2019).
The state-of-the-art solution based on DBSCAN suffers of two major limitations. First, if an individual frequently stops at two separate locations that are near each other (e.g. adjacent buildings on a campus), location measurements from all visits should fall into two separate clusters, but due to sampling noise they may overlap. In fact, clustering algorithms that operate in euclidean space, such as DBSCAN Ester et al. (1996) or other agglomerative clustering methods are not well suited for this problem, as clusters that overlap tend to get merged. Second, although it would be possible, in principle, to use DBSCAN to cluster stays of multiple users, DBSCAN is not suitable for multi-user traces, especially when individuals share many destinations. This is again due to the fact that DBSCAN aggregates areas dense in locations into single large locations.
In order to overcome the aforementioned limitations, we introduce the Infostop algorithm for stop-location detection, described in section II. Infostop is a two-step algorithm: the first step corresponds to step (i) of the Hariharan and Toyama algorithm, the second step leverages the Infomap clustering algorithm for networks to allow for the the detection of overlapping clusters and provide fast and scalable multi-user stop-location detection.
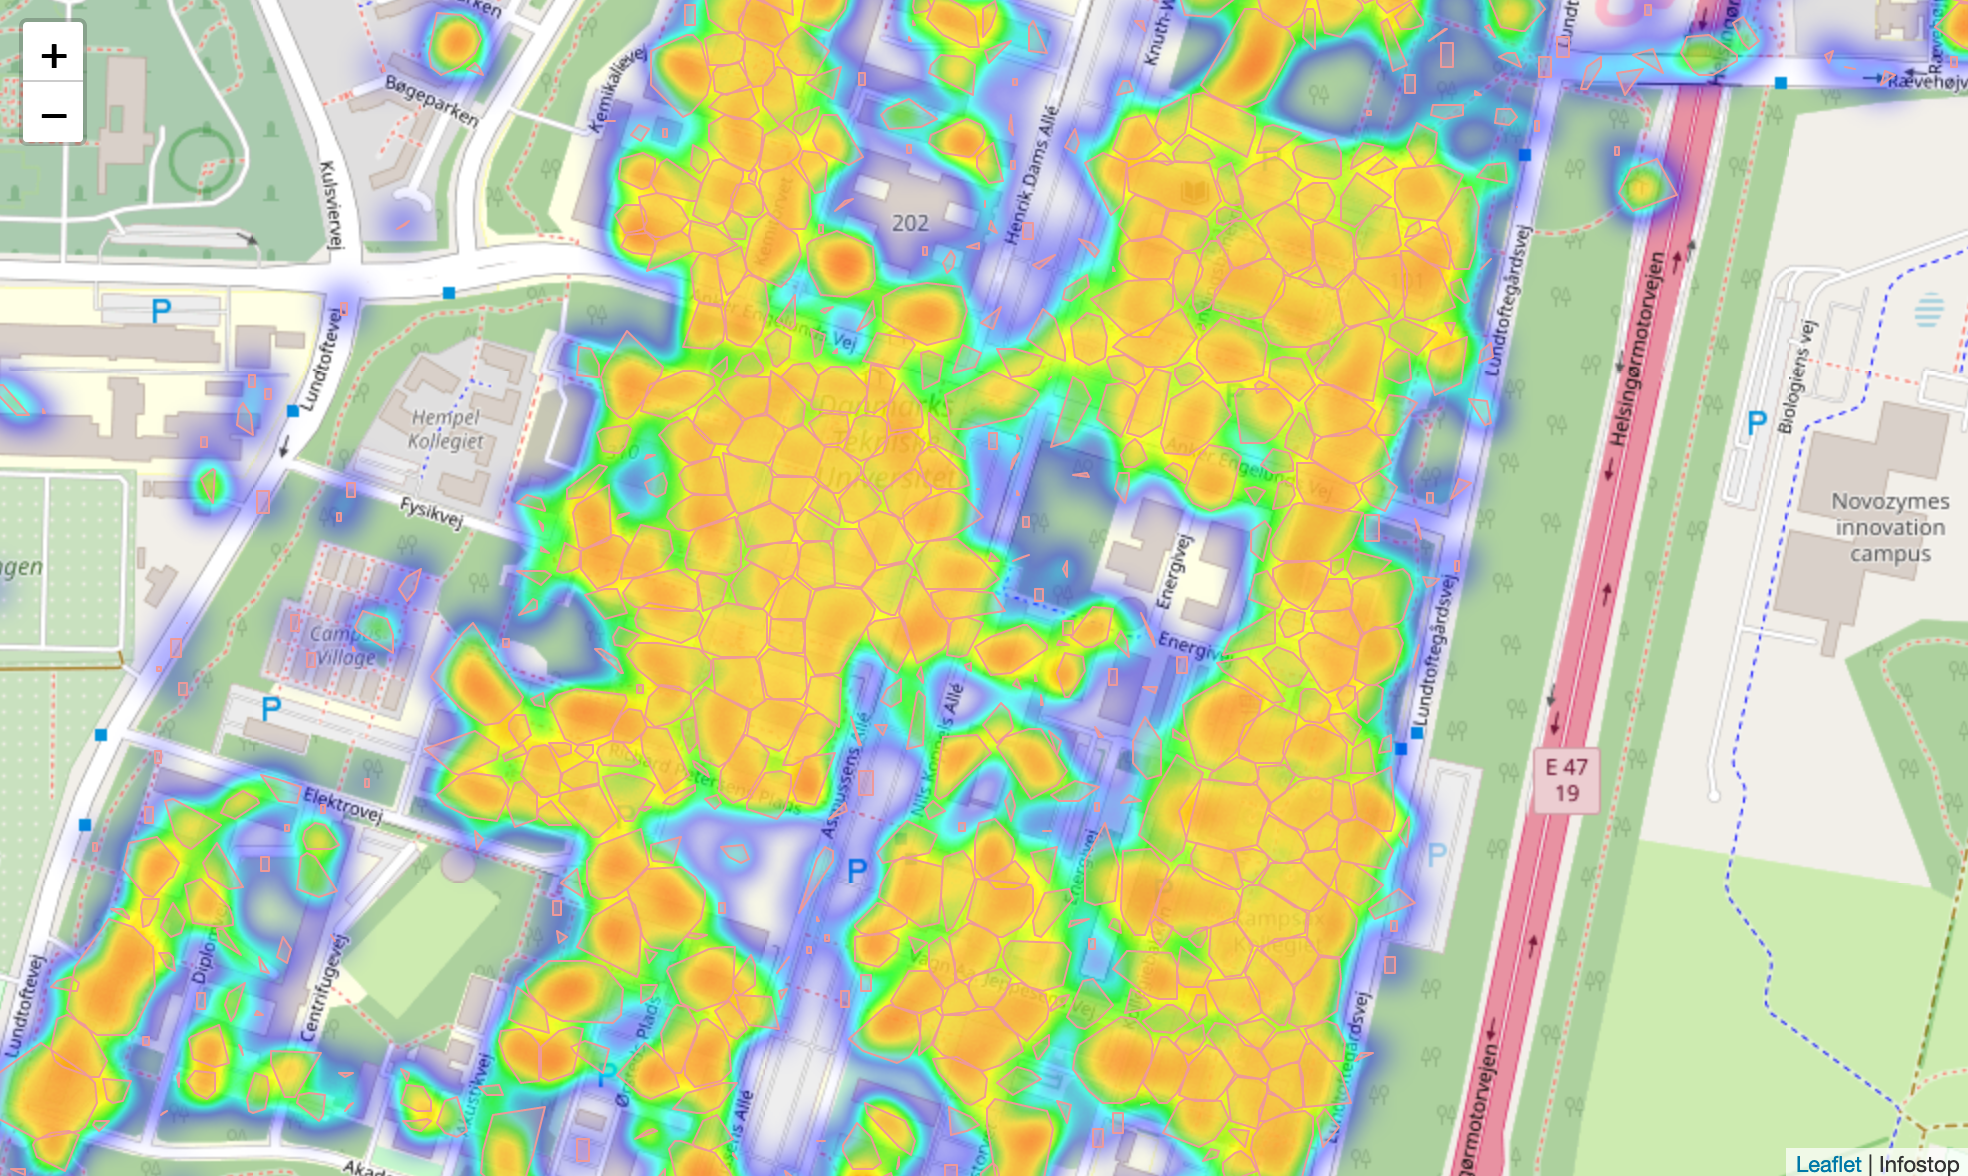
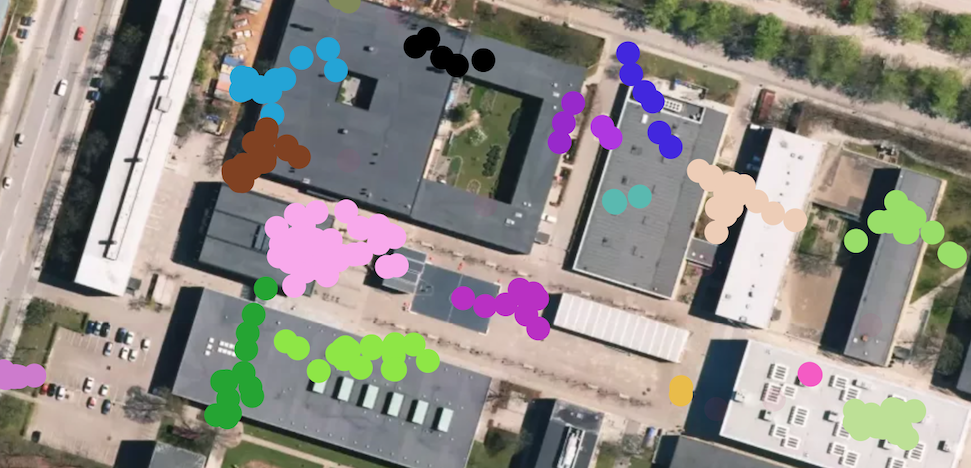
In section III, we show that Infostop allows the identification of compact locations for large dataset of individuals with largely overlapping destinations (see Fig. 1 and 2), and, in this respect, it performs better than state-of-the-art methods (see Fig. 4). We find that multi-user solutions are comparable to individual-user solutions (see Fig. 3). We demonstrate that Infostop has lower time complexity than the state-of-the-art (see Fig. 5). We show that Infostop can be used to identify social contacts. In section IV, we present a fast and flexible open-source implementation of Infostop available in Python.
II The Infostop Algorithm
Infostop detects stop-locations from raw sequences of spatio-temporal data. Like the method in Hariharan and Toyama (2004), Infostop works in two-steps. First, it identifies stays, and then destinations.
The algorithm takes the following input.
Data. A collection of sequences of records. Each sequence describes the movement of a different individual , and consists of records , where is time, and are coordinates in a two-dimensional space. Note that sequences are ordered by time and each of them can have a different length.
Parameters.
-
•
, the maximum roaming distance allowed for two points within the same stay.
-
•
, the minimum duration of a stay.
-
•
, the maximum time difference between two consecutive records for them to be considered within the same stay.
-
•
, the typical distance between two stays in the same destination.
The algorithm works in two steps. In step (i), Infostop identifies stays and trips, for each of the trajectories in the collection , and assigns to each record a label in {trip, stay}. Here, Infostop follows closely the method developed by Hariharan and Toyama (2004). For more details on the implementation of step (i), the reader can refer to the code in 111https://github.com/ulfaslak/infostop/blob/master/cpputils/main.cpp.
In step (ii), points are clustered using Infomap. First, we build a network, where nodes correspond to stays (as identified by step (i)), and a link exists between two nodes if they are located at distance smaller than . Note that we include in the network stays deriving from all the individual trajectories. Then, we find communities of nodes using the Infomap algorithm Rosvall et al. (2009). These communities identify destinations, in a definition that is shared across individuals. For more details on the implementation of step (ii), the reader can refer to the code in222https://github.com/ulfaslak/infostop/blob/master/infostop/utils.py.
Thus, for each sequence of records in the input, Infostop returns a sequence of labels with corresponding length. Records identified as trips are assigned label , while records that are identified as stays are assigned a positive integer, identifying the corresponding destination.
III Results
We test the algorithm on the trajectories of students at the Technical University of Denmark that were part of the same study program and thus have largely overlapping mobility trajectories Stopczynski et al. (2014). Data was collected as part of an experiment that took place between September and September . Participants’ position over time was estimated from a combination GPS and WiFi information, resulting in samples every minutes. The location estimation error was below m in of the cases.
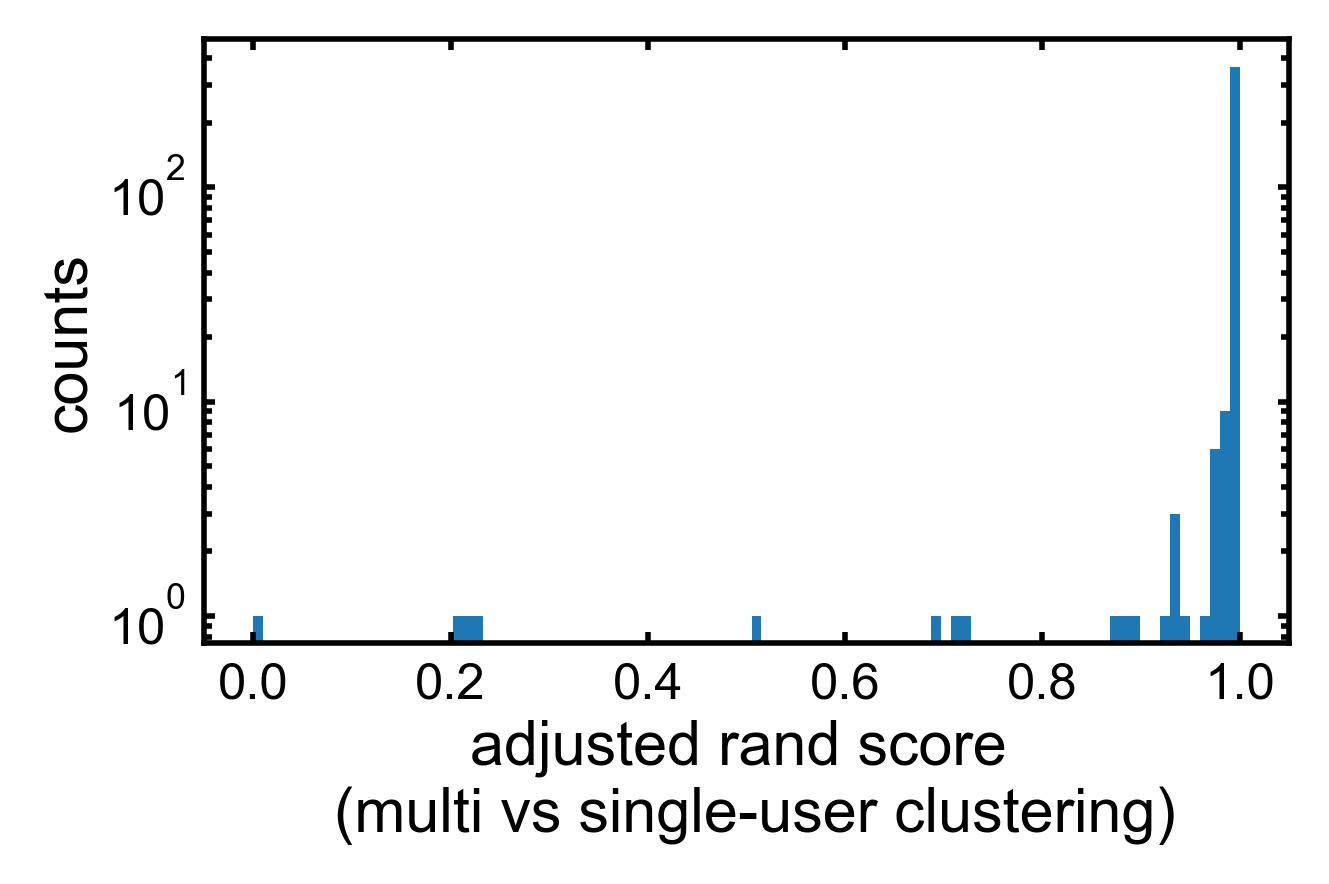
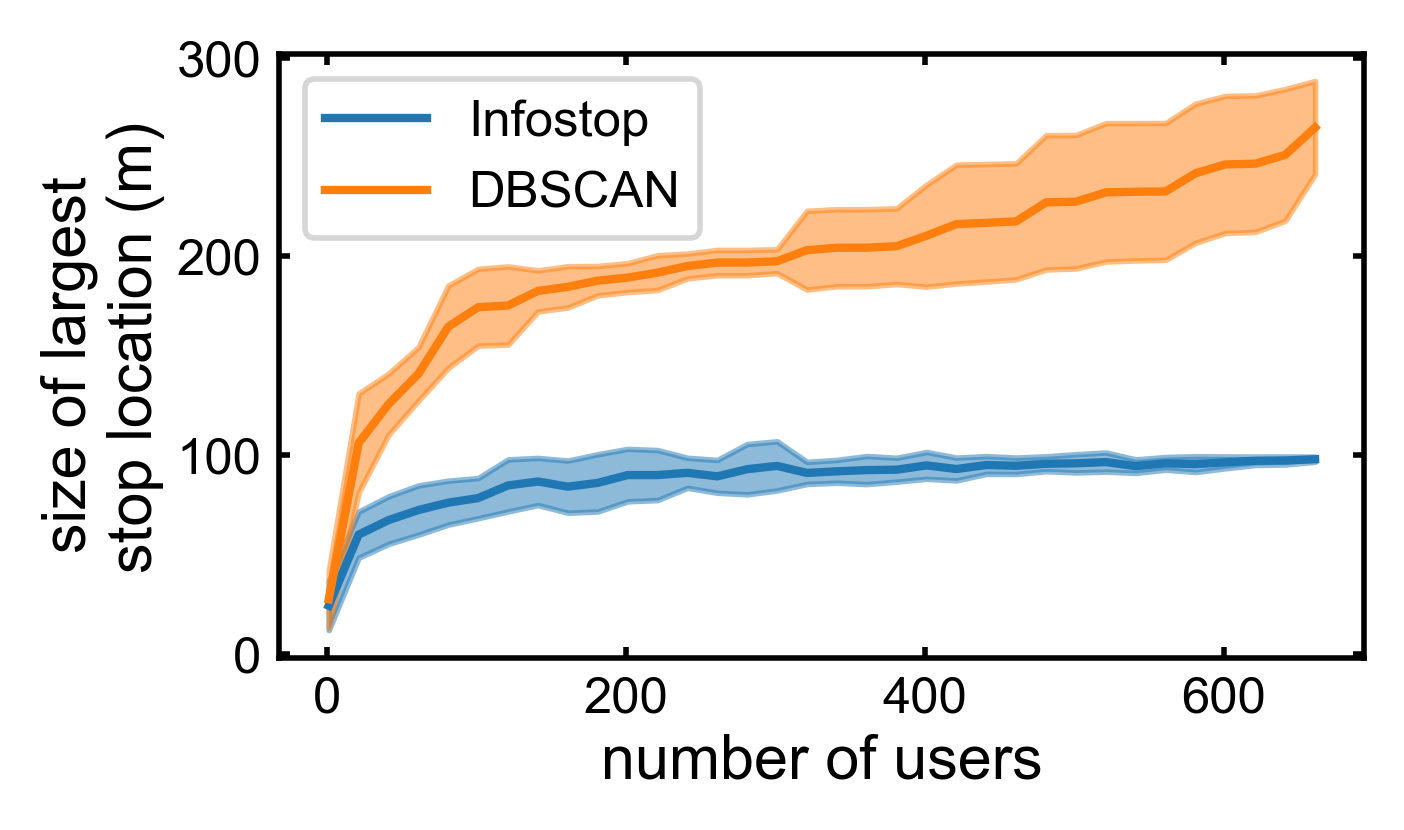
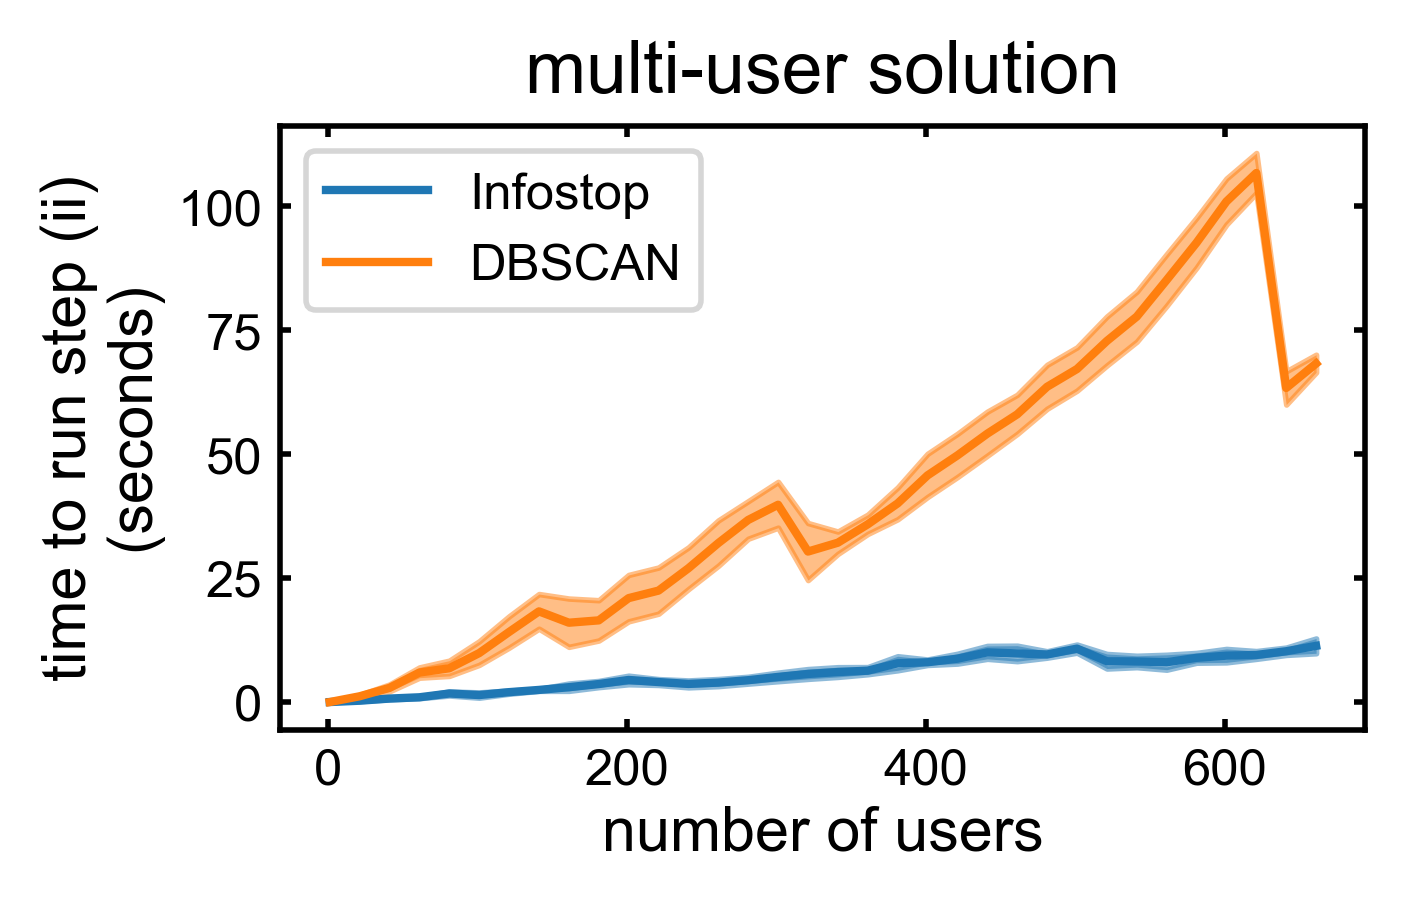
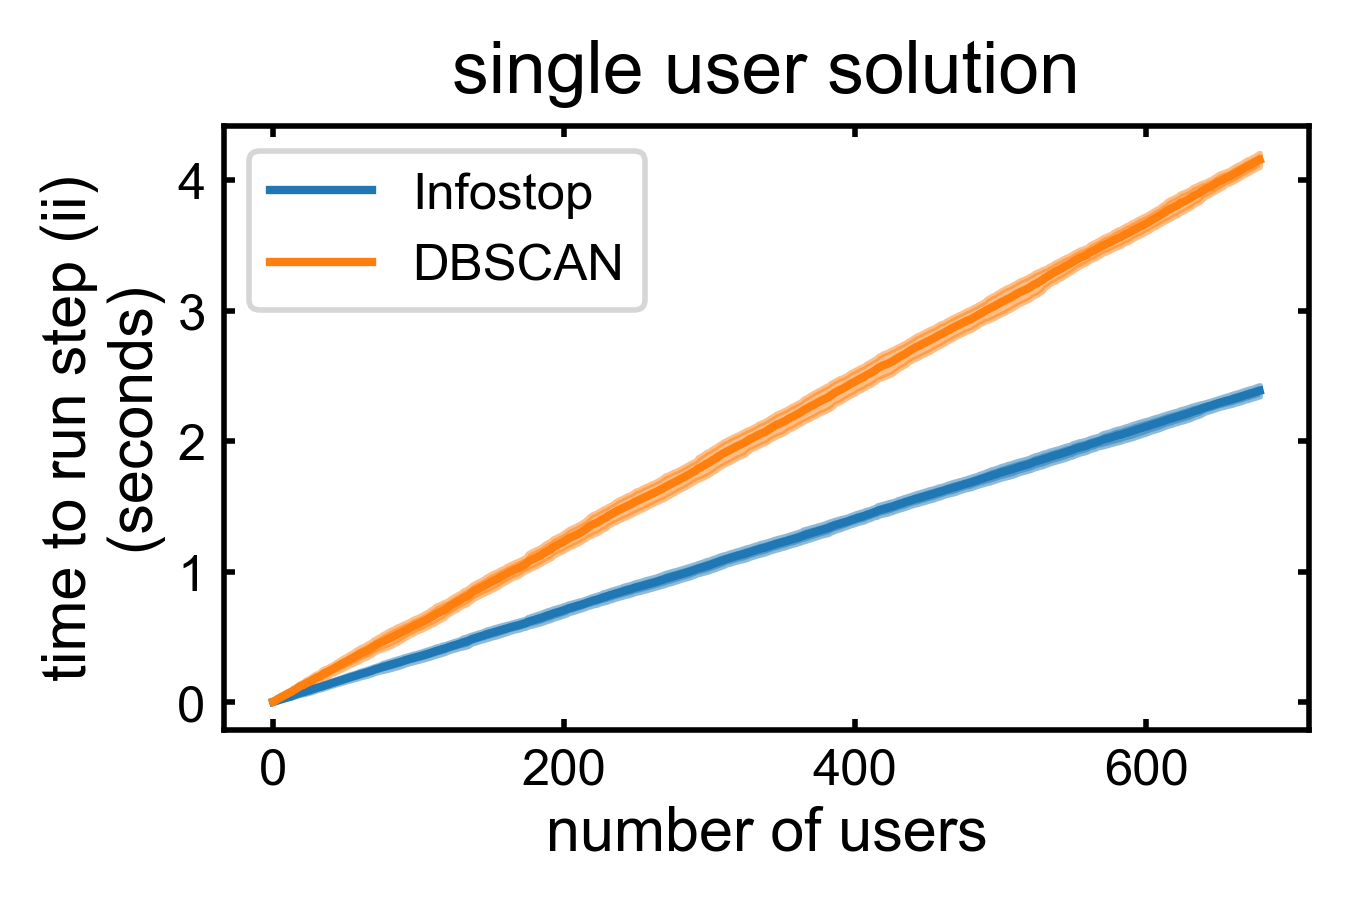
First, we test the accuracy of the multi-user version of Infostop, by comparing the labels obtained by runnning stop-detection for each user separately vs for all users simultaneously. We find that the median value of the adjusted rand index Steinley (2004) between the two solutions is equal to one, revealing that the single-user and multi-user solutions are almost identical (see Fig. 3). Then, we assess the quality of the Infostop solution, by measuring the size of the largest destination (maximum distance between any two points with the same destination label) as a function of the number of users included in the dataset. We find that, for a choice of , the quantity saturate at , while the solution of DBSCAN, run with the same distance parameter, diverges. Then, we measure the time it takes to run step (ii) of the stop-location detection algorithm using Infomap or DBSCAN on the same machine. We use the Python wrapper for Infomap by Daniel Edler, Anton Eriksson and Martin Rosvall 333https://mapequation.github.io/infomap/python/, and the the scikit-learn Python implementation Pedregosa et al. (2011) of DBSCAN with parameters n_jobs=1, metric=haversine, leaf_size=40, algorithm=ball_tree. We find that Infomap runs faster compared to DBSCAN (see Fig. 5).
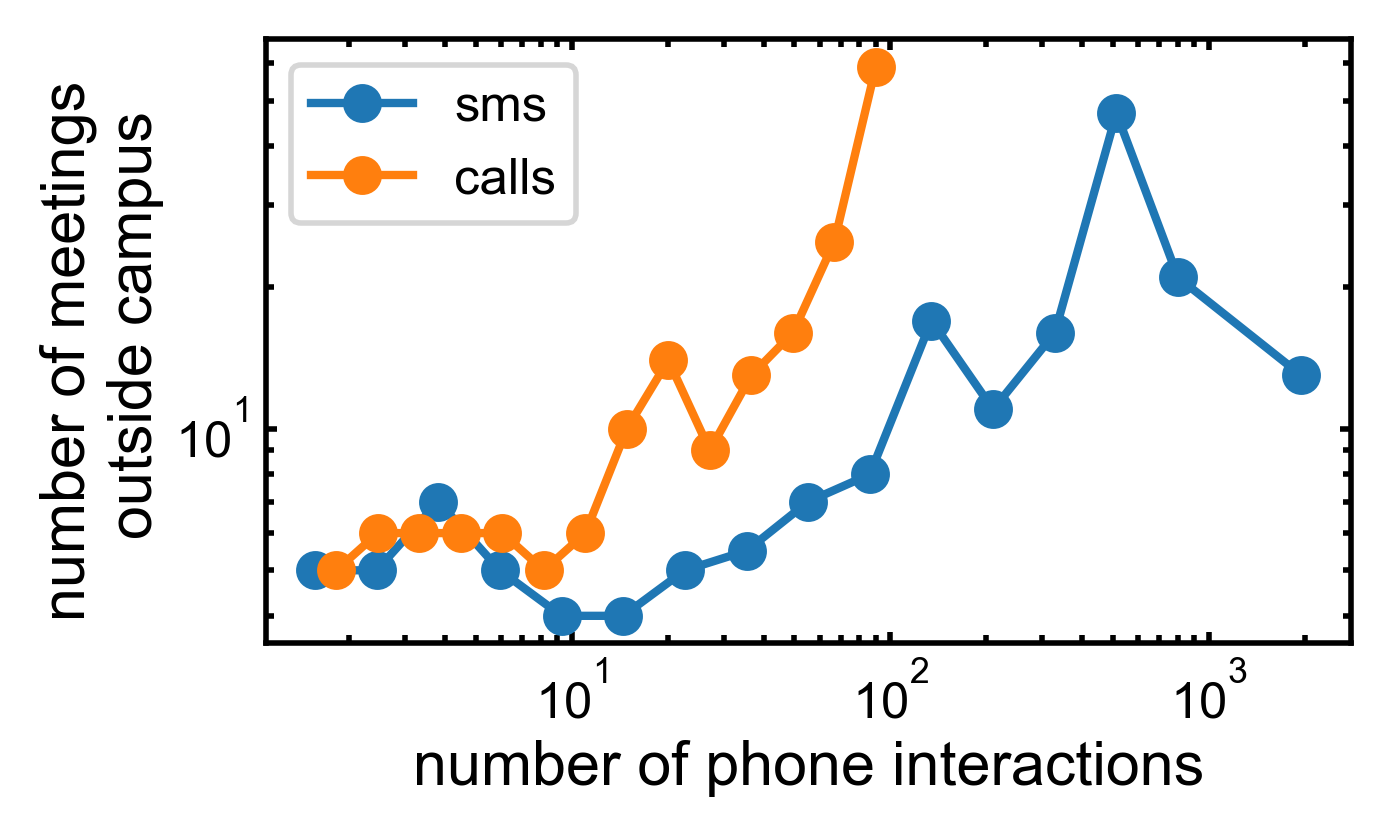
Finally, we use the outcome of the algorithm to identify social contacts between individuals. Since Infostop identifies shared destinations across users, it makes it fast to identify situations when users spent simultaneously time in the same destination. We find that the number of such instances, after removing meetings occurring in the DTU campus, correlates positively with the number of calls and sms exchanged by two individuals (see Fig. 6).
IV Open Source Implementation
We developed an implementation of Infostop in C++ and Python. The code is open-sorce, it is wrapped in Python, and can be installed using pip. The package is located at
https://github.com/ulfaslak/infostop.
The Infostop package implements two models as separate classes.
-
1.
Infostop: Infer stop-location labels from mobility traces. An instance of the class is initialised using the parameters , , , described in Section II. The main method of the class is fit_predict, which takes as input a collection of trajectories and returns the label associated to each record. The method works in multiple steps: (a) Temporal downsampling: detect stationary points and store the median coordinates of each of them. (b) Spatial downsampling: remove duplicate coordinates, optionally with prior downsampling to total lower number of points to be clustered. (c) Using a ball tree algorithm, identify stationary events that are closer than and (d) constructs a network of stationary events (where a link exists between two nodes if the are closer than ), and cluster the network with the Infomap algorithm. (e) Reverse spatial downsampling. (f) Reverse temporal downsampling: assign a label to each stay using the partition returned by Infomap, and map labels back onto the input sequence. Non-stationary points are assigned label -1, stationary ones are assigned a positive integer corresponding to a destination.
-
2.
SpatialInfostop: Cluster a collection of points using Infomap. An instance of the class is initialised with the parameter described in Section II. The main method of the class is fit_predict, which allows to cluster a collection of spatial points. The method entails points (b-e) described above.
The package, furthermore, contains postprocessing utilities, that allow users to inspect various aspects of their solution, among these a visualization component that can visualize recovered destinations as convex hulls on top of a map, optionally with stay-points scattered or heatmapped (see Fig. 1).
Our implementation of Infostop is highly flexible. The default distance metric is the haversine distance, thus expecting the input location measurements to be coordinates. However, the user can specify another distance function. As such, Infostop can be used as a general clustering algorithm in any space that allows distance measurement between points. The input data can be either in the form of one or multiple sequences of records, thus allowing usage for both single-user or multi-user datasets. Input sequences can include the timestamp associated to each record or not. Thus, it allows to use data sampled evenly or unevenly in time.
Infostop is very performant. The temporal downsampling step, which entails iterating over the entire input sequence and computing running medians, is implemented in a C++ submodule for speed. Moreover, Infomap is itself a C++ library. Further speedups can be achieved by specifying a min_spacial_resolution, i.e. a lower bound on the spatial resolution. These speedups alone make multi-user stop-detection at the scale presented here feasible.
V Conclusion
We have developed Infostop, an algorithm for stop-location detection that overcomes some of the limitations of the state-of-the-art stop-location detection algorithms, including that (i) frequently visited places located very close are likely to be merged into a unique location, due to inherent measurement noise, (ii) traces for multiple users can not be analysed simultaneously. We have shown that Infostop allows to identify shared stop-locations across a large population of individuals sharing several common locations. The outcome of the algorithm is more desirable than the output obtained using previous solutions, since locations maintain compact size. We showed that Infostop can be used to easily identify social contacts, or occasions when individuals spent simultaneously time in the same location. Furthermore, we have developed a fast implementation in C++ and Python, that is available open-source. The current implementation is highly flexible and faster, to our knowledge, than other open-source stop-location detection algorithms implementations.
References
- Barbosa et al. (2018) H. Barbosa, M. Barthelemy, G. Ghoshal, C. R. James, M. Lenormand, T. Louail, R. Menezes, J. J. Ramasco, F. Simini, and M. Tomasini, Physics Reports 734, 1 (2018).
- Blondel et al. (2012) V. D. Blondel, M. Esch, C. Chan, F. Clérot, P. Deville, E. Huens, F. Morlot, Z. Smoreda, and C. Ziemlicki, arXiv preprint arXiv:1210.0137 (2012).
- Stopczynski et al. (2014) A. Stopczynski, V. Sekara, P. Sapiezynski, A. Cuttone, M. M. Madsen, J. E. Larsen, and S. Lehmann, PloS one 9, e95978 (2014).
- Gong et al. (2015) L. Gong, H. Sato, T. Yamamoto, T. Miwa, and T. Morikawa, Journal of Modern Transportation 23, 202 (2015).
- Cao et al. (2010) X. Cao, G. Cong, and C. S. Jensen, Proc. VLDB Endow. 3, 1009 (2010).
- Montoliu and Gatica-Perez (2010) R. Montoliu and D. Gatica-Perez, in Proceedings of the 9th International Conference on Mobile and Ubiquitous Multimedia (ACM, 2010) p. 12.
- Do and Gatica-Perez (2013) T. M. T. Do and D. Gatica-Perez, IEEE Transactions on Mobile Computing 13, 638 (2013).
- Wan and Lin (2013) N. Wan and G. Lin, Computers, Environment and Urban Systems 39, 63 (2013).
- Zhao et al. (2015) F. Zhao, A. Ghorpade, F. C. Pereira, C. Zegras, and M. Ben-Akiva, Transportation research procedia 11, 218 (2015).
- Hariharan and Toyama (2004) R. Hariharan and K. Toyama, in International Conference on Geographic Information Science (Springer, 2004) pp. 106–124.
- Ester et al. (1996) M. Ester, H.-P. Kriegel, J. Sander, X. Xu, et al., in Kdd, Vol. 96 (1996) pp. 226–231.
- Pappalardo (2019) L. Pappalardo, arXiv preprint arXiv:1907.07062 (2019).
- Note (1) https://github.com/ulfaslak/infostop/blob/master/cpputils/main.cpp.
- Rosvall et al. (2009) M. Rosvall, D. Axelsson, and C. T. Bergstrom, The European Physical Journal Special Topics 178, 13 (2009).
- Note (2) https://github.com/ulfaslak/infostop/blob/master/infostop/utils.py.
- Steinley (2004) D. Steinley, Psychological methods 9, 386 (2004).
- Note (3) https://mapequation.github.io/infomap/python/.
- Pedregosa et al. (2011) F. Pedregosa, G. Varoquaux, A. Gramfort, V. Michel, B. Thirion, O. Grisel, M. Blondel, P. Prettenhofer, R. Weiss, V. Dubourg, J. Vanderplas, A. Passos, D. Cournapeau, M. Brucher, M. Perrot, and E. Duchesnay, Journal of Machine Learning Research 12, 2825 (2011).