Vol.0 (20xx) No.0, 000–000
22institutetext: Faculty of Applied Sciences, Ton Duc Thang University, Ho Chi Minh City, Vietnam
33institutetext: Saint Petersburg State University, Department of Astrophysics, St. Petersburg, 198504 Russia
44institutetext: Special Astrophysical Observatory, Russian Academy of Sciences, Nizhnii Arkhyz, 369167 Russia
\vs\noReceived 20xx month day; accepted 20xx month day
Investigation of the parameters of spiral pattern in galaxies: the arm width
Abstract
In this work we determine the parameters of spiral structure for a sample of face-on spiral galaxies. In practice, the solution of this problem is a hard task because of the diversity of the observed characteristics of spiral structure, such as the arm number, their shape, arm contrast etc. In this work we study spiral structure in galaxies based on an analysis of photometric cuts perpendicular to the arm direction. The method is based on an approximation of these slices with an analytical function and derivation of the parameters of spiral structure (arm width, asymmetry, pitch angle) using the fitted parameters of this approximation. The algorithm has been applied to a sample of 155 galaxies selected from the Sloan Digital Sky Survey in different passbands. In this paper we only consider the results on the arm width: most spirals show an increase of their width with galactocentric distance. Only 14 per cent of galaxies in our sample show an opposite trend or have an almost constant arm width at all radii.
keywords:
methods: data analysis — techniques: photometric — galaxies: structure1 Introduction
Spiral galaxies are ubiquitous in the Local Universe (Conselice 2006). The fact that we observe a prominent spiral structure in so many disc galaxies should be explained. If all the spirals were material, they would be tightly wound up by the differential rotation of the disc and decay after several galactic years which contradicts our observations (the so-called winding problem). Other proposed mechanisms to explain this phenomenon, however, are still under debate (see the review by Dobbs & Baba 2014). Numerical simulations support the dynamical spirals which are swing amplified by the differential rotation of the disc (see e.g. Julian & Toomre 1966; Gerola & Seiden 1978). An alternative approach is the quasi-stationary wave theory which explains the existence of grand-design galaxies with two distinct spiral arms very well (Lin & Shu 1964; Bertin et al. 1989). In addition to that, spirals can be induced by tidal interactions (Toomre 1969; Toomre & Toomre 1972) or be bar-driven (Kaufmann & Contopoulos 1996; Harsoula & Kalapotharakos 2009). It is also believed, that different mechanisms can be dominant under different circumstances. Despite the long history of the research of spiral structure in galaxies, the problem of its formation seems far from being solved as many collected observational facts cannot give us a certain answer on the question of what is the dominant mechanism among all these alternatives to form spiral arms in galaxies.
In this brief paper, we investigate the width of spiral structure in the optical, in the framework of our project aimed at studying spiral structure in galaxies in a wide range of wavelengths (Savchenko et al. 2020). To our surprise, this kind of study was done only for several galaxies (Honig & Reid 2015) and our own Milky Way (Reid et al. 2014), but based on the positions of Hii regions and masers. Except for these two studies, we found no other papers where the width of spiral arms would be considered as a parameter which characterises spiral structure in galaxies. We decided to fill in this gap and initiated a detailed study of spiral structure in galaxies. In this paper we will only consider results on the arm width.
2 Sample and Data
Our sample is described in detail in Savchenko et al. (2020). To create a sample of spiral galaxies, we used the EFIGI (Baillard et al. 2011) and GalaxyZoo (Lintott et al. 2008) samples. From these samples we initially selected rather large spiral galaxies with the optical diameter ” (at the isophote 25 mag arcsec-2 in the band calculated from the parameter from HyperLeda, Makarov et al. 2014). These galaxies were inspected by eye several times to exclude interacting and highly-inclined galaxies. Also, we rejected galaxies with a quite unclear, too flocculent spiral structure where no individual spirals arm can be traced well. Our final sample consists of 155 galaxies of Sa–Sd types. The average distance to the sample galaxies is Mpc.
In our study we use the three bands from the the Sloan Digital Sky Survey; the images were taken from the DR13 (Albareti et al. 2017). All the images were reduced for the purposes of this study: sky-subtracted, cropped, and de-projected. The de-projection was done using the measured position angles and flattenings of the outermost galaxy isophotes which were estimated from isophote fitting. We also subtracted the azimuthally averaged profiles from the real images to suppress the axisymmetric components of the galaxy and to enhance the contrast of the spiral structure. Finally, we extracted a point spread function (PSF) image for each galaxy frame.
3 Data Analysis
We give details of our data analysis in Savchenko et al. (2020). For each galaxy we marked at least one spiral arm, which can be traced in the de-projected residual image we created in Sect. 2. We trace the arm from the ends of a bar or beyond a bulge, if these components are present in the galaxy, to the galaxy outskirts at outermost galaxy isophotes. Each spiral arm was traced using ‘circle’ regions from the ds9 program111http://ds9.si.edu/site/Home.html: these regions were placed manually along the central line of the arm, estimated approximately by eye, with a circle radius extending till the middle of the inter-arm space on either side of the arm inwards and outwards. Then a special algorithm was used to make a set of slices perpendicular to the arm in a number of points with a length of each slice to be equal to the diameter of the circle regions (see Fig. 2). Then we fit each slice with an asymmetric Gaussian function of distance from the galaxy center with four free parameters, the central flux , the peak location , and the two half-widths and (see Fig. 2):
| (1) |
The full width of the arm at a certain point can be calculated as . During the fitting, we convolve the model of the asymmetric gaussian with the created PSF to take into account the image smearing by the atmosphere and optics. When the fitting is done for each slice, we have a measurement of the arm width at a number of points along the arm.
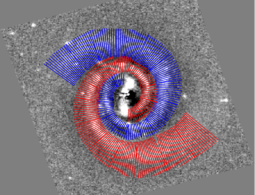
structure of PGC 2182. Different colours show slices
made for different arms.
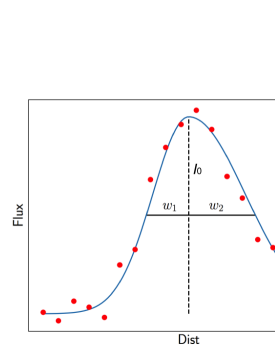
and its fit by an asymmetric gaussian function. The red
dots are data points, the solid line is a best fit.
4 Results
Obviously, from this fitting we can estimate many other parameters of the spiral structure (and in the other passbands), as, for example, the pitch angle and its variation along the radius, the fraction of the spiral arm to the total galaxy luminosity, and arm colours. Studying these important parameters of the spiral structure is beyond the scope of this paper. We present all the results in Savchenko et al. (2020).
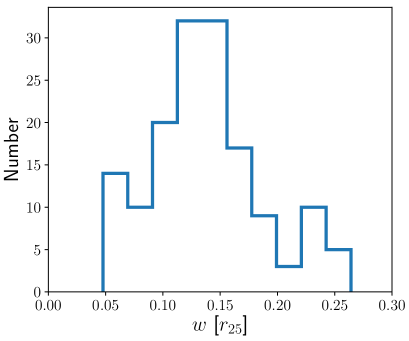
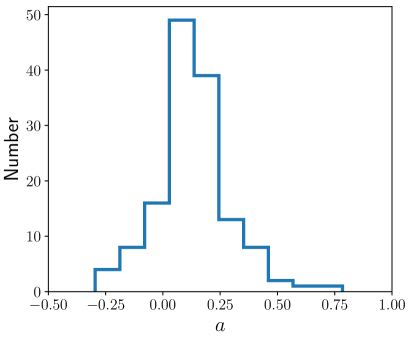
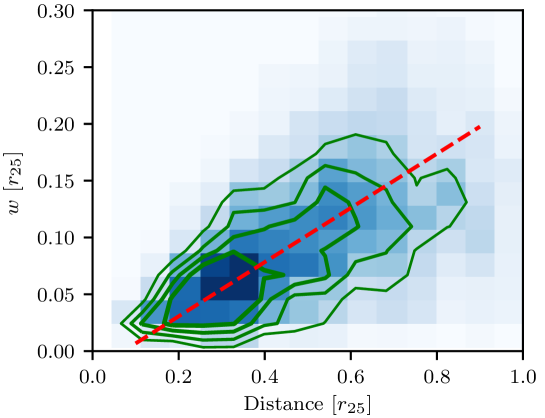
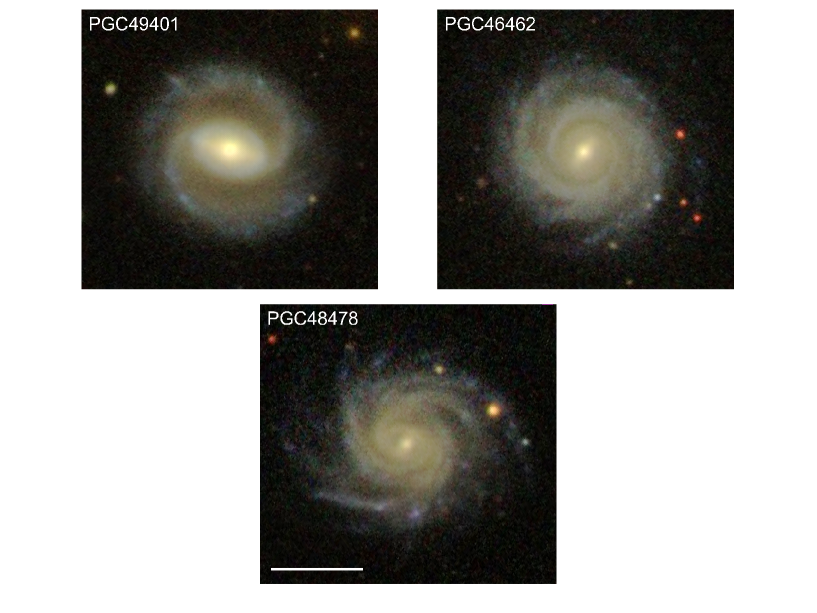
In Fig. 4 we show the distribution of the mean arm width for the sample galaxies. The averaging was done 1) along the radius for each arm, and 2) for all arms in a galaxy. The mean arm width for the whole sample is in units of 25-th isophote radius in the band. Most importantly, we can study how the arm width changes with radius in each galaxy. To quantify the radial variation of the spirals, we fit a linear regression into the radius–width relation, and see the slope of the linear fit. The distribution of our sample galaxies by the slope value is shown in Fig. 4. From this figure we can clearly see that for most galaxies (86 per cent) in our sample the arm width increases with galactocentric distance (they have positive values of ). Galaxies from Honig & Reid (2015) demonstrate the width slope values ranging from to , which all lie within the central histogram peak in Fig. 4. Fig. 5 shows the radius–width relation for all arms of all galaxies of our sample as a density map with a fit by a linear function for the whole sample, where the slope was found to be equal to 0.24, and the intercept . However, there is some number of galaxies in our sample, which show almost constant or even narrower arm width at larger radii. In Fig. 6, we show snapshots for three example galaxies in our sample, which exhibit different behaviour of the arm width with radius.
Our results agree well with the results from (Reid et al. 2014; Honig & Reid 2015): in most sample galaxies we observe that the arm width grows with radius. The swing amplification theory can explain this behaviour (Toomre 1981; Honig & Reid 2015), whereas for the other theories (see Sect. 1) this should be studied. The question on why some galaxies do not show an increase of the arm width should be investigated thoroughly in a subsequent study. Here we can only speculate that this can be related to a reduced star formation (truncation of the Hi profile) at the periphery of these galaxies.
sample galaxies.
between the local arm width and galactocentric distance.
5 Conclusions
We have studied a sample of face-on non-interacting spiral galaxies in order to retrieve the parameters of their spiral structure. One of the advantages of this work is that we studied the arm width as one of the important parameters of spiral structure. Using a specially developed method for fitting the spiral arms in galaxies, we were able to measure the arm width and its change with radius. We found that most spirals in our sample (86 per cent) show a growing arm width with radius. This is in line with the physical essence of the swing amplification mechanism for explaining the phenomenon of the spiral structure in galaxies. In our next studies we are about to study the other retrieved parameters of the spiral structure in great detail and link them to different proposed models for generating spiral structure in galaxies.
Acknowledgements.
The work was supported by the RFBR grant 18-32-00194. Funding for the SDSS has been provided by the Alfred P. Sloan Foundation, the Participating Institutions, the National Science Foundation, the US Department of Energy, the National Aeronautics and Space Administration, the Japanese Monbukagakusho, the Max Planck Society, and the Higher Education Funding Council for England. The SDSS Web Site is http://www.sdss.org/. This research makes use of the NASA/IPAC Extragalactic Database (NED) which is operated by the Jet Propulsion Laboratory, California Institute of Technology, under contract with the National Aeronautics and Space Administration, and the LEDA database (http://leda.univ-lyon1.fr).References
- Albareti et al. (2017) Albareti, F. D., Allende Prieto, C., Almeida, A., et al. 2017, ApJS, 233, 25
- Baillard et al. (2011) Baillard, A., Bertin, E., de Lapparent, V., et al. 2011, A&A, 532, A74
- Bertin et al. (1989) Bertin, G., Lin, C. C., Lowe, S. A., & Thurstans, R. P. 1989, ApJ, 338, 78
- Conselice (2006) Conselice, C. J. 2006, MNRAS, 373, 1389
- Dobbs & Baba (2014) Dobbs, C., & Baba, J. 2014, PASA, 31, e035
- Gerola & Seiden (1978) Gerola, H., & Seiden, P. E. 1978, ApJ, 223, 129
- Harsoula & Kalapotharakos (2009) Harsoula, M., & Kalapotharakos, C. 2009, MNRAS, 394, 1605
- Honig & Reid (2015) Honig, Z. N., & Reid, M. J. 2015, ApJ, 800, 53
- Julian & Toomre (1966) Julian, W. H., & Toomre, A. 1966, ApJ, 146, 810
- Kaufmann & Contopoulos (1996) Kaufmann, D. E., & Contopoulos, G. 1996, A&A, 309, 381
- Lin & Shu (1964) Lin, C. C., & Shu, F. H. 1964, ApJ, 140, 646
- Lintott et al. (2008) Lintott, C. J., Schawinski, K., Slosar, A., et al. 2008, MNRAS, 389, 1179
- Makarov et al. (2014) Makarov, D., Prugniel, P., Terekhova, N., Courtois, H., & Vauglin, I. 2014, A&A, 570, A13
- Reid et al. (2014) Reid, M. J., Menten, K. M., Brunthaler, A., et al. 2014, ApJ, 783, 130
- Savchenko et al. (2020) Savchenko, S., Marchuk, A., Mosenkov, A., & Grishunin, K. 2020, arXiv e-prints, arXiv:2001.09110
- Toomre (1969) Toomre, A. 1969, ApJ, 158, 899
- Toomre (1981) Toomre, A. 1981, in Structure and Evolution of Normal Galaxies, ed. S. M. Fall & D. Lynden-Bell, 111
- Toomre & Toomre (1972) Toomre, A., & Toomre, J. 1972, ApJ, 178, 623