Deep semantic gaze embedding and scanpath comparison for expertise classification during OPT viewing
Abstract.
Modeling eye movement indicative of expertise behavior is decisive in user evaluation. However, it is indisputable that task semantics affect gaze behavior. We present a novel approach to gaze scanpath comparison that incorporates convolutional neural networks (CNN) to process scene information at the fixation level. Image patches linked to respective fixations are used as input for a CNN and the resulting feature vectors provide the temporal and spatial gaze information necessary for scanpath similarity comparison. We evaluated our proposed approach on gaze data from expert and novice dentists interpreting dental radiographs using a local alignment similarity score. Our approach was capable of distinguishing experts from novices with 93% accuracy while incorporating the image semantics. Moreover, our scanpath comparison using image patch features has the potential to incorporate task semantics from a variety of tasks.
1. Introduction
Through eye movements, our thoughts, motivations, and expertise can be distinguished. We can accurately classify what someone is looking at and, more important, in what context they are looking at it, simply from the patterns in our gaze behavior. Eye-tracking data is, however, still subject to large intra- and inter-individual variance. Neither two subjects are likely to look at a given stimulus in an identical way, nor is the same person likely to exhibit the identical gaze sequence when looking at the same stimulus twice. This variability becomes non-trivial when developing online systems that can recognize specific groups: e.g., distinguish experts from novices or doing performance prediction.
We measure these distinct gaze patterns as a scanpath: Areas of focus (fixations) where the eye behavior remains relatively still before moving to another area via a rapid eye movement (saccade) (Holmqvist et al., 2011). Discriminating scanpaths necessitates effective ways of aggregating and averaging gaze data over multiple trials to achieve converging summarizations of representative scanpaths (e.g. attention density maps (Le Meur and Baccino, 2013)).
Such aggregation techniques are simple to implement as long as subjects view the same stimulus from the same perspective, e.g., an image on a computer screen. Although, when either aggregation over a range of different stimuli or dynamic stimuli is required, analysis becomes challenging. For instance, semantically identical regions – also known as areas of interest (AOIs) – with regard to the studied task have to be identified and annotated. Once annotated, the sequence of AOIs visited by gaze can be analyzed as a proxy representation of the scanpath.
However, even though it is apparent that task and subject differences affect scanpaths, often accurate prediction is still elusive. Greene et al. (Greene et al., 2012) failed to predict an observers’ task from their gaze behavior using sequence information from manually defined AOIs. Additionally, when aggregating the scanpath data, (Borji and Itti, 2014) found they still could not accurately classify the task. Prediction increased in (Kanan et al., 2014) when considering the scanpath as a collection of features representing a fixations position and duration. Finally, the largest improvement in prediction performance was found when training an HMM model per stimulus (Haji-Abolhassani and Clark, 2014). Although it was accurate and incorporated spatial information, it has constrained applicability across stimuli.
In order to apply task or subject prediction from scanpath information, conventional approaches that handle one image, one subject, or both are not feasible. One realm in particular that has shown promising potential for gaze behavior is training of medical personnel (Van der Gijp et al., 2017; Gegenfurtner et al., 2011; Waite et al., 2019). For instance, gaze analysis has often been proposed as a measure for adaptive training systems (i.e. searching radiographs for pathologies (Jarodzka et al., 2010b, 2012), practicing surgery or laproscopy in VR/AR (Law et al., 2004)). However, actually working training procedures are still scarce. Massed practice approaches, i.e., lengthy viewing of hundreds of radiographs, is still common educational practice (Rozenshtein et al., 2016). Even though it has been available for decades, as of now eye-tracking has yet to deliver the promises for adaptive training. The challenge of expediting a novice to expert solely through training gaze behavior has yet to be fully operational (Van der Gijp et al., 2017).
In this work, we show how to incorporate high-level, deep neural network-generated image patch representations into classical scanpath comparison measures. We apply our method DeepScan to expertise classification on an eye movement dataset of expert and student dentists. Dentistry, in particular, relies heavily on effective visual inspection and interpretation of radiographs (Huettig and Axmann, 2014). Even then, panoramic dental radiographs are highly susceptible to diagnostic error (Bruno et al., 2015; Akarslan et al., 2008; Douglass et al., 1986; Gelfand et al., 1983). We demonstrate our method by decoding expertise from eye movements during dental radiograph inspection, which is a crucial first step towards adaptive learning procedures. It is worth noting, this metric is not confined to dental expertise recognition, rather developed with the intention for various use cases. It offers the future potential to assess student’s learning progress in real-time and to adapt stimulus material based on current aptitude, while not being restricted to the stimulus material used during creation of the classifier.
2. Revisiting Visual Scanpath Comparison
2.1. Traditional Approach: String Alignment
One of the most common and traditional approaches to scanpath comparison is extraction of a similarity score by representing a scanpath as a sequence of symbols and comparing the resulting string to one another (Anderson et al., 2015). AOIs on a given stimuli can be semantically or structurally linked to a symbol (Cristino et al., 2010; Goldberg and Helfman, 2010; Jarodzka et al., 2010a; Kübler et al., 2014). Thus, coded strings provide information on the temporal and spatial order of the user’s gaze behavior. Temporal resolution (i.e. fixation duration) can also be factored into the sequence (Cristino et al., 2010).
The output of such a comparison – the similarity score – is based on a total derived from rewarding matches and penalizing mismatches or gaps111inserting a space into one of the sequences.. A scoring matrix can be used to represent the relative similarity of characters to one another (Baichoo and Ouzounis, 2017; Day, 2010; Goldberg and Helfman, 2010). A positive matching score represents similar regions and a negative score mismatches. Gaps are inserted in order to make neighboring characters match and to compensate small shifts of highly similar segments between the sequences.
Global sequence alignment with a notion of AOI similarity can be performed via the Needleman-Wunsch algorithm (Anderson et al., 2015; Needleman and Wunsch, 1970). Global sequence alignment determines the most optimal alignment for the entirety of two sequences. It has been shown to be a robust metric in scanpath comparison, e.g. in ScanMatch (Cristino et al., 2010), classification of attentional disorder (Galgani et al., 2009), multiple scanpath sequence alignment (Burch et al., 2018), and expert and novice programmer classification (Busjahn et al., 2015). Castner et al. (Castner et al., 2018a) found incoming dental students with no prior training in radiograph interpretation could be classified from later semester students with 80% accuracy from Needleman-Wunsch similarity scores.
Similarly, scanpath similarity from local sequence alignment has often been used as a robust classifier. Rather than deal with the entirety of two sequences, local alignment determines the most optimal aligned subsequence between the two. Local alignment compensates to a greater degree for sequences of differing lengths and is not as strongly influenced by differences in the beginning or end of the sequences (Khedher et al., 2018). For example, (Khedher et al., 2018) used the Smith-Waterman algorithm (Smith et al., 1981) for local alignment of medical undergrads’ scanpaths during a clinical reasoning task. They found similarly well performing students had highly correlative scores. Similarly, (Çöltekin et al., 2010) found high comprehension and scanpath similarity of local subsequences in reading interactive map displays.
Determining the optimal alignment between two sequences is computationally costly. Additionally, though commonly used, these methods suffer from a severe drawback: The manual selection of AOIs. This process is subjective, not only in which AOIs are considered relevant for the analysis, but also with regard to their size (Cristino et al., 2010; Jarodzka et al., 2010a). For instance, Deitelhof et al. (Deitelhoff et al., 2019) found that scanpath transitional information can be highly impacted by the AOI size and padding, which can affect validity. Moreover, some measures (e.g. Levenshtein distance) only rate exact matches and mismatches and do not consider any potential AOI similarity - and the ability of an algorithm to include this introduces the additional hard problem of judging AOI similarity objectively.
Much of the prior literature on scanpath comparison using sequence alignment have employed manual AOI definitions. However, these approaches suffer errors in spatial resolution or require task-subjective AOI labels (Jarodzka et al., 2010a; Cristino et al., 2010). Kübler et al. (Kübler et al., 2014) developed a method –SubsMatch– for sequence comparison without AOI definitions, which uses a bag-of-words model and looks at the transitional behavior of subsequences. Castner et al. (Castner et al., 2018a) used these subsquence transitions from SubsMatch with an SVM Classifier (Kübler et al., 2017) and found comparable results to sequence alignment with grid AOIs.
However, these automatic approaches lack any notion of what is actually being looked at. Therefore, they usually perform excellent when subjects view the exact same stimulus (because then location identity corresponds to semantic identity to some extent). But when performing cross-stimulus analysis or the stimulus is subject to noise, performance drops significantly.
As of now, gaze pattern comparison is based either only on gaze location – not on the semantic object that is being looked at – or relies on human annotation to determine the semantics. Yet, scene semantics are absolutely critical for judging gaze behavior. For larger experiments and in the wild head-mounted eye tracker data (Wan et al., 2018; Pfeiffer et al., 2016), manual annotation is unfeasible. We propose a method that combines the traditional approach of sequence alignment with deep learning for fixation target understanding. Combining these methods enables us to understand (and automatically analyze) the semantics behind a scanpath.
2.2. Current Directions: Deep Learning
Convolutional neural networks (CNNs) can provide information of image semantics that can be used for segmentation (Long et al., 2015; Chen et al., 2017) or classification (Krizhevsky et al., 2012) and saliency prediction (Huang et al., 2015; Hong et al., 2015), and many other applications. In the field of eye tracking research, they have also provided robust performance in eye movement behavior and scanpath generation (Assens Reina et al., 2017; Liu et al., 2015). For instance, methods using probabilistic models and deep learning techniques coupled with ground truth gaze behavior have been shown to predict fixation behavior (Kümmerer et al., 2015; Wang et al., 2015).
Concerning human scanpath classification, (Fuhl et al., 2019) encoded gaze data as a compact image with the spatial, temporal, and connectivity represented as pixel values in the red, green, and blue channels respectively. These images were input for a CNN classifier, which showed high accuracy in classifying task-based gaze behavior. Mishra et al. (Mishra and Bhattacharyya, 2018) followed a similar approach of depicting scanpath information as an image for a CNN sarcasm detector.
Tao and Shyu (Tao and Shyu, 2019) offer an approach similar to our proposed approach. They developed a CNN-Long Short Term Memory (LSTM) network that runs on scanpath-based patches from a saliency-predicted map222ASD specific saliency prediction from the Saliency4ASD challenge. and classifies typical/autism spectrum disorder gaze behavior (Tao and Shyu, 2019). Square patches are defined based on fixation positions as they occur in the scanpath. Then, each patch is run through a shallow CNN, and the patch feature vector with the duration information provides an LSTM network input for classification from a dense layer from each patch (Tao and Shyu, 2019). Most notable, they maintain the sequential information of the scanpath.
We utilize powerful Deep Neural Network(DNN)-based feature descriptors to represent the semantics of a gaze sequence (scanpath). Our proposed approach follows a similar idea of incorporating the sequential fixation information in conjunction with visual features using a CNN. However, we extract scanpath similarity from the culmination of image patch features using the traditional approach of sequence alignment. For the current work, we chose local alignment in order to focus on common subsequences that could be indicative of expertise. Then, we cluster the scanpaths based on this similarity. Subsequently, we evaluate our proposed approach on detecting expert and student dentists’ scanpaths when inspecting dental radiographs.
3. Proposed Approach
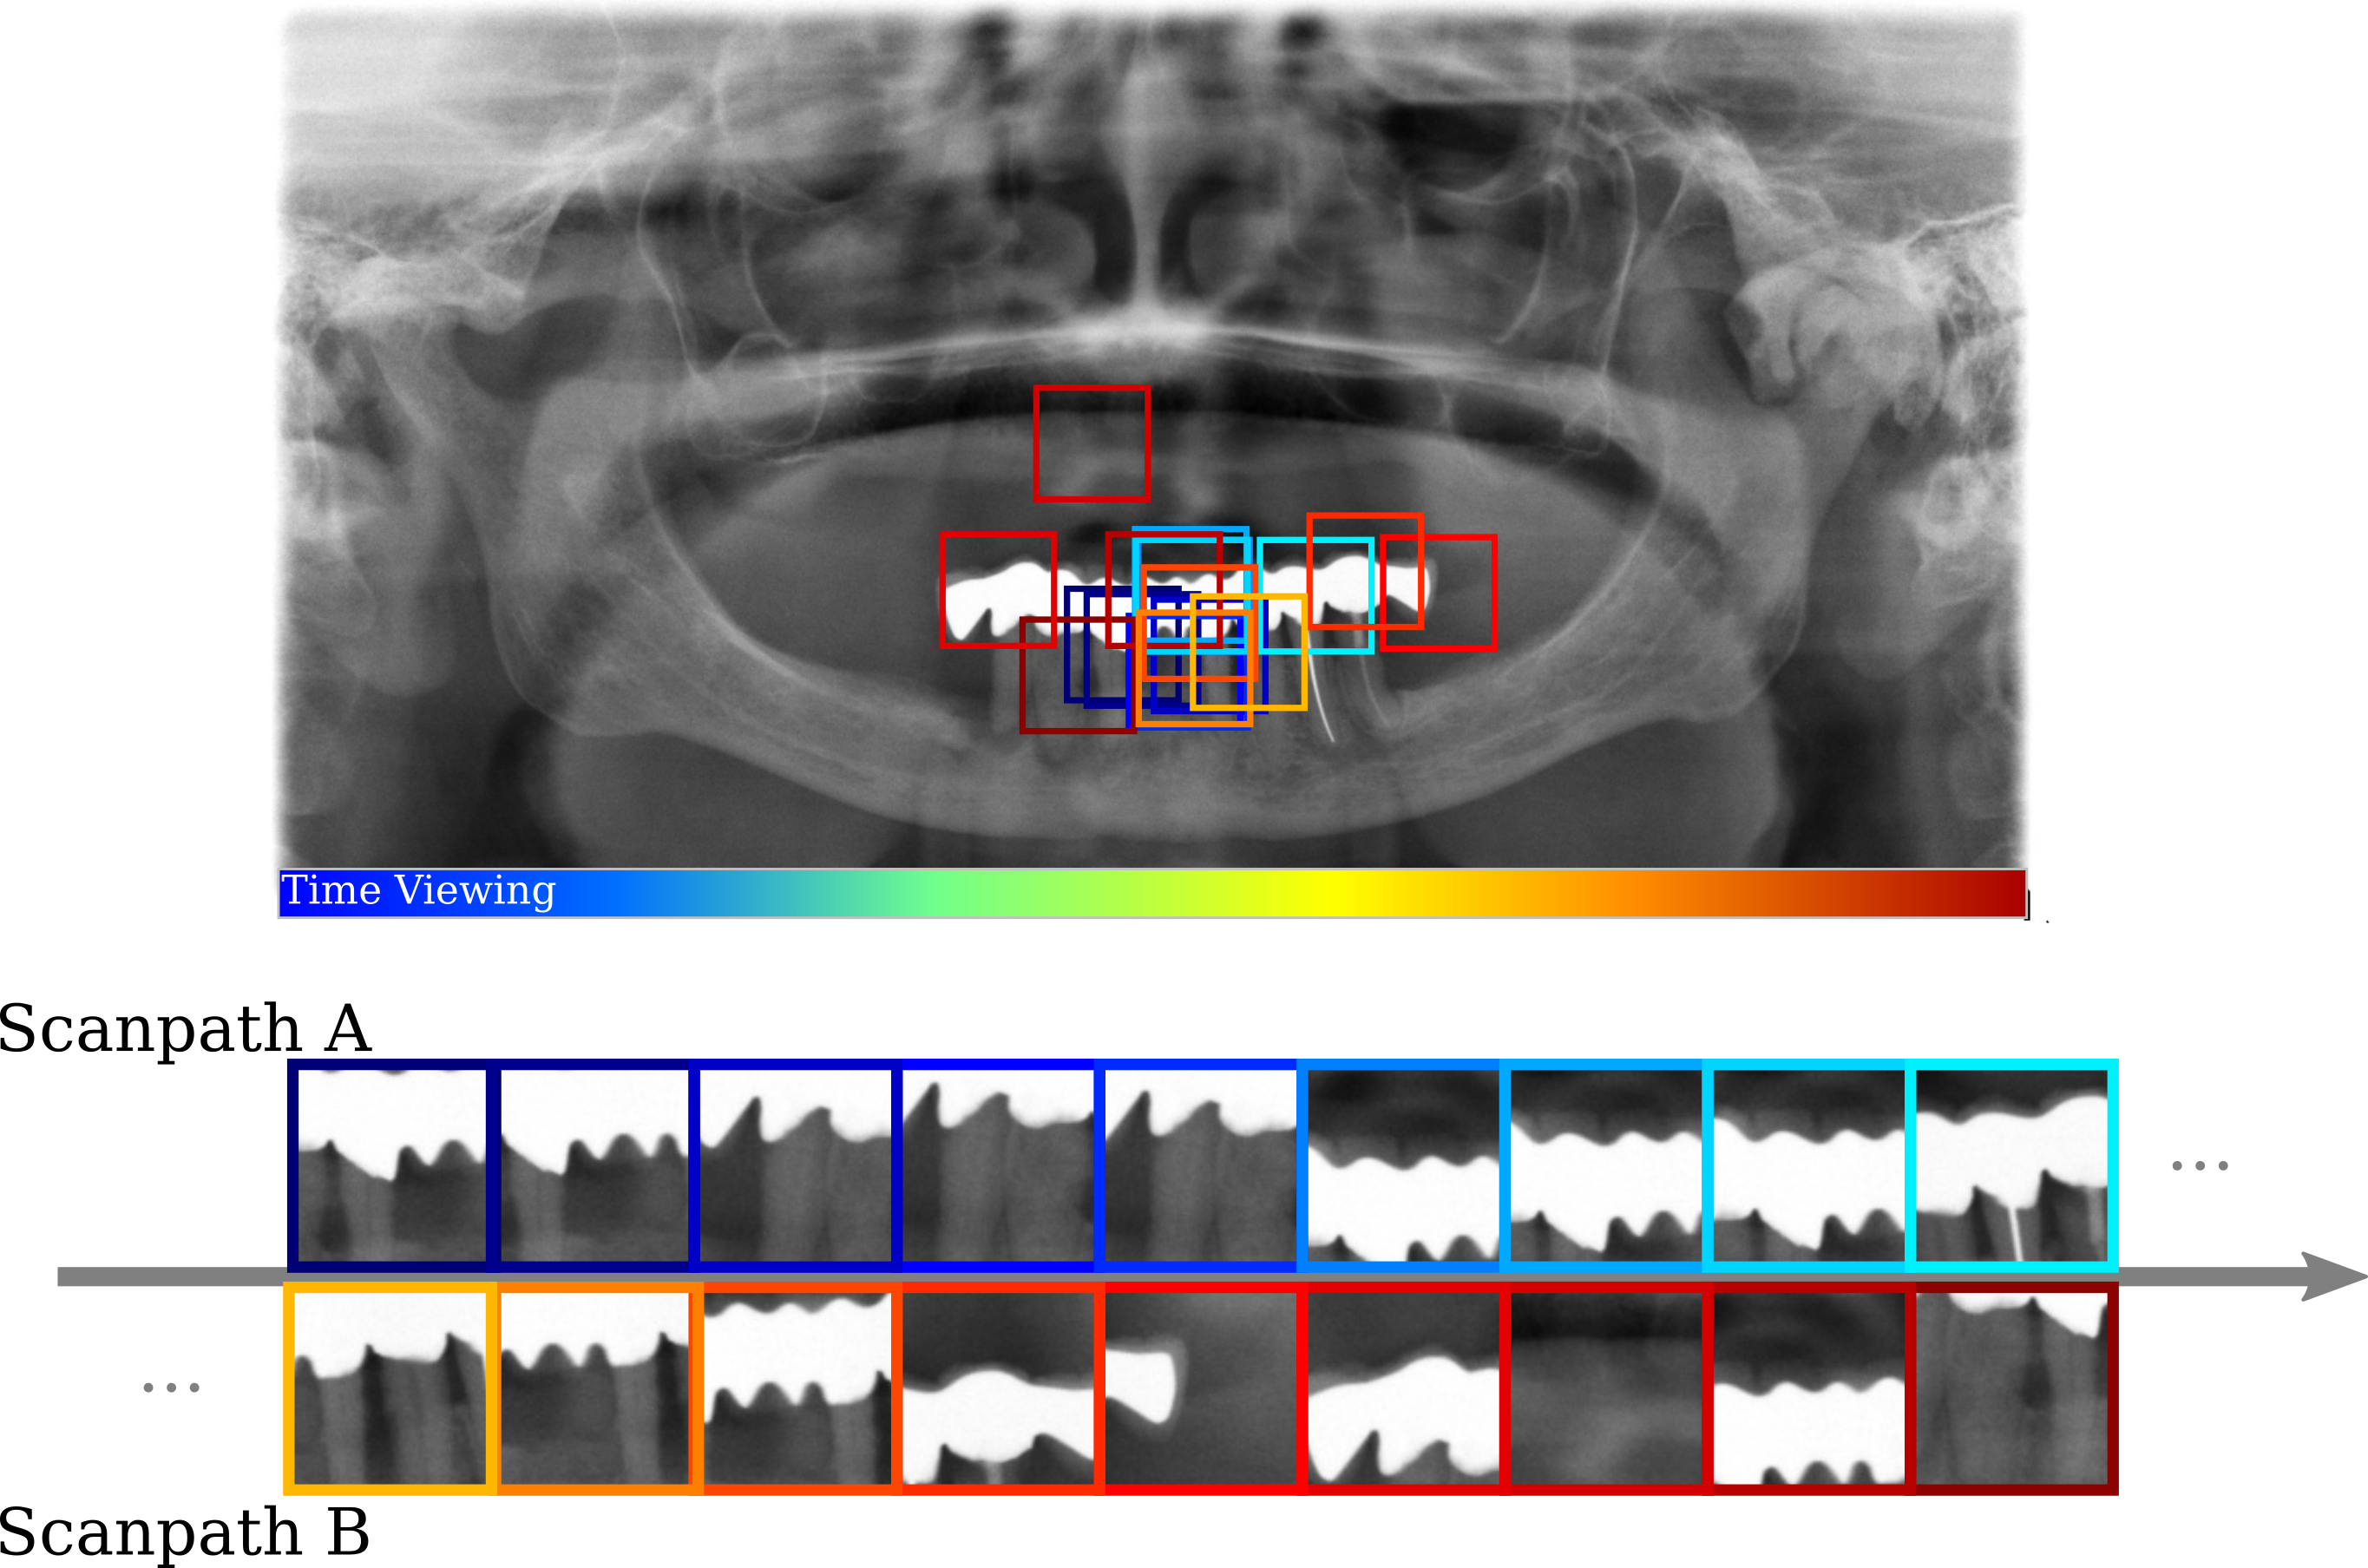
3.1. Image Features at the Fixation Level
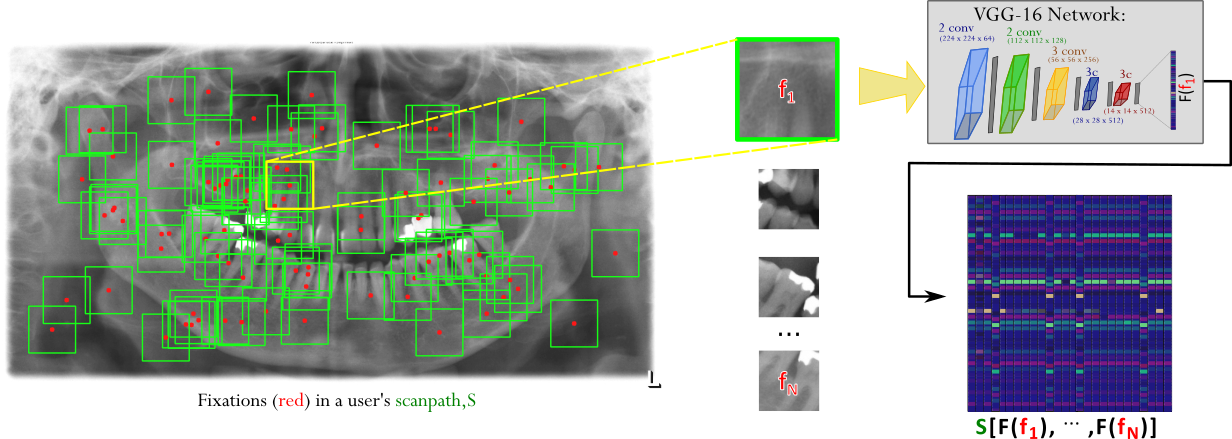
Each individual fixation corresponds to a visual intake of a certain stimulus region. We then encode each fixation location on the specific stimulus image by a vector that describes the local image region. We generate such encodings via the output from the VGG-16 architecture (Simonyan and Zisserman, 2014). Accordingly, for each fixation location on the stimulus image, we extract a patch of pixels as input to the network. This step is relatively similar to (Tao and Shyu, 2019), although we determined that using a fixed size bounding box is adequate for our stimuli. The fixation coordinates indicate the center of the bounding box of the image patch, unless a fixation is too close to the stimulus borders. Then, appropriate shifting of the box along the x or y axis is necessary.
The architecture we employed for patch processing originally takes RGB input images. For the current evaluation on experts and students searching dental radiographs, our stimuli were grayscale with pixel dimensions . In development, we determined that patch sizes of for our stimuli were too large (e.g. four or more teeth would be in this sized area). Smaller patches were more preferable so that enough information from an entity is extracted. Therefore, we rescaled the image patches to the desired input size for the network, and replicated the one channel image information to get three channels that can utilize the weights pre-trained on ImageNet (Deng et al., 2009).
However, image patch input size and channels could be adapted for other stimuli or any other preferred network for the fixation encodings. The takeaway from this image patch approach is that through only the gaze: 1) we map the image features of interest in temporal order, and 2) we can extract the semantics from these features.
3.2. CNN Architecture
For patch descriptor extraction, we employed a VGG-16 network (Simonyan and Zisserman, 2014) as implemented in keras333Python 3.6 with GPU compatibility. and pre-trained on ImageNet. Figure 2 shows the network: Consisting of five blocks of convolutions, with each block followed by ReLUs and max-pooling.
Since we are only interested in the features, we omit the fully-connected and prediction output layers of the model and use the output after max-pooling, which has dimensions, and flatten it to a vector. This feature description from the final convolutional layer, F(), represents the image patch at the th fixation .
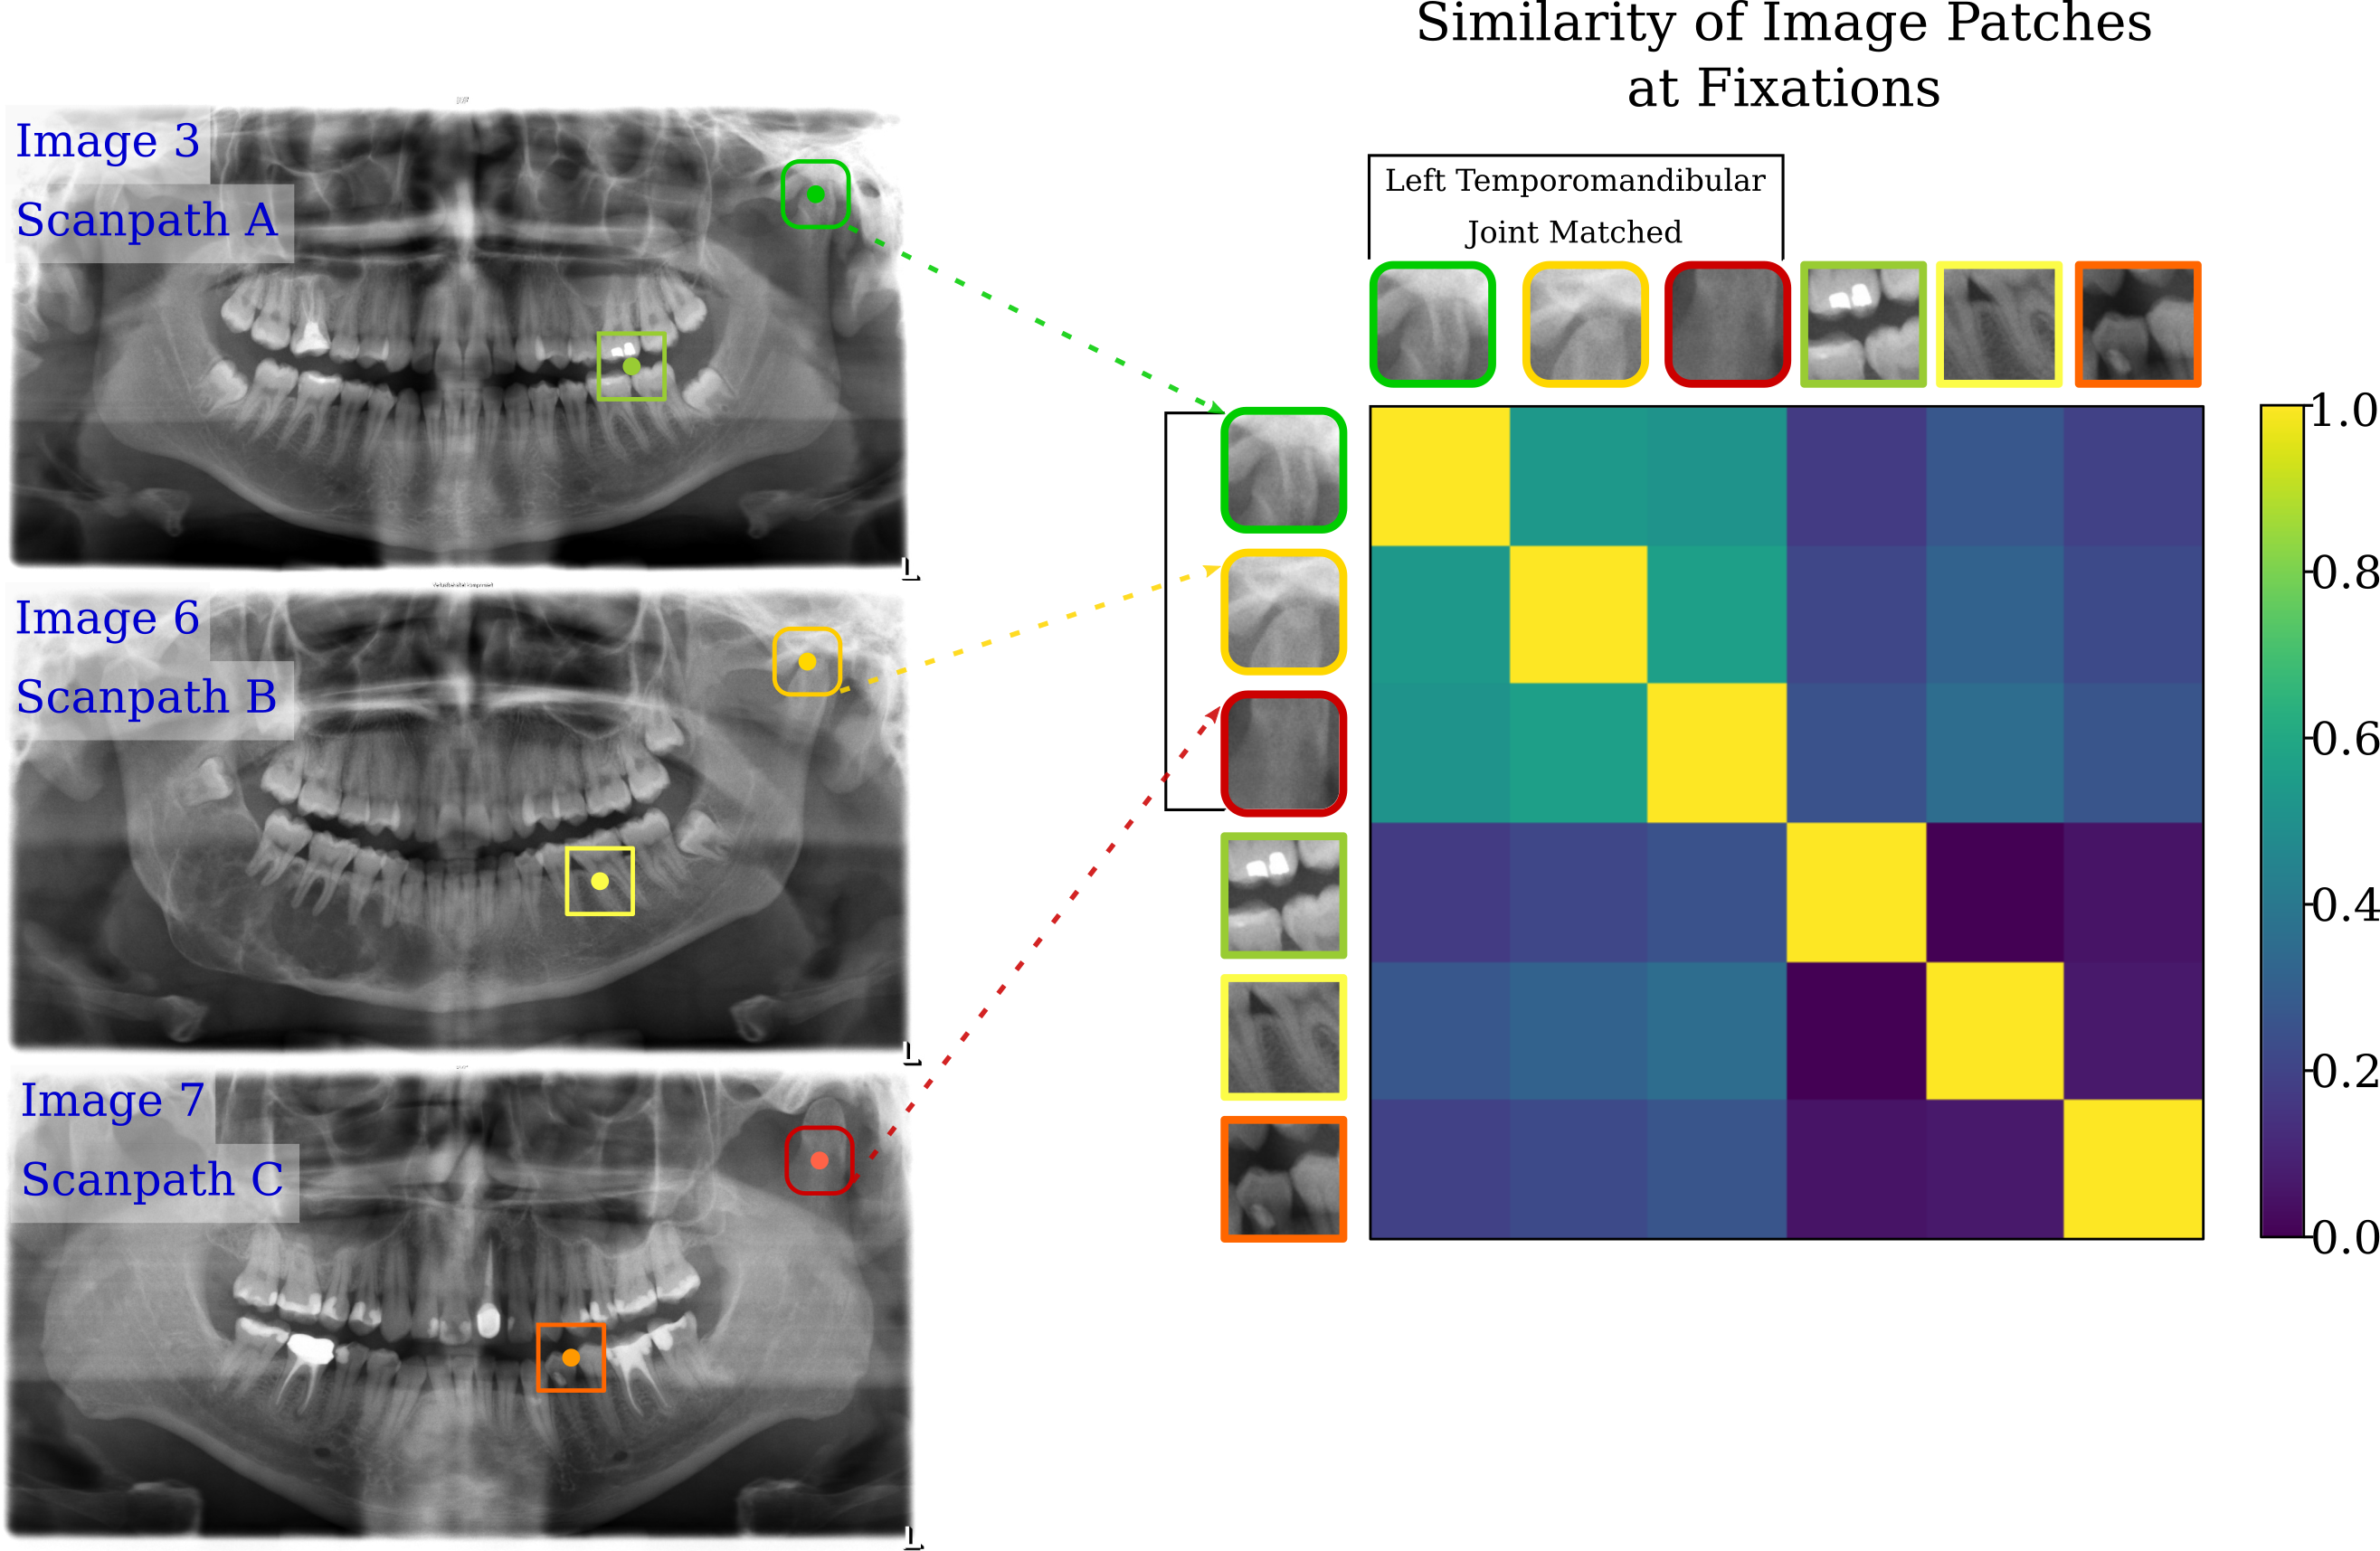
The feature descriptors provide the semantic information for each fixation in a user’s scanpath and are the equivalent to a symbol representation in the traditional string-sequence representation. In the following, we discuss the changes required in the alignment algorithm in order to work with alignment scores generated by comparing these image features to each other. Figure 1 shows an example of how similar features can compare to each other.
We chose the VGG-16, in contrast to a network pre-trained on radiology images since it is more generalizable to a variety of tasks and stimuli. Additionally, it is publicly available and easily integrated for replication purposes. Pre-trained networks for medical images are often not publicly available due to the data sensitivity and protection, and any existing architectures for these images are not yet up to par with the generic image trained architectures. Choosing a network that is trained for a specific stimulus category, e.g., panoramic radiographs or other X-Rays, might improve results. However, it introduces the risk of limiting data analysis to specific elements, which is comparable to manual AOI selection. Ultimately, though our approach is evaluated on medical image expertise, we developed it for generalizability in multiple applications.
3.3. Local Alignment
Once we have descriptors for each fixation, we assemble them as a scanpath. The resulting matrix of image features at each fixation creates a scanpath matrix. . With this matrix representation, we can compare its similarity to the matrix representing another scanpath.
For scanpath comparison, we perform local alignment using a variant of the Smith-Waterman Algorithm. We preferred local alignment scoring over global alignment due to its ability to find similar subsequences, even if the scanpaths may otherwise be highly varying (Khedher et al., 2018). Moreover, we did not want to enforce strict global alignment due to different viewing times required by students and experts. In sequence alignment, the penalty system can have a major effect on values in the scoring matrix, and therefore, the similarity score (Baichoo and Ouzounis, 2017). Our scoring choice prioritizes finding long rather than short similar subsequences by accumulating scores. Equation 1 details the scoring system used for the current evaluation:
| (1) |
Where is the scoring matrix of size for two scanpaths and with and fixations respectively. Element takes the maximum value based on if there is a match between the values at index of scanpath and index of scanpath . The original algorithm scores matches as the score value added to the value at the previous indices: . Then, if there is no match, it determines whether the value of a gap penalty () in either scanpath, or no similarity () are more optimal for the score.
The interesting part of our approach is contained in the calculation of the match score. Since it is highly unlikely that two features will be exactly the same, we cannot explicitly match or mismatch. Therefore, we calculate the score by taking the sum of absolute differences in feature descriptor of scanpath and descriptor of scanpath as shown in the first line of equation 1. This is simple to implement and cheap to compute, but other metrics such as cosine or Euclidean distance could also be used. This procedure leads to a dissimilarity score between the image patches. The more dissimilar the image patches, the larger the scoring value.
In order to convert it to a similarity score, we can subtract the dissimilarity score from a constant . We calculated in equation 1 by averaging the sum of the differences for all features between all scanpaths of one random image in the dataset. Therefore, was in the evaluation of our proposed approach. This constant affects highly similar image patches positively, but highly dissimilar image patches are penalized negatively with the same weight. Meaning it functions similar to a match/mismatch threshold. Additionally, we set our gap penalty (lines 2 and 3 in eq.1) to to highly penalize gaps, therefore almost double .
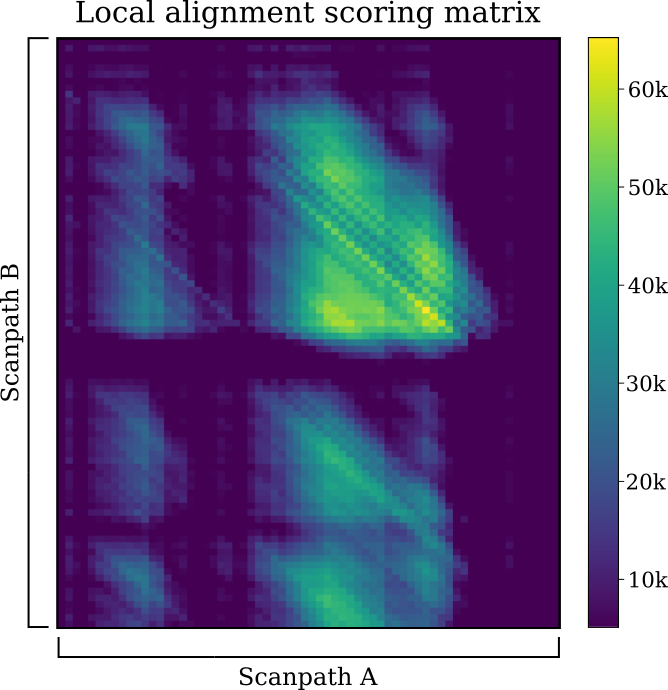
This choice of makes the algorithm consider about half of the image patches relatively dissimilar to each other. Furthermore, gaps are penalized quite strongly, resulting in compact alignments that are not drastically influenced by large differences in sequence lengths. Figure 3 shows an example of the similarity matrix created from the local alignment performed for two scanpaths. The maximum value in the matrix is the similarity score (Smith et al., 1981). In figure 3, the highest yellow color indicates the final similarity score and backtracing from this index till will give the optimal local alignment of both sequences.
The resulting similarity score for the two scanpaths is . Then, we normalize this score based on the length of the shorter scanpath, thus:
| (2) |
We compared the performance of our DeepScan method to Smith-Waterman local alignment of hand-labeled semantic AOIs (the gold standard in adding semantic information to image patches, see Supplementary Material Figure 1). These AOIs indicate specific anatomical structures and regions across the dental radiographs and provide the paramount in semantic information that can be represented in a scanpath. For scoring the semantic scanpath comparisons, we used a simple, standard scoring system: for matches, for mismatches, and for gaps.
4. Evaluation
4.1. Scanpath Data of Dentists
Students (n=) were incoming dental students (sixth semester) from their initial pre-med studies. They had no prior training in dental radiograph interpretation, but basic conceptual knowledge in general medical concepts. Experts (n=, average years experience) were dentists working in the local university clinic with all the proper qualifications and some had further licensing for other particular specializations (e.g. Endontology, Prosthetics, Orthodontology, etc.). Diagnostic performance results from both groups indicated that the experts had higher pathology detection accuracy than students 444Performance metrics and expert results can further be found in (Castner et al., 2018b).
Both students and experts were asked to perform a visual search task of panoramic dental radiographs (OPTs); then following image inspection, indicate any areas indicative of pathologies. Students had 90 seconds to inspect each OPT, where experts had 45 seconds to inspect each OPT. This shortened duration was due to the research indicating that experts are much faster when visually inspecting radiographs (Gegenfurtner et al., 2011; Turgeon and Lam, 2016). Students inspected two blocks of 10 OPTs in one experimental run and experts – due to their hard-pressed schedules – inspected 15 OPTs.
All eye tracking data was collected with SMI RED250 remote eye trackers sampling at 250Hz attached to laptops with FullHD displays. A quality assessed calibration555less than one degree average deviation from a four point validation. was performed for each participant before and during data collection. Gaze data, i.e. fixations, were determined using a velocity based metric provided by the eye tracker’s software. Further details of the data collection and pre-processing can be found in (Castner et al., 2018a, b).
For compatibility, we chose to evaluate gaze data from the first 45 seconds of each student participant, in line with the experts’ total viewing time. Additionally, our model is only evaluated on gaze data for the 10 OPTs that both groups viewed. Gaze data was lost for two expert participants due to software failure. Also, participants were excluded due to having high data loss (under tracking ratio666A metric reported from SMI indicating proportion of valid gaze signals. and or more low signal quality images) leaving experts and students for the final analysis. The resulting total for all participants for all images was 733 scanpaths.
4.2. Similarity Scoring
We performed local alignment of the scanpath vectors with patch features for each participant for all images. In order to get the scanpath behavior representative of each participant, we averaged a participants’ similarity output for all images. Figure 4 shows the similarity scores from DeepScan of each participants’ scanpath behavior over the images viewed in pairwise comparison to other participants. The diagonal of the matrix indicates the highest similarity value, which is a participants’ gaze behavior compared to his or herself.
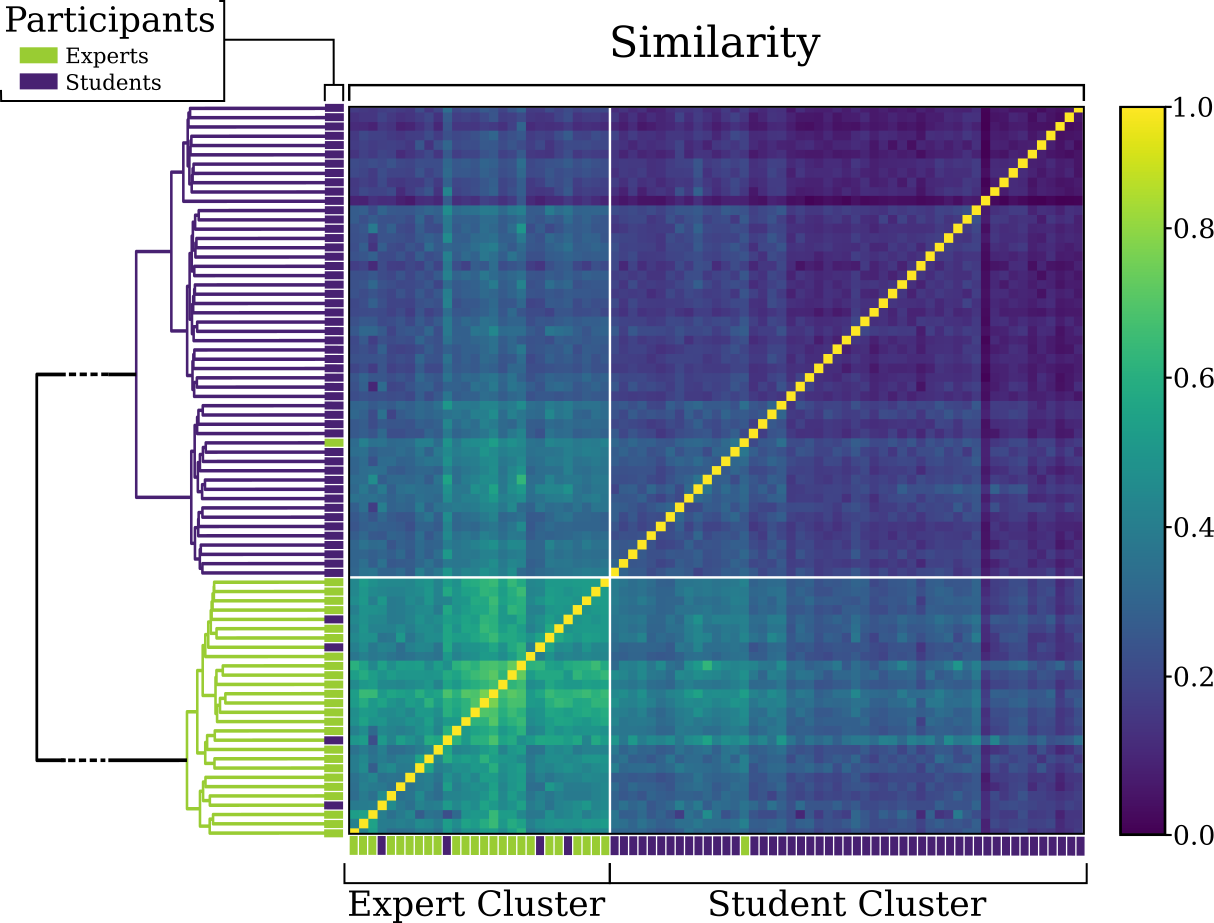
From the similarity matrix, a trend is apparent where experts (labeled green in figure 4) show higher similarity scores among each other, as visible by the more yellow values. Conversely, students’ gaze behavior shows less similarity among each other, especially when compared to experts.
4.3. Hierarchical Clustering
We clustered the similarity scores of all participants using agglomerative hierarchical clustering (Johnson, 1967; Corpet, 1988; West et al., 2006). As the similarity matrix can easily be inverted to a distance matrix, the unsupervised clustering approach was straight forward; however one could introduce additional weighting factors or more complex classification methods on top as well. This approach evaluates the distance between data points and links closer in distance clusters until one cluster remains (Johnson, 1967). Partitioning the clusters then is determined by the linkage distance. We used Ward’s (Johnson, 1967) method for proximity definition, which minimizes the sum of the squared distances of points from the cluster centroid.
Average Gaze Behavior of Each Subject
For the scores of each student and expert summed over all images, the resulting dendrogram (2-dimensional tree view of the nested clusters) is shown on the y-axis in figure 4.
The clustering seen in figure 4 recognizes two main clusters evident in the gaze behavior with the majority of students in one cluster (purple cluster, purple labels) and the majority of experts (green cluster, green labels) in the other. Table 1 calculates the true positive rate (TPR) when utilizing the clustering as a classification for both students and experts as well as the overall accuracy. We achieved accuracy. We also found two clusters evident in the traditional local alignment with manual AOIs; however more students were misplaced in the expert cluster (as seen in table 1), resulting in an overall accuracy of .
| Student | Expert | Accuracy | ||||
| Feature | Semantic | Feature | Semantic | Feature | Semantic | |
| Student | 50 | 44 | 1 | 1 | ||
| Expert | 4 | 10 | 24 | 24 | ||
| TPR | 92.5 % | 81.5 % | 96.0 % | 96.0 % | 93.7 % | 86.06 % |
Gaze Behavior on the Image Level
We then ran the hierarchical clustering for participants’ gaze at the image level (over all 733 datasets and not the average similarities for each participant as above). The dendrogram also recognized two clusters, therefore we calculated the number of experts in one cluster and the number of students in the other. The achieved accuracy for our approach was : Experts had TPR and students had TPR. The achieved accuracy for the traditional, semantic approach was : Experts had TPR and students had TPR. This slight dip in performance could be attributed to pathology differences in the stimuli. Previous literature has also found that gaze behavior of expert and novice dentists can be highly stimulus dependent, where dental radiographs considered easy to interpret evoke similar gaze behavior in experts and novices (Turgeon and Lam, 2016; Grünheid et al., 2013).
4.4. Cross-Image Classification
To further see whether we could predict classification performance on an image level, we performed a leave one subject and one image out cross-validation using the similarity scores from DeepScan. We performed classification to 1) see whether we could predict a participant’s expertise from their scanpath on a new image, not contained in the set that we compare to. 2) to confirm that certain stimuli may affect the similarities more than others. For each subject, we ran a 3-nearest neighbor classifier, trained on the remaining subjects and images. Table 2 shows the performance for each image. Here, it is clear that for some images, distinguishing expert and student scanpaths becomes more difficult. For instance, image 1 shows a heavy tendency to classify all participants’ scanpaths for that image as experts, and image 3 shows a tendency to over-classify as students. Nevertheless, five images allowed us to determine expertise of a new subject on a new stimulus that were not contained in the data we used for the classification. Especially, image 8 shows the highest accuracy in classifying level of expertise, meaning this OPT and its semantics can possibly trigger experts to inspect the image in a distinctive way.
The cross-validation for the traditional local alignment scoring for the scanpaths with manual AOIs, showed better performance on the image level than DeepScan, and slightly better overall ( versus respectively). Thereby, it is possible that we cannot yet utilize the full potential of semantic encoding using the feature approach. However, given that DeepScan is purely data driven, its results are comparable and relegates the tedious process of manual AOI labeling. Retraining the network on OPT data might help the encoding to come closer to manually-defined semantic labels.
| Expert TPR | Student TPR | Accuracy | ||||||
|---|---|---|---|---|---|---|---|---|
| Feature | Semantic | Feature | Semantic | Feature | Semantic | |||
| Chance: | 32 % | 68 % | Overall | Overall | ||||
| Image 1 | 100 % | 75 % | 20.4 % | 76.6 % | 44.9 % | 0.14 | 78.2 % | 0.52 |
| Image 2 | 59.1 % | 68.2 % | 83.3 % | 85.4 % | 75.7 % | 0.43 | 80 % | 0.54 |
| Image 3 | 28.6 % | 66.7 % | 93.5 % | 80.4 % | 73.1 % | 0.26 | 76.1 % | 0.46 |
| Image 4 | 52.4 % | 57.1 % | 89.8 % | 83.7 % | 78.6 % | 0.45 | 75.7 % | 0.41 |
| Image 5 | 76.2 % | 53.4 % | 68.6 % | 88.2 % | 70.8 % | 0.39 | 77.8 % | 0.43 |
| Image 6 | 66.7 % | 75 % | 67.9 % | 81.1 % | 65.5 % | 0.31 | 79.2 % | 0.54 |
| Image 7 | 60.9 % | 30.4 % | 86.5 % | 90.4 % | 78.7 % | 0.49 | 72 % | 0.24 |
| Image 8 | 73.9 % | 91.3 % | 88.2 % | 68.6 % | 83.8 % | 0.62 | 75.7 % | 0.51 |
| Image 9 | 45.8 % | 58.3 % | 92.6 % | 96.3 % | 78.2 % | 0.43 | 84.6 % | 0.60 |
| Image 10 | 30 % | 80 % | 96.2 % | 65.4 % | 77.8 % | 0.32 | 69.4 % | 0.37 |
| Overall | 60.1 % | 65.5 % | 78.2 % | 82 % | 72.7 % | 0.37 | 76.9 % | 0.46 |
Additionally, we sorted the similarity scores of all scanpaths from DeepScan to isolate those that expose especially high similarity values to many other scanpaths. We hoped to extract archetype-scanpaths this way. The histogram in figure 5 shows that two expert scanpaths had the highest similarity scores to the most other scanpaths. Interestingly enough, both these scanpaths and a number of the other high similarity scanpaths are for image 1. Thus from the local alignment similarity, certain scanpaths from image 1 offer highly similar subsequences to other scanpaths regardless of image. Image 1 was one of the stimuli that made a distinction between expertise levels hard. It might therefore represent a standard scanpath for checking OPTs that abstracts over special attributes of individual stimuli.
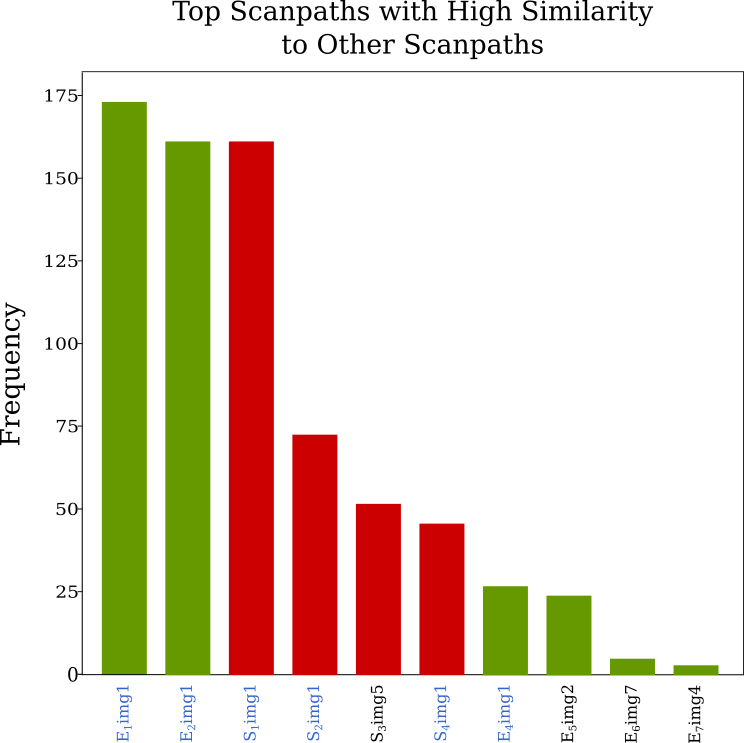
The two experts scanpaths (illustrated by their image patches) with the most highest similarities to each other and many other subjects’ scanpaths are shown in figure 2 in the Supplementary Material.
5. Discussion
We were able to successfully extract similarities in the scanpath behaviors between experts and the differences towards students gaze behavior while interpreting panoramic dental radiographs. Our developed scanpath comparison approach uses temporal scanpath information to extract image features at the fixation level. The resulting similarity comparison of scanpaths therefore incorporates this image information into the traditional approach of sequence alignment to detect patterns between the behaviors.
From traditional local alignment techniques using image features, we found that experts showed highly similar behavior to each other and therefore, were more likely to be clustered together. More interesting, students’ similarity scores indicated that their scanpaths were not highly similar to those of experts, but also there was no distinct homogeneity among themselves (see figure 6). One possible reason for their low similarity to each other could be that they are incoming students with some conceptual background; however, they had no training on radiograph interpretation. Previous research has found that students evoke more systematic search strategies after training, resulting in more similar gaze behaviors (Kok et al., 2016; Van der Gijp et al., 2017). Additionally, the heterogeneity of background and training can affect scanpath similarity (Davies et al., 2016). Possibly students have varying levels of conceptual knowledge or familiarity with radiographs before entering their first year of dental studies.
Our algorithm was able to accurately classify unseen scanpaths given scanpaths from other participants and other images. Although we found that, depending on the image, it could be easier or harder to differentiate the levels of expertise from the scanpath similarities. This finding is, however, in alignment with previous studies specifically on dentists and dental radiograph examination. For instance, (Turgeon and Lam, 2016) found that radiographs defined as easy to interpret offered no differences in the gaze behavior of experts and novices. Castner et al. (Castner et al., 2018b) also found that even among experts some images evoked highly differing gaze behavior to achieve accurate anomaly detections.
With the system at hand, we could classify expertise of dentist students in an adaptive feedback setting from viewing just a single stimulus (with decent accuracy), even if the stimulus itself is an arbitrary OPT that is unknown to the classifier. This could be used to guide students through the learning process and to adapt the difficulty of stimulus material to their current knowledge level. When viewing multiple stimuli (which students do in the current mass practice approach), classification accuracy can be increased.
Futhermore, we observed that some stimuli allowed for a classification of expertise, while others did not. We could utilize this information as a hint on which stimuli are likely to induce a training effect and to differentiate them from stimuli that are too easy (for the current student).
Moreover, we designed DeepScan to handle image variability. One image feature descriptor of a patch in one image can match to similar patches in other images (see figure 1); This way, scanpaths can be more easily compared cross-stimuli, but this process also replaces a manual AOI-annotation. By the assumption that similar semantic meaning in a visual task corresponds to similar looking features in the stimulus, we have introduced a notion of stimulus semantics into the automated scanpath interpretation. A similar workflow could be used to compare data where the annotation of dynamic AOIs is usually unfeasible, e.g., recordings of mobile eye-tracking devices to each other. Furthermore, we do not restrict the algorithm to individual annotated AOIs, but represent each fixation by its feature descriptor, no matter whether a data analyst would deem it relevant for the analysis at hand or not.
One limitation for the current work could be the methodological confound of the viewing time differences in the expert and student paradigms. Since a consistently longer viewing time for the students would heavily affect the similarity scoring regardless of normalization, we took the first 45 seconds of the students, so that our similarity scores would be less biased by their longer scanpaths.
6. Conclusion
Our proposed model for scanpath classification, DeepScan, is capable of extracting gaze behavior indicative of expertise in dental radiograph inspection. More important, this approach employs deep learning to extract image features. Consequently, human expert gaze behavior coupled with relevant image semantic extraction offers an accurate approach to automated scanpath classification. However, the motivation for this model does not finish here. Rather, it was developed for applicability not only in the medical expertise domain, but also for scenarios with dynamic, semantically varying tasks (i.e. Training in VR, real world scenarios with mobile eye tracking).
Future directions of the proposed approach optimization for online classification of scanpaths. We chose a local alignment evaluation as a traditional approach to scanpath comparison, since it provides for a standard and robust evaluation of the scanpath feature matrix created. DeepScan has the potential for online use and further evaluation are therefore necessary for working towards integrating this model into adaptive feedback scenarios.
References
- (1)
- Akarslan et al. (2008) ZZ Akarslan, M Akdevelioglu, K Gungor, and H Erten. 2008. A comparison of the diagnostic accuracy of bitewing, periapical, unfiltered and filtered digital panoramic images for approximal caries detection in posterior teeth. Dentomaxillofacial Radiology 37, 8 (2008), 458–463.
- Anderson et al. (2015) Nicola C Anderson, Fraser Anderson, Alan Kingstone, and Walter F Bischof. 2015. A comparison of scanpath comparison methods. Behavior research methods 47, 4 (2015), 1377–1392.
- Assens Reina et al. (2017) Marc Assens Reina, Xavier Giro-i Nieto, Kevin McGuinness, and Noel E O’Connor. 2017. Saltinet: Scan-path prediction on 360 degree images using saliency volumes. In Proceedings of the IEEE International Conference on Computer Vision. 2331–2338.
- Baichoo and Ouzounis (2017) Shakuntala Baichoo and Christos A Ouzounis. 2017. Computational complexity of algorithms for sequence comparison, short-read assembly and genome alignment. Biosystems (2017).
- Borji and Itti (2014) Ali Borji and Laurent Itti. 2014. Defending Yarbus: Eye movements reveal observers’ task. Journal of vision 14, 3 (2014), 29–29.
- Bruno et al. (2015) Michael A Bruno, Eric A Walker, and Hani H Abujudeh. 2015. Understanding and confronting our mistakes: the epidemiology of error in radiology and strategies for error reduction. Radiographics 35, 6 (2015), 1668–1676.
- Burch et al. (2018) Michael Burch, Kuno Kurzhals, Niklas Kleinhans, and Daniel Weiskopf. 2018. EyeMSA: exploring eye movement data with pairwise and multiple sequence alignment. In Proceedings of the 2018 ACM Symposium on Eye Tracking Research & Applications. ACM, 52.
- Busjahn et al. (2015) Teresa Busjahn, Roman Bednarik, Andrew Begel, Martha Crosby, James H Paterson, Carsten Schulte, Bonita Sharif, and Sascha Tamm. 2015. Eye movements in code reading: Relaxing the linear order. In Program Comprehension (ICPC), 2015 IEEE 23rd International Conference on. IEEE, 255–265.
- Castner et al. (2018a) Nora Castner, Enkelejda Kasneci, Thomas Kübler, Katharina Scheiter, Juliane Richter, Thérése Eder, Fabian Hüttig, and Constanze Keutel. 2018a. Scanpath comparison in medical image reading skills of dental students: distinguishing stages of expertise development. In Proceedings of the 2018 ACM Symposium on Eye Tracking Research & Applications. ACM, 39.
- Castner et al. (2018b) Nora Castner, Solveig Klepper, Lena Kopnarski, Fabian Hüttig, Constanze Keutel, Katharina Scheiter, Juliane Richter, Thérése Eder, and Enkelejda Kasneci. 2018b. Overlooking: the nature of gaze behavior and anomaly detection in expert dentists. In Proceedings of the Workshop on Modeling Cognitive Processes from Multimodal Data. ACM, 8.
- Chen et al. (2017) Liang-Chieh Chen, George Papandreou, Iasonas Kokkinos, Kevin Murphy, and Alan L Yuille. 2017. Deeplab: Semantic image segmentation with deep convolutional nets, atrous convolution, and fully connected crfs. IEEE transactions on pattern analysis and machine intelligence 40, 4 (2017), 834–848.
- Çöltekin et al. (2010) Arzu Çöltekin, Sara Irina Fabrikant, and Martin Lacayo. 2010. Exploring the efficiency of users’ visual analytics strategies based on sequence analysis of eye movement recordings. International Journal of Geographical Information Science 24, 10 (2010), 1559–1575.
- Corpet (1988) Florence Corpet. 1988. Multiple sequence alignment with hierarchical clustering. Nucleic acids research 16, 22 (1988), 10881–10890.
- Cristino et al. (2010) Filipe Cristino, Sebastiaan Mathôt, Jan Theeuwes, and Iain D Gilchrist. 2010. ScanMatch: A novel method for comparing fixation sequences. Behavior research methods 42, 3 (2010), 692–700.
- Davies et al. (2016) Alan Davies, Gavin Brown, Markel Vigo, Simon Harper, Laura Horseman, Bruno Splendiani, Elspeth Hill, and Caroline Jay. 2016. Exploring the relationship between eye movements and electrocardiogram interpretation accuracy. Scientific reports 6 (2016), 38227.
- Day (2010) Rong-Fuh Day. 2010. Examining the validity of the Needleman–Wunsch algorithm in identifying decision strategy with eye-movement data. Decision Support Systems 49, 4 (2010), 396–403.
- Deitelhoff et al. (2019) Fabian Deitelhoff, Andreas Harrer, and Andrea Kienle. 2019. The influence of different AOI models in source code comprehension analysis. In Proceedings of the 6th International Workshop on Eye Movements in Programming. IEEE Press, 10–17.
- Deng et al. (2009) J. Deng, W. Dong, R. Socher, L.-J. Li, K. Li, and L. Fei-Fei. 2009. ImageNet: A Large-Scale Hierarchical Image Database. In CVPR09.
- Douglass et al. (1986) Chester W Douglass, Richard W Valachovic, Anila Wijesinha, Howard H Chauncey, Krishan K Kapur, and Barbara J McNeil. 1986. Clinical efficacy of dental radiography in the detection of dental caries and periodontal diseases. Oral Surgery, Oral Medicine, Oral Pathology 62, 3 (1986), 330–339.
- Fuhl et al. (2019) Wolfgang Fuhl, Efe Bozkir, Benedikt Hosp, Nora Castner, David Geisler, Thiago C Santini, and Enkelejda Kasneci. 2019. Encodji: encoding gaze data into emoji space for an amusing scanpath classification approach. In Proceedings of the 11th ACM Symposium on Eye Tracking Research & Applications. ACM, 64.
- Galgani et al. (2009) Filippo Galgani, Yiwen Sun, Pier Luca Lanzi, and Jason Leigh. 2009. Automatic analysis of eye tracking data for medical diagnosis. In 2009 IEEE Symposium on Computational Intelligence and Data Mining. IEEE, 195–202.
- Gegenfurtner et al. (2011) Andreas Gegenfurtner, Erno Lehtinen, and Roger Säljö. 2011. Expertise differences in the comprehension of visualizations: A meta-analysis of eye-tracking research in professional domains. Educational Psychology Review 23, 4 (2011), 523–552.
- Gelfand et al. (1983) Martin Gelfand, Eric J Sunderman, and Melvin Goldman. 1983. Reliability of radiographical interpretations. Journal of endodontics 9, 2 (1983), 71–75.
- Goldberg and Helfman (2010) Joseph H Goldberg and Jonathan I Helfman. 2010. Scanpath clustering and aggregation. In Proceedings of the 2010 symposium on eye-tracking research & applications. ACM, 227–234.
- Greene et al. (2012) Michelle R Greene, Tommy Liu, and Jeremy M Wolfe. 2012. Reconsidering Yarbus: A failure to predict observers’ task from eye movement patterns. Vision research 62 (2012), 1–8.
- Grünheid et al. (2013) Thorsten Grünheid, Dustin A Hollevoet, James R Miller, and Brent E Larson. 2013. Visual scan behavior of new and experienced clinicians assessing panoramic radiographs. Journal of the World Federation of Orthodontists 2, 1 (2013), e3–e7.
- Haji-Abolhassani and Clark (2014) Amin Haji-Abolhassani and James J Clark. 2014. An inverse Yarbus process: Predicting observers’ task from eye movement patterns. Vision research 103 (2014), 127–142.
- Holmqvist et al. (2011) Kenneth Holmqvist, Marcus Nyström, Richard Andersson, Richard Dewhurst, Halszka Jarodzka, and Joost Van de Weijer. 2011. Eye tracking: A comprehensive guide to methods and measures. OUP Oxford.
- Hong et al. (2015) Seunghoon Hong, Tackgeun You, Suha Kwak, and Bohyung Han. 2015. Online tracking by learning discriminative saliency map with convolutional neural network. In International conference on machine learning. 597–606.
- Huang et al. (2015) Xun Huang, Chengyao Shen, Xavier Boix, and Qi Zhao. 2015. Salicon: Reducing the semantic gap in saliency prediction by adapting deep neural networks. In Proceedings of the IEEE International Conference on Computer Vision. 262–270.
- Huettig and Axmann (2014) Fabian Huettig and Detlef Axmann. 2014. Reporting of dental status from full-arch radiographs: Descriptive analysis and methodological aspects. World Journal of Clinical Cases: WJCC 2, 10 (2014), 552.
- Jarodzka et al. (2012) Halszka Jarodzka, Thomas Balslev, Kenneth Holmqvist, Marcus Nyström, Katharina Scheiter, Peter Gerjets, and Berit Eika. 2012. Conveying clinical reasoning based on visual observation via eye-movement modelling examples. Instructional Science 40, 5 (2012), 813–827.
- Jarodzka et al. (2010a) Halszka Jarodzka, Kenneth Holmqvist, and Marcus Nyström. 2010a. A vector-based, multidimensional scanpath similarity measure. In Proceedings of the 2010 symposium on eye-tracking research & applications. ACM, 211–218.
- Jarodzka et al. (2010b) Halszka Jarodzka, Katharina Scheiter, Peter Gerjets, Tamara van Gog, and Michael Dorr. 2010b. How to convey perceptual skills by displaying experts’ gaze data. In Proceedings of the 31st annual conference of the cognitive science society. 2920–2925.
- Johnson (1967) Stephen C Johnson. 1967. Hierarchical clustering schemes. Psychometrika 32, 3 (1967), 241–254.
- Kanan et al. (2014) Christopher Kanan, Nicholas A Ray, Dina NF Bseiso, Janet H Hsiao, and Garrison W Cottrell. 2014. Predicting an observer’s task using multi-fixation pattern analysis. In Proceedings of the symposium on eye tracking research and applications. ACM, 287–290.
- Khedher et al. (2018) A Ben Khedher, Imène Jraidi, and Claude Frasson. 2018. Local sequence alignment for scan path similarity assessment. International Journal of Information and Education Technology 8, 7 (2018).
- Kok et al. (2016) Ellen M Kok, Halszka Jarodzka, Anique BH de Bruin, Hussain AN BinAmir, Simon GF Robben, and Jeroen JG van Merriënboer. 2016. Systematic viewing in radiology: seeing more, missing less? Advances in Health Sciences Education 21, 1 (2016), 189–205.
- Krizhevsky et al. (2012) Alex Krizhevsky, Ilya Sutskever, and Geoffrey E Hinton. 2012. Imagenet classification with deep convolutional neural networks. In Advances in neural information processing systems. 1097–1105.
- Kübler et al. (2014) Thomas C Kübler, Enkelejda Kasneci, and Wolfgang Rosenstiel. 2014. Subsmatch: Scanpath similarity in dynamic scenes based on subsequence frequencies. In Proceedings of the Symposium on Eye Tracking Research and Applications. ACM, 319–322.
- Kübler et al. (2017) Thomas C Kübler, Colleen Rothe, Ulrich Schiefer, Wolfgang Rosenstiel, and Enkelejda Kasneci. 2017. SubsMatch 2.0: Scanpath comparison and classification based on subsequence frequencies. Behavior research methods 49, 3 (2017), 1048–1064.
- Kümmerer et al. (2015) Matthias Kümmerer, Thomas SA Wallis, and Matthias Bethge. 2015. Information-theoretic model comparison unifies saliency metrics. Proceedings of the National Academy of Sciences 112, 52 (2015), 16054–16059.
- Law et al. (2004) Benjamin Law, M Stella Atkins, Arthur E Kirkpatrick, and Alan J Lomax. 2004. Eye gaze patterns differentiate novice and experts in a virtual laparoscopic surgery training environment. In Proceedings of the 2004 symposium on Eye tracking research & applications. ACM, 41–48.
- Le Meur and Baccino (2013) Olivier Le Meur and Thierry Baccino. 2013. Methods for comparing scanpaths and saliency maps: strengths and weaknesses. Behavior research methods 45, 1 (2013), 251–266.
- Liu et al. (2015) Nian Liu, Junwei Han, Dingwen Zhang, Shifeng Wen, and Tianming Liu. 2015. Predicting eye fixations using convolutional neural networks. In Proceedings of the IEEE Conference on Computer Vision and Pattern Recognition. 362–370.
- Long et al. (2015) Jonathan Long, Evan Shelhamer, and Trevor Darrell. 2015. Fully convolutional networks for semantic segmentation. In Proceedings of the IEEE conference on computer vision and pattern recognition. 3431–3440.
- Mishra and Bhattacharyya (2018) Abhijit Mishra and Pushpak Bhattacharyya. 2018. Automatic extraction of cognitive features from gaze data. In Cognitively Inspired Natural Language Processing. Springer, 153–169.
- Needleman and Wunsch (1970) Saul B Needleman and Christian D Wunsch. 1970. A general method applicable to the search for similarities in the amino acid sequence of two proteins. Journal of molecular biology 48, 3 (1970), 443–453.
- Pfeiffer et al. (2016) Thies Pfeiffer, Patrick Renner, and Nadine Pfeiffer-Lessmann. 2016. EyeSee3D 2.0: Model-based real-time analysis of mobile eye-tracking in static and dynamic three-dimensional scenes. In Proceedings of the Ninth Biennial ACM Symposium on Eye Tracking Research and Applications. ACM, 189–196.
- Rozenshtein et al. (2016) Anna Rozenshtein, Gregory DN Pearson, Sherry X Yan, Andrew Z Liu, and Dennis Toy. 2016. Effect of massed versus interleaved teaching method on performance of students in radiology. Journal of the American College of Radiology 13, 8 (2016), 979–984.
- Simonyan and Zisserman (2014) Karen Simonyan and Andrew Zisserman. 2014. Very deep convolutional networks for large-scale image recognition. arXiv preprint arXiv:1409.1556 (2014).
- Smith et al. (1981) Temple F Smith, Michael S Waterman, et al. 1981. Identification of common molecular subsequences. Journal of molecular biology 147, 1 (1981), 195–197.
- Tao and Shyu (2019) Y. Tao and M. Shyu. 2019. SP-ASDNet: CNN-LSTM Based ASD Classification Model using Observer ScanPaths. In 2019 IEEE International Conference on Multimedia Expo Workshops (ICMEW). 641–646. https://doi.org/10.1109/ICMEW.2019.00124
- Turgeon and Lam (2016) Daniel P Turgeon and Ernest WN Lam. 2016. Influence of experience and training on dental students’ examination performance regarding panoramic images. Journal of dental education 80, 2 (2016), 156–164.
- Van der Gijp et al. (2017) A Van der Gijp, CJ Ravesloot, H Jarodzka, MF van der Schaaf, IC van der Schaaf, Jan PJ van Schaik, and Th J Ten Cate. 2017. How visual search relates to visual diagnostic performance: a narrative systematic review of eye-tracking research in radiology. Advances in Health Sciences Education 22, 3 (2017), 765–787.
- Waite et al. (2019) Stephen Anthony Waite, Arkadij Grigorian, Robert G Alexander, Stephen Louis Macknik, Marisa Carrasco, David Heeger, and Susana Martinez-Conde. 2019. Analysis of perceptual expertise in radiology–Current knowledge and a new perspective. Frontiers in human neuroscience 13 (2019), 213.
- Wan et al. (2018) Qianwen Wan, Srijith Rajeev, Aleksandra Kaszowska, Karen Panetta, Holly A Taylor, and Sos Agaian. 2018. Fixation oriented object segmentation using mobile eye tracker. In Mobile Multimedia/Image Processing, Security, and Applications 2018, Vol. 10668. International Society for Optics and Photonics, 106680D.
- Wang et al. (2015) Lijun Wang, Huchuan Lu, Xiang Ruan, and Ming-Hsuan Yang. 2015. Deep networks for saliency detection via local estimation and global search. In Proceedings of the IEEE Conference on Computer Vision and Pattern Recognition. 3183–3192.
- West et al. (2006) Julia M West, Anne R Haake, Evelyn P Rozanski, and Keith S Karn. 2006. eyePatterns: software for identifying patterns and similarities across fixation sequences. In Proceedings of the 2006 symposium on Eye tracking research & applications. ACM, 149–154.