The warm-hot, extended, massive circumgalactic medium of NGC 3221: an XMM-Newton discovery
Abstract
Using Suzaku data, we had found a evidence for the X-ray emitting warm-hot circumgalactic medium (CGM) in the L⋆ galaxy NGC 3221. Here we present XMM-Newton data and outline an efficient, rigorous and well-defined method to extract the faint CGM signal. We confirm the CGM detection at significance within 30–200 kpc of the galaxy. We claim with confidence that the CGM is extended beyond kpc. The average temperature of the CGM is 2.0 K, but it is not isothermal. We find suggestive evidence for a declining temperature gradient out to 125 kpc and for super-virial temperature within 100 kpc. While a super-virial temperature component has been detected in the Milky Way CGM, this is the first time a temperature gradient has been observed in the warm-hot CGM of any spiral galaxy. The emission measure profile is well-fit with either a model or a constant density profile. Deeper data are required to constrain the temperature and density profiles. We also confirm the Suzaku result that the warm-hot CGM is one of the most massive baryon components of NGC 3221 and can account for the missing galactic baryons.
1 Introduction
It has been known from observations that the stellar and ISM (interstellar medium) components of nearby spiral galaxies account for a small fraction of their total baryons (Tumlinson et al., 2017), compared to the amount expected from the universal baryon fraction of (Planck Collaboration et al., 2016). A possible solution to this “missing baryons” problem lies in the highly ionized warm-hot circumgalactic medium (CGM) extended out to the virial radius of a galaxy, as has been predicted by theoretical models (White & Rees, 1978; Ford et al., 2014; Suresh et al., 2017). “Warm-hot” referrers to the temperature range of T– K (Cen & Ostriker, 1999), the cooler part of which (– K) is observable in the UV. The hotter part in the – K range is believed to contain most of the baryonic mass (e.g., Oppenheimer et al., 2016). This phase can be probed by highly ionized metals (e.g., O vii and O viii), the dominant transitions of which lying in the soft X-ray band. It is also imperative to define the term CGM. The CGM is generally considered to be the gaseous medium outside the disk of a spiral galaxy, extending out the virial radius, or even twice the virial radius (Oppenheimer, 2018). This region, however, is neither homogeneous nor isotropic. Strong nuclear outflows are detected out to several kpc from the disks of starburst galaxies like M82 and NGC 1482 (e.g., Strickland et al., 2004a, b, and references therein). Extra-planar diffuse emission is also detected around star-forming galaxies out to a few kpc from the disk midplane (Strickland et al., 2004a; Tüllmann et al., 2006; Yamasaki et al., 2009; Li & Wang, 2013; Bogdán et al., 2015; Hodges-Kluck et al., 2018). These are important features of galaxies, but we do not refer to them as the CGM. We call the volume filling diffuse warm-hot gaseous medium on larger scales (beyond kpc) as the CGM.
The X-ray emission from the CGM around spiral galaxies is extremely faint, which makes their detection challenging. The warm-hot CGM around the Milky Way has been detected in both emission and absorption, and it may account for the missing mass (Gupta et al., 2012, 2014; Nicastro et al., 2016b; Gupta et al., 2017; Das et al., 2019a, c). For external galaxies, however, observations become much harder. The extended CGM in X-ray emission has been securely detected only around massive galaxies (), and only out to a fraction of their virial radii, with mass insufficient to close their baryonic budget (Anderson & Bregman, 2011; Dai et al., 2012; Bogdán et al., 2013b, a; Anderson et al., 2016; Bogdán et al., 2017; Li et al., 2017, 2018).
X-ray emission from the CGM of Milky Way-type L* galaxies would be even fainter, and harder to detect. Indeed, no CGM emission is detected around any such galaxy, with the exception of NGC 3221. We observed NGC 3221 with Suzaku for a total of 120 ks exposure time; the good time interval (GTI), however, was only 41 ks. Using these Suzaku data, Das et al. (2019b) found the evidence of X-ray emitting warm-hot CGM from the region within 27–150 kpc at significance. The mass of the detected warm-hot CGM, the largest baryonic component of the galaxy system, could account for the missing galactic baryons. This is the first external L* galaxy with the evidence of an extended warm-hot CGM and baryon sufficiency.
In this paper, we present 37 ks of archival XMM-Newton data of NGC 3221. The exposure time of the XMM-Newton observation is comparable to the GTI of the Suzaku observation. Because of the larger field-of-view (FoV) and larger effective area of XMM-Newton compared to Suzaku, we can probe out to larger radii from the galactic center, and at higher S/N using XMM-Newton data. Tüllmann et al. (2006) have also presented the same XMM-Newton observation; their focus, however, was on the extraplanar emission within 20 kpc of NGC 3221. Our work instead is on the extended CGM from 30 to 200 kpc from the center of NGC 3221.
Our initial goal was to confirm our Suzaku detection of the CGM of NGC 3221, which we do. However, the XMM-Newton data have yielded exciting new results that we present in 3.4. We find, for the first time, suggestive evidence for a temperature gradient in the CGM.
Our paper is structured as follows: we describe the data reduction and spectral analysis in section 2, report the results, compare with our previous Suzaku analysis of the same galaxy, and discuss its implications in section 3. Finally, we summarize the paper and outline some of the future plans in section Acknowledgement.
2 Data reduction and analysis
Our goal is to extract and analyze the diffuse X-ray emission spectrum from the circumgalactic region of NGC 3221, observed with XMM-Newton EPIC-pn.
2.1 Data reduction
We reduce the 36.9 ks archival data (ObsID: 0202730101) using XMM-Extended Source Analysis Software (ESAS)111ftp://xmm.esac.esa.int/pub/xmm-esas/xmm-esas.pdf.
We have worked with unfiltered event files and reprocessed data using the up-to-date calibration database. Below, we outline the data reduction procedure in brief:
1) We run cifbuild and odfingest to create the new CIF file and the observation summary file, respectively.
2) Filtering: For the pn data, we run the task epchain twice, one for the on-source and one for the OoT (out-of-time) exposure to process the event lists. Then, we run pn-filter to filter the data for soft proton (SP) flares, and create assorted diagnostic files. pn-filter calls the SAS task espfilt, which creates a high-energy (2.5-8.5 keV) count rate histogram from the FoV data, fits the peak with a Gaussian, determines thresholds at , creates a good-time-interval (GTI) file for those time intervals with count rates within the thresholds, and uses the task evselect to filter the data. We examine the count-rate histogram and the light curve of the FoV and the unexposed corners to make sure that there is no visually obvious residual contamination from the soft protons. The effective exposure time (GTI) after filtering is 24.7 ks, 67% of the exposure time. It should be noted that pn-filter minimizes the SP contamination, but does not completely remove it. The residual SP contamination is modeled in the spectrum.
MOS has better spectral resolution than pn, and it would have been nice to include MOS data in our spectral analysis. For the MOS data, we run emchain and mos-filter, which have the same function as epchain and pn-filter respectively. We found that the hardness ratio in 3 CCDs of MOS1 were unusually high, i.e., these CCDs were in anomalous state. For this reason we do not use MOS1 data in further analysis. The effective area of MOS2 is smaller than pn by a factor of a few, therefore we analyze the pn data only to obtain larger photon count and hence, better signal-to-noise ratio (S/N).
3) Point source detection and excision: We detect the point sources using the routine cheese. As the effective area of pn falls off and the particle background is vary high beyond the 0.4-5.0 keV range, we detect the point sources and analyze the spectrum within this energy range. We tune the following parameters in cheese to optimize the source detection and removal:
I) For GTI 25 ks, Galactic N cm-2 toward the direction of NGC 3221 (HI4PI Collaboration et al., 2016) and an assumed = 1.7 powerlaw spectrum, the 4.5 sensitivity of pn is ergs cm-2 s-1 (Watson et al., 2001)222The appropriate limit for purely Poissonian background fluctuations to yield spurious source per field is (Watson et al., 2001). Therefore, 4.5 is a decent detectability criterion.. Therefore, the point-source flux threshold rate is changed to 0.01 from the default value 1.0 (in the unit of 10-14 ergs cm-2 s-1). This ensures that we identify sources down to 4.5 sensitivity limit.
II) The PSF threshold parameter scale is changed to 0.15 from the default value 0.25. That means the point source is removed down to a level where the point source flux is 15% of its maximum value instead of 25%. This allows us to remove a larger fraction of the point source flux. Reducing the value further down to 0.10 did not produce any noticeable difference in the size and shape of the ellipses which mark the regions contaminated by point sources.
III) Minimum separation for point sources dist is changed to 10′′ from the default value 40′′. This allows us to detect close-by sources. The on-axis PSF of Epic-pn is 12.5′′ (FWHM), thus we ensure that all the resolved sources are counted. A value smaller than 10′′ did not detect any extra sources. cheese takes into account the spatial variation of off-axis PSF over the detector plane; we do not assume or set any PSF value.
The data are carefully checked after source removal to make sure that any visibly identifiable source is not present.
Additionally, we remove a circular region of kpc radius around NGC 3221 (Figure 1), which is slightly larger than the semi-major axis of NGC 3221 in NIR (Lehmer et al., 2010). This allows us to separate the large scale diffuse X-ray emission of the CGM from the emission from the stellar disk and the extra-planar region between 5.5 kpc (the semi-minor axis of NGC 3221) and 27 kpc (the semi-major axis of NGC 3221).
2.2 Spectrum extraction
Before going into detailed spectral analysis, we study the total intensity profile in the 0.4–5.0 keV band. This includes the “X-ray background” (XRB) in this FoV which we do not have any apriori knowledge about, and the warm-hot CGM, if any.
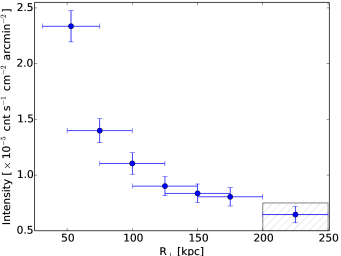
The intensity continues to fall with galactocentric radius (Figure 2). The XRB is very unlikely to show such a spatial correlation with the position of NGC 3221. This indicates the presence of the CGM. We consider the region beyond 200 kpc from NGC 3221 as “blank sky”, and the region within 200 kpc from NGC 3221 as “on-source”. By definition this assumes that there is no detectable CGM emission beyond 200 kpc of the galaxy333If the CGM is truly extended out to the virial radius or beyond, the “blank sky” would have a CGM component in it. Therefore, our CGM detection is conservative; what we measure here is the difference in the CGM brightness between the halo within 200 kpc and outside..
As noted above, the CGM emission is faint, therefore difficult to detect. For this reason, we have designed a novel approach to determine the confidence, overall detection significance and the spatial extent of the CGM. With this rigorous method, we could determine the temperature and the surface brightness profiles, even from shallow data.
We extract the “on-source” spectra from three sets of annuli:
1)Seclusive: annuli with outer radius (Rmax) at 200 kpc, and inner radii (Rmin) at 50, 75, 100, 125 and 150 kpc. To keep the solid angle and the collecting area (hence, photon count) as large as possible, Rmax is set at the largest value. If the CGM emission is detected beyond a given Rmin in an annulus, it assesses the confidence of the hypothesis that the CGM signal is present beyond that Rmin.
2)Cumulative: annuli with Rmin at 30 kpc and Rmax at 100, 125, 150, 175 and 200 kpc. As the CGM is more likely to be detected closer to the disk than at large radii (also indicated by figure 2), Rmin is set at the smallest value possible. Larger Rmax would imply larger volume, and if the CGM emission signal is present, more photons from the CGM. If the detection significance gets saturated (or decreases) beyond a given Rmax, it provides another measure of the spatial extent of the CGM. The annulus with the maximum detection significance would provide the overall detection significance.
3)Differential: annuli of width 20–25 kpc and 45–50 kpc from the region 30–200 kpc (see Table 1). This provides us the radial profiles of temperature and surface brightness.
In this way, we split the analysis in two parts: detection of the signal and physical characterization of the signal. After we are “confident” about the “significant” detection of the signal from “seclusive” and “cumulative” annuli, we extract the physical information from the “differential” annuli. This makes the detection process more efficient, while the physical characterization using differential annuli is similar to previous studies.
We extract the spectrum, RMF and ARF using pn-spectra and extract the instrumental X-ray background using pn-back for each region mentioned above. Each spectrum is binned using ftool grppha such that minimum count in each bin is 50, which gives a moderate S/N.
2.3 Analysis
The “blank sky” spectrum contains both the foreground and background components. We obtain the best fitted spectral model for the “blank sky”, and use that as the initial estimates of the “X-ray background” (XRB) while analyzing the “on-source” spectra. All spectral analyses have been performed in XSPEC.
We model the “blank sky” spectrum as a combination of 4 components: 1) Instrumental Al K line and soft proton background (SPB), 2) Local Hot Bubble (LHB), 3) Cosmic X-ray background (CXB) and 4) Galactic Halo, i.e., the warm-hot Halo of the Milky Way (MWH). This is similar to the model A of Das et al. (2019a). Note that this X-ray “background” is made of both foreground and background. As we are interested in any excess emission from the “on-source” spectrum compared to the “blank sky”, the details of the XRB model should not matter as long as the same model is used for both the “blank sky” and the “on-source” spectrum (see appendix A of Das et al. (2019a) for details of the spectral model).
The “on-source” spectrum consists of five components. The first four components are the same as those of the “blank sky” spectrum. The fifth component is the CGM emission of NGC 3221; we model it as a colliosionally ionized plasma in thermal equilibrium (apec in XSPEC) at the redshift of NGC 3221, absorbed by the Galactic ISM. The free parameters of the model are the temperature and metallicity-weighted normalization factor. We freeze the metallicity at solar. The normalization factor is anticorrelated with metallicity, so the exact value of the input metallicity does not matter as long as the scaling is taken into account while quoting the metallicity-weighted values. (see §3.2 of Das et al. (2019b) for details).
We fit each “on-source” spectrum simultaneously with the “blank sky”. The intensity of the Al K line can change at different parts of the detector plane, so we do not tie its amplitude in the “on-source” and the “blank sky” spectra. We assume that the components of XRB (LHB, CXB, MWH, SPB) of the “on-source” spectrum are quantitatively the same as those of the “blank sky”, with the normalization parameters scaled according to the ratio of projected areas of the “on-source” and the “blank sky” regions. As all spectra are extracted from the same observation and the same field, any spatial or temporal variations of the XRB are highly unlikely, thus validating our assumption.
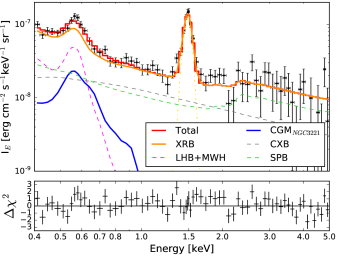
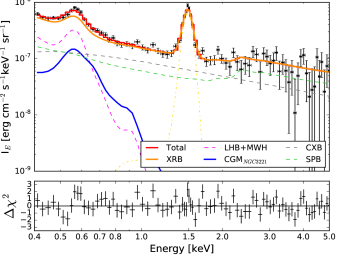
As the purpose of fitting the “seclusive” and the “cumulative” annuli is to detect the signal from the CGM, we take an agnostic approach while modeling their XRB. For each annulus, we allow the XRB to vary, but tie it between the “on-source” and the “blank sky”. Once the presence of the signal is confirmed, the XRB parameters obtained by fitting the largest annulus (30–200 kpc) are considered as the best estimate. We freeze the XRB parameters at these values while fitting the differential annuli. The best-fit spectrum in the 30–200 kpc region is shown in Figure 3.
We quantitatively measure the importance of the detection of the CGM emission from NGC 3221 in two different ways, by measuring the “confidence” and the “significance”. If excess emission from the “on-source” spectrum is required in the spectral model, we call it “confidence”. The confidence is measured by performing the F-test (XSPEC command ftest). The difference in the of the best-fitted models with/without the CGM component provides the F-statistic value and the null hypothesis probability Pnull. The confidence of the presence of the CGM, as we discuss in the following section, is (1-Pnull)%. The “seclusive” annuli are used to confirm the presence of the signal. So for them, the relevant parameter is “confidence”. The “significance”, on the other hand, refers to the statistical significance of a measured parameter. We note the “significance” of a detection only when we are “confident” that the signal is required in the spectral model (Table 1). The “cumulative” annuli are used to detect the signal. So for them, the relevant parameter is “significance”. We calculate the uncertainties of the temperature and the normalization of the CGM component using the XSPEC command err and steppar (when is not monotonic)444The values quoted in table 1 are the combination of systematic and statistical uncertainty. Systematic uncertainties are due to the XRB components, and it dominates the total uncertainty. The statistical uncertainty is larger in smaller annuli due to smaller photon count. The systematic uncertainty is larger in larger annuli because of possible variation of the XRB over the FoV. As the detection significance involves the total (systematic and statistical) uncertainty, we do not report the decomposed uncertainties to avoid complication.. We define the detection significance as the ratio of the best-fitted value of the normalization parameter and its error in the lower end. Unless explicitly mentioned otherwise, we quote uncertainties as 1 error bars, and ranges as 68% confidence intervals.
| “seclusive” annuli* | |||||
|---|---|---|---|---|---|
| Rmin | Rmax | Norm | kT | Confidence | Significance |
| [kpc] | [kpc] | [10-5cm-5] | [keV] | [%] | [S/N] |
| 50 | 200 | 8.6 | 99.97 | 3.9 | |
| 75 | 8.1 | 99.96 | 3.9 | ||
| 100 | 7.1 | 99.94 | 3.9 | ||
| 125 | 5.6 | 99.86 | 3.7 | ||
| 150 | 4.6 | 99.62 | 2.4 | ||
| “cumulative” annuli* | |||||
| Rmin | Rmax | Norm | kT | Confidence | Significance |
| [kpc] | [kpc] | [10-5cm-5] | [keV] | [%] | [S/N] |
| 30 | 100 | 1.8 | 98.11 | 2.6 (2.6) | |
| 125 | 2.8 | 98.82 | 2.8 (2.8) | ||
| 150 | 4.5 | 99.66 | 3.1 (3.4) | ||
| 175 | 7.4 | 99.95 | 3.8 (4.4) | ||
| 200 | 8.9 | 99.95 | 4.0 (4.1) | ||
| Differential annuli* | |||
|---|---|---|---|
| Rmin | Rmax | Norm | kT |
| [kpc] | [kpc] | [10-6cm-5] | [keV] |
| 30 | 50 | 1.9 | 0.20 |
| 50 | 75 | 3.9 | 0.29 |
| 75 | 100 | 27.5 | 0.15 |
| 30 | 100 | 33.3 | 0.22 |
| 50 | 100 | 31.4 | 0.21 |
| 30 | 75 | 6.1 | 0.23 |
| 75 | 125 | 23.4 | 0.16 |
| 100 | 150 | 35.6 | 0.13 |
| 125 | 175 | 40.9 | 0.14 |
| 150 | 200 | 41.8 | 0.14 |
| 125 | 200 | 50.6 | 0.17 |
*See §2.1 for definition
Values quoted in parentheses are obtained by freezing the temperature at its best-fitted value from the region 30–200 kpc.
Obtained from the area-weighted average of the emission measures (i.e. the mean of the emission integrals) at 30–50, 50–75 and 75–100 kpc.
3 Results and discussion
3.1 Detection of the CGM emission
Using the extensive spectral analysis described above, we extract the signal from the CGM of NGC 3221 with confidence from the kpc region (Table 1, first segment). This confirms that the spatial extent of the CGM is kpc. The confidence increases as Rmin gets smaller, indicating the presence of the signal throughout the volume.
Once the presence of the signal is confirmed, we determine the detection significance from the “cumulative” annuli. The significance continues to increase out to 200 kpc (Table 1, second segment), indicating that the CGM is likely extended out to 200 kpc. We detect a signal from the 30–200 kpc region (Figure 3). This confirms the detection by Das et al. (2019b), but now with a higher significance. As the temperature and the normalization are strongly anti-correlated in our fits, we calculate the marginal detection significance by freezing the temperature at its best-fit value. This escalates the detection significance to 4.4 from 30–175 kpc, and a 4.1 signal from 30–200 kpc (Table 1). This indicates that the CGM may be extended to 175 kpc instead of 200 kpc. However, given the small photon count, we do not fine-tune the spatial extent of the CGM of NGC 3221; it is clearly extended beyond 150 kpc.
3.2 Confirmation as the CGM signal
The statistical detection of the signal does not physically confirm it as the CGM of NGC 3221, because the CCDs of EPIC-pn cannot really distinguish between the redshift and the redshift of NGC 3221. However, we extract the XRB from the same field as the signal. The angular separation between the inner annulus and the ““blank sky”” corresponds to a maximum physical length of 1 kpc within the MWH. Therefore, if the detected signal is Galactic, it has to have a size 1 kpc, which is very unlikely for the diffuse medium.
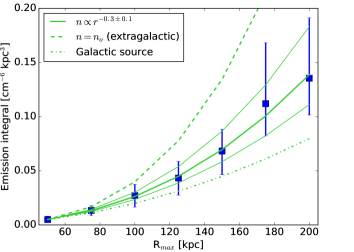
The emission integral (EI = = norm; where D is the comoving distance to the target) can be used to distinguish between the CGM of NGC 3221 and any other source of confusion. A local Galactic diffuse source would have uniform surface brightness over the field. In that case, EI will be proportional to the projected area: = (. For any extragalactic source unrelated to NGC 3221, the density will be independent of the projected distance from NGC 3221. EI will be proportional to the projected volume in this case: = . We find that the EI measurements do not agree with either of these scenarios (Figure 4). A simple power-law density profile: with is consistent with the data. The exact shape of the density profile is not relevant here, nor do we argue that the shape is a power-law. A declining density profile from the galaxy center shows that the diffuse medium is spatially correlated with NGC 3221, thus physically confirming the signal to come from the CGM of NGC 3221.
3.3 Comparison with earlier analysis
Below, we discuss our result in the context of previous findings from the same XMM-Newton data and our Suzaku data.
3.3.1 Comparison with Suzaku
Excited by the confirmed significant detection of the CGM of NGC 3221, we now perform the spectral analysis in differential annuli. First, we compare our results with those from Suzaku (Das et al., 2019b).
In Figure 5, we have plotted temperature (top panel) and EM (second and third panels) as a function of the impact parameter, together with the measurements in Das et al. (2019b). We derive the emission measure (EM) from the normalization parameter of the CGM spectrum (; where is the solid angle projected by the annulus).
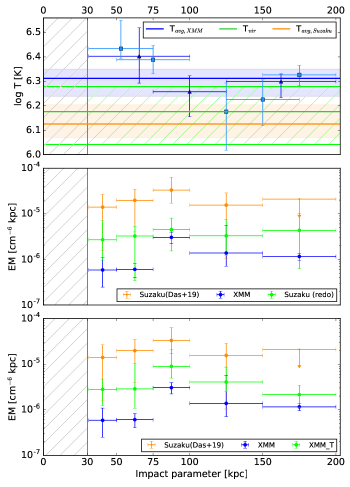
The emission measure values from XMM-Newton beyond 100 kpc are consistent with the measurement from Suzaku within error, including the upper limit. However, the EM within 100 kpc from XMM-Newton and Suzaku differ by almost an order of magnitude. As the CGM emission signal depends sensitively on the XRB, the difference in the values of EM is likely due to the difference in the XRB. Das et al. (2019b) had used two off-fields 2∘ away from the galaxy-field to estimate the XRB. Modeling the XRB from the same FoV, as we do here, would minimize the spatial variation in the XRB (most likely arising from the MWH component). To test whether the differences in EM are indeed due to differences in XRB, we re-fit the Suzaku data with the parameters of LHB and MWH frozen at their best-fitted values obtained from the XMM-Newton data. We also froze the temperature of the CGM of NGC 3221 to the best-fit XMM-Newton values and re-derived the emission measures (labeled as ‘Suzaku (redo)’ in the second panel of Figure 5). The Suzaku EM values are now closer to our measurements from XMM-Newton, and consistent within error. This shows that the same spectral model can fit both the XMM-Newton and Suzaku data; this confirms that the major difference in EM in this work and Das et al. (2019b) is due to the different XRBs used to model the spectra.
The temperature obtained from XMM-Newton and Suzaku are also significantly different within 100kpc (Figure 5, top panel). In our spectral modeling, temperature and emission measure are anticorrelated at a given metallicity. It is therefore possible that the temperature difference contributes to the differences in EM between XMM-Newton and Suzaku data. To test this, we refit the XMM-Newton data by freezing the temperature of the CGM of NGC 3221 at its best-fitted value obtained from Suzaku. The emission measures (labeled as ‘XMMT’ in the third panel of Figure 5) are now consistent with those obtained by Das et al. (2019b). This shows that the difference between the EM values in this work and Das et al. (2019b) can be explained by the difference in the XRB and the temperature of the CGM.
While the revised EM values from Suzaku are consistent with those from XMM-Newton within error, there are still residual differences, with the best-fit EM values systematically larger in Suzaku. This is likely due to following two factors:
1) Temporal variation in the foreground: The observed EM differences are possible if the XRB during the XMM-Newton observation was smaller than that during the Suzaku observation. Indeed, the solar activity and the proton flux from solar wind during XMM-Newton observation were lower than those during Suzaku data (Sekiya et al., 2014). The foreground during the Suzaku observation might therefore be higher. However, the solar wind charge exchange (SWCX) is not resolvable from LHB at the spectral resolution of Suzaku/XIS (Yoshino et al., 2009) and it is challenging to model SWCX along with other foreground components in a shallow data (Henley & Shelton, 2015). Due to the lack of “blank sky” in the galaxy-field of Suzaku, quantifying the exact contribution of SWCX in the XRB of Suzaku data is not possible. This shows how crucial it is to extract the XRB from the same observation as the target to alleviate the indefinite temporal variation of the XRB. The XMM-Newton results are not affected by the temporal variation of the XRB; these are reliable values.
2) Difference in CXB and spilled photons: The emission from unresolved extragalactic sources fainter than the detection limit of the telescope is modeled as CXB. The sensitivity of Suzaku is lower than that of XMM-Newton. Therefore, the flux down to which point sources are removed is higher in Suzaku than that in XMM-Newton. So the CXB of Suzaku and XMM-Newton are unlikely the same. Also, the size of the point source regions were same as the PSF of Suzaku/XIS (half power diameter , Das et al., 2019b), i.e., only of the flux from the point sources could be removed. However, in the XMM-Newton data we set the parameters of point source detection such that we can remove flux from the point sources (see §2.1). This makes the contamination by spilled photons outside the removed regions in XMM-Newton much smaller than that in Suzaku. The excess emission measure of the CGM measured with Suzaku compared to that in XMM-Newton can therefore be, at least partially, attributed to the different CXB and different amount of spilled photons from removed point sources.
3) SPB variation over the the detector plane: We have assumed that the SPB is uniform over the detector plane, but the ESAS manual suggests that SPB may increase toward the edge of the detector. As we have assumed a uniform SPB obtained by modeling the “blank sky”, we might overestimate the XRB and underestimate the CGM of NGC 3221 at small radii toward the center of the detector plane.
The average temperature derived from the XMM-Newton data is shown by the blue line in the top panel of Figure 5, and that from the Suzaku data is shown by the orange line. The two differ by , again because of the differences in the XRB. However, both are consistent with the virial temperature, modulo the huge uncertainty in the latter (green line in the top panel of Figure 5).
Thus the differences in the measured quantities from XMM-Newton and Suzaku data can be understood by a combination of spatial and temporal differences in the X-ray background (XRB). As the CGM signal accounts for only 10% of the data, it is very sensitive to the shape and the amplitude of the XRB.
3.3.2 Comparison with XMM-Newton
Tüllmann et al. (2006) observed NGC 3221 with the same XMM-Newton data. Since they did not detect the CGM of this galaxy while we have, it is imperative to understand why. In their imaging analysis, Tüllmann et al. (2006) performed contour mapping of the soft X-ray image of the galaxy, including the disk. The surface brightness of the disk of NGC 3221 and the foreground (local/Galactic) sources is much higher than that of the halo gas, therefore the contours were not sensitive to the faint extended emission. In our analysis, we removed the inner 30 kpc region around the galaxy (§2), and focused on the region beyond that. This ensured that the CGM X-ray emission we study is not contaminated by the galaxy itself. We have performed a detailed and intricate spectral analysis, where the “on-source” is simultaneously fitted with the “blank-sky” to estimate the X-ray background (figure 3). This was crucial in extracting the weak CGM signal, but there is no spectral analysis in Tüllmann et al. (2006). To conclude, we have detected the CGM of NGC 3221, but Tüllmann et al. (2006) did not, because of a combination of differences in data extraction and spectral analysis.
3.4 Temperature and Emission Measure Profiles
In the top panel of Figure 5, we have also plotted temperatures derived from large annuli (shown in blue triangles); these are within of the volume averaged temperature. However, the temperatures obtained from smaller annuli (shown in blue squares) are inconsistent with a constant value. We find a clear trend of temperature decreasing by half a dex from 30 to 125 kpc, and slowly increasing by a factor of 2 from 125 to 200 kpc. Thus the warm-hot CGM of NGC 3221 is approximately isothermal over the entire volume, but is not isothermal in finer details. The average temperature is consistent with the virial temperature of NGC 3221, but the temperature within 100 kpc is indicative of a super-virial temperature. Therefore, while the CGM on average is in thermal and hydrostatic equilibrium, the inner halo might deviate from that. This is an exciting new discovery from the XMM-Newton data. Such a super-virial temperature has been observed in the CGM of the Milky Way both in emission and absorption (Nakashima et al., 2018; Das et al., 2019c, a), but this is the first time we are observing it in the CGM of any external spiral galaxy. This is also the first time a temperature gradient has been observed in the CGM of any spiral galaxy. Such a gradient and deviation from virial conditions have been predicted in semi-analytic and numerical models (Maller & Bullock, 2004; Pezzulli et al., 2017), but never observed before. Given the large errors in temperature and the wide spatial bins, we do not attempt to fit a profile to the temperature gradient; much higher quality data is required for that. In Das et al. (2019b) on Suzaku data, the analysis was done only with “cumulative” annuli, and no such trend in temperature could be detected. Any temperature variation is washed out in large annuli in both XMM-Newton and Suzaku data.
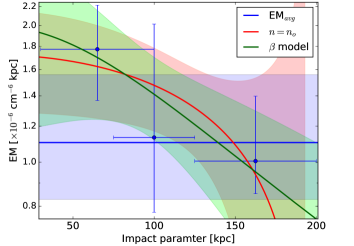
For emission measure, we consider only those values which are well-constrained; here we see a clear trend with impact parameter even in large spatial bins (Figure 6), although they are consistent with the volume average of the EM within 1. Once again, to check for the consistency with the Suzaku data,
we fit the emission measure profile with two models: (Das et al., 2019b, see their §4.3).
A) A truncated constant-density model: The best-fitted values are – density = 6.71.210-5 cm-3, spatial extent Rout = 19442 kpc (Figure 6, labeled as ). This value of Rout is consistent with R in Das et al. (2019b) and is of the order of the virial radius kpc (Hyperleda catalog, Makarov et al., 2014). Note that the constant density profile is consistent with the power-law profile of index (§3.2) within .
B) A model (Sarazin, 1986):
| (1) |
We fit the model by freezing at (Allowing to vary did not produce any significant change in Das et al. (2019b), so we do not try that here). The best-fitted values are – central emission measure = 2.00.410-6 cm-6kpc, core radius rc = 15546 kpc (Figure 6, labeled as model). The core radius is consistent with that obtained by Das et al. (2019b). Also, is consistent with within uncertainties. That implies the density is practically flat out to a large radius, consistent with the constant density (or a power-law profile with small index).
Thus we can fit the observed EM profile with either a -model, or constant density model, but we cannot determine which model better represents the data. Deeper data would allow us to obtain both the temperature and the EM at finer spatial resolution and with higher precision, thus enabling us to prefer one density model over the other.
3.5 Baryon content
In order to determine the baryon census of NGC 3221, we consider the warm-hot CGM mass (modulo metallicity), the mass of other phases of CGM, the mass of stellar and ISM components, and the virial mass.
The mass of the constant density model at solar metallicity is M⊙. At solar metallicity, the central electron density of the -model is and the mass is M⊙. The masses from two models are similar, showing that the mass measurement is convergent.
At Z⊙ metallicity (the median metallicity of cool CGM at low redshift, Prochaska et al., 2017), the mass escalates to Mhot,halo = M⊙. This is comparable with the stellar mass of NGC 3221 : M⋆ = 10.01.3 10 (Lehmer et al., 2010). By comparing Mhot,halo with other baryon components in the disk and the halo of NGC 3221 (see Table 4 of Das et al. (2019b) and references therein), we find that it is one of the most massive baryon components of the galaxy. This is consistent with the findings of Gupta et al. (2012); Nicastro et al. (2016b) in the case of the Milky Way. By adding all baryon components, we find Mb,tot = M⊙.
We estimate the virial mass Mvir of NGC 3221 from the maximum rotational velocity of the gas around the galaxy (Hyperleda catalog, Makarov et al., 2014) using baryonic Tully-Fisher relation for cold dark matter cosmology (Navarro et al., 1997), and obtain Mvir = 3.121.40 1012 M⊙.
The total baryon fraction is (statistical) (systematic). This is consistent with the cosmological baryon fraction (Planck Collaboration et al., 2016). Thus, the warm-hot CGM clearly closes the baryon budget of NGC 3221.
The uncertainty in the baryon fraction is three-fold. First, the statistical uncertainty of the detected signal is propagated to the density profile and hence, the mass of the warm-hot CGM. Second, the metallicity adds a factor of few systematic uncertainty to the mass of the warm-hot CGM. The uncertainty in the virial mass, however, is the major source of uncertainty in .
4 Summary, Conclusion and future directions
In this paper, we have outlined an efficient, rigorous and well-defined method to extract the faint signal from the CGM of a galaxy using the archival XMM-Newton data of NGC 3221. Following this method, we 1) determine the confidence-based spatial extent of the emission signal and the overall detection significance, 2) physically confirm the signal as coming from the CGM od NGC 3221, and 3) obtain the temperature and the surface brightness profiles, even from shallow data. Below, we summarize our science findings:
-
•
We have detected the warm-hot CGM of NGC 3221 from the 30–200 kpc region at significance. This confirms the 3.4 detection of the same signal by Das et al. (2019b) using Suzaku data.
-
•
The signal is detected with confidence beyond 150 kpc. This implies that the CGM is truly extended to a significant fraction of the virial radius of NGC 3221.
-
•
There is a clear temperature gradient out to 100–125 kpc, showing that the entire CGM is not isothermal. This is an exciting new result from this study. Additionally, we find that the temperature in the inner halo is super-virial.
-
•
The EM profile is not well-constrained, but is consistent with a model or with a flat density profile.
-
•
The warm-hot CGM is massive: M⊙. It is one of the most massive baryon components of NGC 3221.
Thus, we confirm the discovery of the massive extended warm-hot CGM around the first external L⋆ galaxy. It can account for all of its galactic baryons, modulo the huge uncertainty in the virial mass. Deeper data with higher S/N and finer radial bins is required to provide a well-constrained temperature and density profile, and so understand the thermal and dynamical history of the CGM.
It is essential to study the CGM of galaxies with a broad range of M⋆, SFR and Mvir to understand the key parameter governing the CGM. At present, XMM-Newton and eROSITA are the most suitable missions to detect the faint emission from the warm-hot CGM because of large effective area and large FoV. On a longer timescale, upcoming missions (e.g. XRISM, Athena) in the next decade and beyond will offer an outstanding opportunity to observe the warm-hot diffuse medium in unprecedented detail. This will bring us closer to understanding the galaxy formation and evolution.
Acknowledgement
We gratefully acknowledge the NASA grant NNX16AF49G to SM. AG acknowledges support through the NASA ADAP grant 80NSSC18K0419.
References
- Anderson & Bregman (2011) Anderson, M. E., & Bregman, J. N. 2011, ApJ, 737, 22, doi: 10.1088/0004-637X/737/1/22
- Anderson et al. (2016) Anderson, M. E., Churazov, E., & Bregman, J. N. 2016, MNRAS, 455, 227, doi: 10.1093/mnras/stv2314
- Bogdán et al. (2017) Bogdán, Á., Bourdin, H., Forman, W. R., et al. 2017, ApJ, 850, 98, doi: 10.3847/1538-4357/aa9523
- Bogdán et al. (2013a) Bogdán, Á., Forman, W. R., Kraft, R. P., & Jones, C. 2013a, ApJ, 772, 98, doi: 10.1088/0004-637X/772/2/98
- Bogdán et al. (2013b) Bogdán, Á., Forman, W. R., Vogelsberger, M., et al. 2013b, ApJ, 772, 97, doi: 10.1088/0004-637X/772/2/97
- Bogdán et al. (2015) Bogdán, Á., Vogelsberger, M., Kraft, R. P., et al. 2015, ApJ, 804, 72, doi: 10.1088/0004-637X/804/1/72
- Cen & Ostriker (1999) Cen, R., & Ostriker, J. P. 1999, ApJ, 514, 1, doi: 10.1086/306949
- Dai et al. (2012) Dai, X., Anderson, M. E., Bregman, J. N., & Miller, J. M. 2012, ApJ, 755, 107, doi: 10.1088/0004-637X/755/2/107
- Das et al. (2019a) Das, S., Mathur, S., Gupta, A., Nicastro, F., & Krongold, Y. 2019a, ApJ, 887, 257, doi: 10.3847/1538-4357/ab5846
- Das et al. (2019b) Das, S., Mathur, S., Gupta, A., et al. 2019b, ApJ, 885, 108, doi: 10.3847/1538-4357/ab48df
- Das et al. (2019c) Das, S., Mathur, S., Nicastro, F., & Krongold, Y. 2019c, ApJ, 882, L23, doi: 10.3847/2041-8213/ab3b09
- Drake (2005) Drake, S. A. 2005, in X-Ray and Radio Connections, ed. L. O. Sjouwerman & K. K. Dyer (Santa Fe, New Mexico: NRAO), 6.01
- Dubois et al. (1996) Dubois, P. F., Hinsen, K., & Hugunin, J. 1996, Computers in Physics, 10, 262, doi: 10.1063/1.4822400
- Ford et al. (2014) Ford, A. B., Davé, R., Oppenheimer, B. D., et al. 2014, MNRAS, 444, 1260, doi: 10.1093/mnras/stu1418
- Gupta et al. (2014) Gupta, A., Mathur, S., Galeazzi, M., & Krongold, Y. 2014, Ap&SS, 352, 775, doi: 10.1007/s10509-014-1958-z
- Gupta et al. (2017) Gupta, A., Mathur, S., & Krongold, Y. 2017, ApJ, 836, 243, doi: 10.3847/1538-4357/836/2/243
- Gupta et al. (2012) Gupta, A., Mathur, S., Krongold, Y., Nicastro, F., & Galeazzi, M. 2012, ApJ, 756, L8, doi: 10.1088/2041-8205/756/1/L8
- Henley & Shelton (2015) Henley, D. B., & Shelton, R. L. 2015, ApJ, 808, 22, doi: 10.1088/0004-637X/808/1/22
- HI4PI Collaboration et al. (2016) HI4PI Collaboration, Ben Bekhti, N., Flöer, L., et al. 2016, A&A, 594, A116, doi: 10.1051/0004-6361/201629178
- Hodges-Kluck et al. (2018) Hodges-Kluck, E. J., Bregman, J. N., & Li, J.-t. 2018, ApJ, 866, 126, doi: 10.3847/1538-4357/aae38a
- Hunter (2007) Hunter, J. D. 2007, Computing in Science and Engineering, 9, 90, doi: 10.1109/MCSE.2007.55
- Joye & Mandel (2003) Joye, W. A., & Mandel, E. 2003, in Astronomical Society of the Pacific Conference Series, Vol. 295, Astronomical Data Analysis Software and Systems XII, ed. H. E. Payne, R. I. Jedrzejewski, & R. N. Hook, 489
- Lehmer et al. (2010) Lehmer, B. D., Alexander, D. M., Bauer, F. E., et al. 2010, ApJ, 724, 559, doi: 10.1088/0004-637X/724/1/559
- Li et al. (2018) Li, J.-T., Bregman, J. N., Wang, Q. D., Crain, R. A., & Anderson, M. E. 2018, ApJ, 855, L24, doi: 10.3847/2041-8213/aab2af
- Li et al. (2017) Li, J.-T., Bregman, J. N., Wang, Q. D., et al. 2017, ApJS, 233, 20, doi: 10.3847/1538-4365/aa96fc
- Li & Wang (2013) Li, J.-T., & Wang, Q. D. 2013, MNRAS, 428, 2085, doi: 10.1093/mnras/sts183
- Makarov et al. (2014) Makarov, D., Prugniel, P., Terekhova, N., Courtois, H., & Vauglin, I. 2014, A&A, 570, A13, doi: 10.1051/0004-6361/201423496
- Maller & Bullock (2004) Maller, A. H., & Bullock, J. S. 2004, MNRAS, 355, 694, doi: 10.1111/j.1365-2966.2004.08349.x
- Nakashima et al. (2018) Nakashima, S., Inoue, Y., Yamasaki, N., et al. 2018, ApJ, 862, 34, doi: 10.3847/1538-4357/aacceb
- Navarro et al. (1997) Navarro, J. F., Frenk, C. S., & White, S. D. M. 1997, ApJ, 490, 493, doi: 10.1086/304888
- Nicastro et al. (2016b) Nicastro, F., Senatore, F., Krongold, Y., Mathur, S., & Elvis, M. 2016b, ApJ, 828, L12, doi: 10.3847/2041-8205/828/1/L12
- Oliphant (2007) Oliphant, T. E. 2007, Computing in Science and Engineering, 9, 10, doi: 10.1109/MCSE.2007.58
- Oppenheimer (2018) Oppenheimer, B. D. 2018, MNRAS, 480, 2963, doi: 10.1093/mnras/sty1918
- Oppenheimer et al. (2016) Oppenheimer, B. D., Crain, R. A., Schaye, J., et al. 2016, MNRAS, 460, 2157, doi: 10.1093/mnras/stw1066
- Pezzulli et al. (2017) Pezzulli, G., Fraternali, F., & Binney, J. 2017, MNRAS, 467, 311, doi: 10.1093/mnras/stx029
- Planck Collaboration et al. (2016) Planck Collaboration, Ade, P. A. R., Aghanim, N., et al. 2016, A&A, 594, A13, doi: 10.1051/0004-6361/201525830
- Prochaska et al. (2017) Prochaska, J. X., Werk, J. K., Worseck, G., et al. 2017, ApJ, 837, 169, doi: 10.3847/1538-4357/aa6007
- Sarazin (1986) Sarazin, C. L. 1986, Reviews of Modern Physics, 58, 1, doi: 10.1103/RevModPhys.58.1
- Sekiya et al. (2014) Sekiya, N., Yamasaki, N. Y., Mitsuda, K., & Takei, Y. 2014, PASJ, 66, L3, doi: 10.1093/pasj/psu007
- Snowden et al. (2004) Snowden, S., Valencic, L., Perry, B., Arida, M., & Kuntz, K. D. 2004, The XMM-Newton ABC Guide: An Introduction to XMM-Newton Data Analysis, Tech. rep., doi: https://heasarc.gsfc.nasa.gov/docs/xmm/abc/abc.html
- Strickland et al. (2004a) Strickland, D. K., Heckman, T. M., Colbert, E. J. M., Hoopes, C. G., & Weaver, K. A. 2004a, ApJS, 151, 193, doi: 10.1086/382214
- Strickland et al. (2004b) —. 2004b, ApJ, 606, 829, doi: 10.1086/383136
- Suresh et al. (2017) Suresh, J., Rubin, K. H. R., Kannan, R., et al. 2017, MNRAS, 465, 2966, doi: 10.1093/mnras/stw2499
- Tüllmann et al. (2006) Tüllmann, R., Pietsch, W., Rossa, J., Breitschwerdt, D., & Dettmar, R. J. 2006, A&A, 448, 43, doi: 10.1051/0004-6361:20052936
- Tumlinson et al. (2017) Tumlinson, J., Peeples, M. S., & Werk, J. K. 2017, ARA&A, 55, 389, doi: 10.1146/annurev-astro-091916-055240
- Watson et al. (2001) Watson, M. G., Auguères, J. L., Ballet, J., et al. 2001, A&A, 365, L51, doi: 10.1051/0004-6361:20000067
- White & Rees (1978) White, S. D. M., & Rees, M. J. 1978, MNRAS, 183, 341, doi: 10.1093/mnras/183.3.341
- Yamasaki et al. (2009) Yamasaki, N. Y., Sato, K., Mitsuishi, I., & Ohashi, T. 2009, PASJ, 61, S291, doi: 10.1093/pasj/61.sp1.S291
- Yoshino et al. (2009) Yoshino, T., Mitsuda, K., Yamasaki, N. Y., et al. 2009, PASJ, 61, 805, doi: 10.1093/pasj/61.4.805