SDSS-IV MaNGA: Stellar population correlates with stellar root-mean-square velocity gradients or total-density-profile slopes at fixed effective velocity dispersion
Abstract
Galaxy properties are known to correlate most tightly with the galaxy effective stellar velocity dispersion . Here we look for additional trends at fixed using 1339 galaxies ( M⊙) with different morphologies in the MaNGA (DR14) sample with integral-field spectroscopy data. We focus on the gradients () of the stellar root-mean-square velocity (), which we show traces the total mass density gradient derived from dynamical models and, more weakly, the bulge fraction. We confirm that increases with , age and metallicity. We additionally find that these correlations still exist at fixed , where galaxies with larger are found to be older and more metal-rich. It means that mass density gradients contain information of the stellar population which is not fully accounted for by . This result puts an extra constraint on our understanding of galaxy quenching. We compare our results with galaxies in the IllustrisTNG hydrodynamical simulations and find that, at fixed , similar trends exist with age, the bulge fraction, and the total mass density slope but, unlike observations, no correlation with metallicity can be detected in the simulations.
keywords:
galaxies: formation – galaxy: evolution – galaxy: kinematics and dynamics – galaxies: structure1 Introduction
Galaxy properties have already been found to strongly correlate with their morphologies. One of the quantities that are used to describe the morphology of galaxies is the bulge fraction. However, the photometric bulge-disk decomposition is a complex process, which depends on the extraction details and suffers from degeneracies (Cappellari et al. 2013b, hereafter C13b). Due to the degeneracies of projection, the intrinsic 3D stellar density cannot be uniquely recovered from the 2D images unless the galaxies are edge-on, even if we assume galaxies are axisymmetric (Rybicki, 1987; Gerhard & Binney, 1996; van den Bosch, 1997; Magorrian et al., 1998). The fact that one cannot infer the intrinsic density of inclined galaxies implies that one cannot uniquely decompose their bulges and disks of inclined galaxies () unless we know the galaxies to be accurately described by Sersic (1968) bulges and exponential disks (Freeman, 1970). Cappellari et al. (2011) used the kinematic morphology (i.e. fast and slow rotators) to study the relation between galaxy type and the environment density (i.e. the relation), instead of using classic morphology (i.e. lenticulars and ellipticals). It is found that the relation is cleaner when the kinematic morphology is adopted. It implies that combining dynamical properties may be beneficial for analyzing the structure of galaxies. In C13b, (the velocity dispersion within the half-light radius ) is shown to be related to the bulge fraction of galaxies (see fig. 5 of C13b).
Cappellari et al. (2006) found that the stellar mass-to-light ratio , which is related to the stellar population, tightly correlates with rather than mass or . Similarly, Graves et al. (2009) used the Fundamental Plane to conclude that no stellar population property shows any dependence on at fixed . The primary role of in driving variations in both the stellar population indicators (, colors, and line indices) and the molecular gas content was clearly demonstrated by C13b and with population models by McDermid et al. (2015) using the high-quality data from the ATLAS3D survey. The latter ATLAS3D works showed that all population and gas content indicators closely follow lines of constant on the mass-size plane. It indicates that , which traces the bulge fraction, is the main driver for the observed trends of the stellar population properties on the mass-size plane. This result is verified with a larger sample of galaxies with different morphologies from SAMI (Scott et al., 2017, 1319 galaxies) and MaNGA (Li et al., 2018, galaxies).
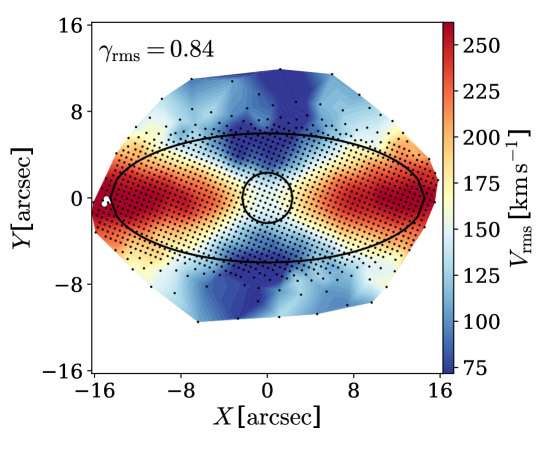
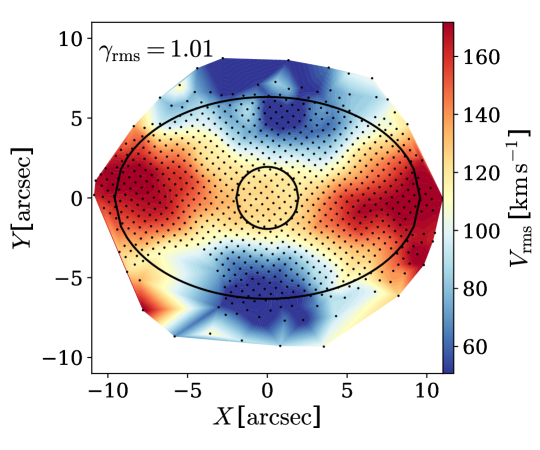
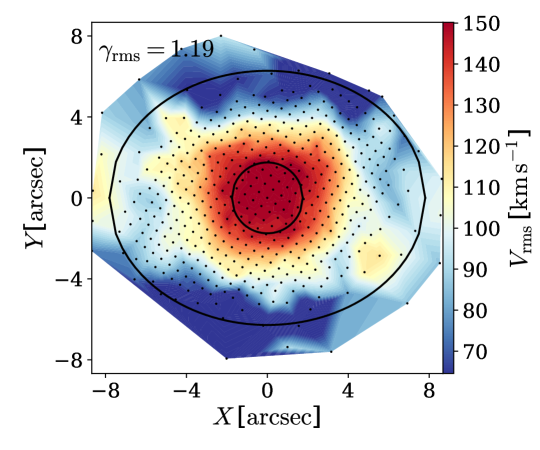
Given that galaxy properties correlate with and that this in turn appears related to the galaxies bulge fraction, or the steepness of the total density profile, it is natural to ask whether other quantities contain extra information on the population that is not already contained in alone. More specifically, we want to see whether there is a residual correlation of stellar population properties with the root-mean-aquare velocity (, where and are the mean line-of-sight velocity and dispersion) profile at fixed . In C13b, the shape of map is proved to have the ability to trace the bulge fraction at even low inclinations (close to face-on, , see fig. 4 of C13b). The gradient of (defined there as , where is the velocity dispersion within ), which encodes key information of the shape of the map (see Fig. 1 for some examples of the maps of MaNGA galaxies), is found to have similar distribution as stellar population properties on the mass-size plane, which implies the correlations between the gradient of and stellar populations. Notice that both , , and in later text (see Eq. 2) are all luminosity-weighted , not purely dispersion in given apertures (see Eq. 3 for definition). However the ATLAS3D sample only contains 260 galaxies and does not allow one to asses whether a residual trends exists at fixed , due to the small-numbers statistics (see Cappellari 2016 for a review).
With the advancement of the largest Integral Field Unit (IFU) survey MaNGA (Bundy et al., 2015), we are able to study the underlying relations between the kinematics and the stellar populations in detail with a sufficiently large number of galaxies with different morphologies. The goals of this paper are: (i) to investigate the correlations between the gradient of and galaxy properties (i.e. age, metallicity, the bulge fraction, and the steepness of total mass profile); (ii) to examine whether the correlations still exist at fixed which has not been addressed before; (iii) to compare with the state-of-the-art hydrodynamical simulations, the IllustrisTNG simulations (Marinacci et al., 2018; Naiman et al., 2018; Nelson et al., 2018; Pillepich et al., 2018; Springel et al., 2018).
This paper is organized as follows. In Section 2, we describe our sample selection in MaNGA (Section 2.1) and IllustrisTNG simulations (Section 2.2). The general property of the gradient is presented in Section 3.1. Section 3.2 is devoted to presenting the correlations between the gradient of and galaxy properties. In Section 3.3, we investigate the relations between the gradient of and galaxy properties at fixed . Finally, we summarize our findings in Section 4.
2 Data
2.1 MaNGA galaxies
The galaxies in this study are from the MaNGA sample released by SDSS DR14 (Abolfathi et al., 2018), which includes 2778 galaxies with different morphologies. We note here that we do not use the latest data release of MaNGA because we want our results to rely on published data (i.e. stellar population and structural properties) from other papers. The kinematical data are extracted from the IFU spectra using the MaNGA data analysis pipeline (DAP; Westfall et al. 2019) by fitting absorption lines, making use of the ppxf software (Cappellari & Emsellem, 2004; Cappellari, 2017) with a subset of the MILES (Sánchez-Blázquez et al., 2006; Falcón-Barroso et al., 2011) stellar library, MILES-THIN. Before fitting, the spectra are Voronoi binned (Cappellari & Copin, 2003) to . Readers are referred to the following papers for more details on the MaNGA instrumentation (Drory et al., 2015), observing strategy (Law et al., 2015), spectrophotometric calibration (Smee et al., 2013; Yan et al., 2016a), and survey execution and initial data quality (Yan et al., 2016b).
We exclude the galaxies which are merging or have low data quality (with fewer than 100 Voronoi bins with greater than 10) from our sample. Besides, we exclude galaxies with low stellar mass () to achieve a comparable minimum stellar mass as in C13b. The stellar mass of MaNGA galaxies is derived from Salim et al. (2016, table 1), in which the state-of-the-art spectral energy distribution (SED) fitting of UV and optical fluxes is adopted. After excluding the galaxies described above, we have 1520 galaxies with different morphologies. We derive the stellar population properties (i.e. age and metallicity) from Li et al. (2018, see their online table A1), which are calculated as the luminosity-weighted values within an elliptical aperture of area . We use the mass-weighted total density slope () from Li et al. (2019, a subset111Readers need to cite () if they want to use the total density slope in this work. of the values for our galaxies is included in Table 1) to describe the total mass profiles of galaxies (see Li et al. 2019, eq. 2 for definition). The bulge-to-total luminosity ratio () is from Simard et al. (2011, table 1). After cross-matching these four catalogs, we have 1339 galaxies with available galaxy properties in our final sample. The size parameters (i.e. the half-light radius and the major axis of the half-light isophote ) used in this work are calculated from the Multi-Gaussian Expansion (MGE) models (Emsellem et al., 1994) with the fitting algorithm and python software222The software is available from http://www-astro.physics.ox.ac.uk/~mxc/software by Cappellari (2002) and are scaled by a factor of 1.35 (see fig. 7 of Cappellari et al. 2013a).
2.2 Galaxies in hydrodynamical simulations
For comparison, we also select a sample of simulated galaxies with the same stellar mass range () at from the state-of-the-art magneto-hydrodynamic cosmological galaxy formation simulations, the IllustrisTNG simulations333http://www.tng-project.org (TNG hereafter; Marinacci et al. 2018; Naiman et al. 2018; Nelson et al. 2018; Pillepich et al. 2018; Springel et al. 2018). In this work, we use its full-physics version with a cubic box of side length (TNG100) which has been made publicly available (Nelson et al., 2019). The mass resolutions of the TNG100-full physics version for baryonic and dark matter are and , with a gravitational softening length of . Gas cells are resolved in a fully adaptive manner with a minimum softening length of comoving . All selected galaxies are central galaxies whose host dark matter subhaloes are identified by the subfind algorithm (Springel et al., 2001; Dolag et al., 2009). Thus, we have 5105 simulated galaxies in our sample.
To derive stellar population properties of simulated galaxies, we first project them along the X-axis of the simulation box to produce mock images in the SDSS -band (Stoughton et al., 2002) filter. We then use the MGE method to obtain their size parameters as for real galaxies. The age and metallicity of TNG galaxies are calculated as luminosity-weighted and within an elliptical aperture of area using the equation below:
| (1) |
where is (or ) of the -th particle within this elliptical aperture, and is the SDSS -band luminosity of the -th particle. The bulge-to-total ratio of TNG galaxies is from Xu et al. (2019). We refer the readers to Xu et al. (2017) for detailed descriptions of galaxy property extraction. The total mass density slopes of TNG galaxies are from Li et al. (2019). All these related properties of TNG galaxies can be derived from the journal website and readers are required to cite Xu et al. (2019) if they need to use the bulge fraction in this work.
We note here that we want to make an impeccable comparison with the IllustrisTNG simulations, and as a result, we exclude the galaxies with low stellar mass () in MaNGA. This mass limit roughly matches the mass cutoff of the IllustrisTNG simulations (, below which the galaxies may not be sufficiently resolved). We have also examined our results with all qualified galaxies in MaNGA regardless of their stellar masses and find our results remain unchanged.
3 Results
In this section, we first present the distribution of the gradient of in Section 3.1. Then we show the relations between the gradient of and galaxy properties (i.e. , , , and ) in Section 3.2. Section 3.3 is devoted to presenting the relation between the gradient of and galaxy properties at fixed .
3.1 The gradient of
Similarly to C13b, we define the gradient of as:
| (2) |
is the luminosity-weighted within an elliptical aperture of area and is calculated as:
| (3) |
where and are the mean velocity and dispersion in the -th IFU spaxel, and is the flux in the -th spaxel. The sum is within the elliptical aperture described above. is calculated in the same way but the sum is within a circular aperture with radius of (see Fig. 1 for examples). The and so defined agree closely with the velocity dispersions measured from a single fit to the spectrum inside the same apertures in C13b (Li et al., 2018). If a galaxy has , that means there is a decrease of from the inner to the outer region of this galaxy. We note here that due to the limitation of spatial resolution in MaNGA, we use a larger ( instead of ) aperture for the central velocity dispersion compared to that in C13b. We show some examples of the maps of MaNGA galaxies in Fig. 1, from which we can see an obvious change of the map shape from low to high (see Section 3.2 for more detailed discussion). Part of the quantitative results are listed in Table 1. For simulated galaxies, is used to approximate the .
Due to the effect of seeing, we have tried to only use galaxies with , where is the typical value of seeing in MaNGA (see Bundy et al. 2015 for more information of technical details of MaNGA), which constitute about half of our current sample (red circles with green dots in the center in Fig. 3 and Fig. 4). Our main results are found to be unchanged with only large galaxies. Besides, we have also tried to use the linear slopes of profiles ( versus ) to describe the gradient of . We first divide the galaxies into several elliptical annuli from to , with the global ellipticity measured around . Then we calculate the median value of in each annulus and perform a linear fit to get the linear slopes. We find that our main results remain unchanged when the new gradient is adopted.
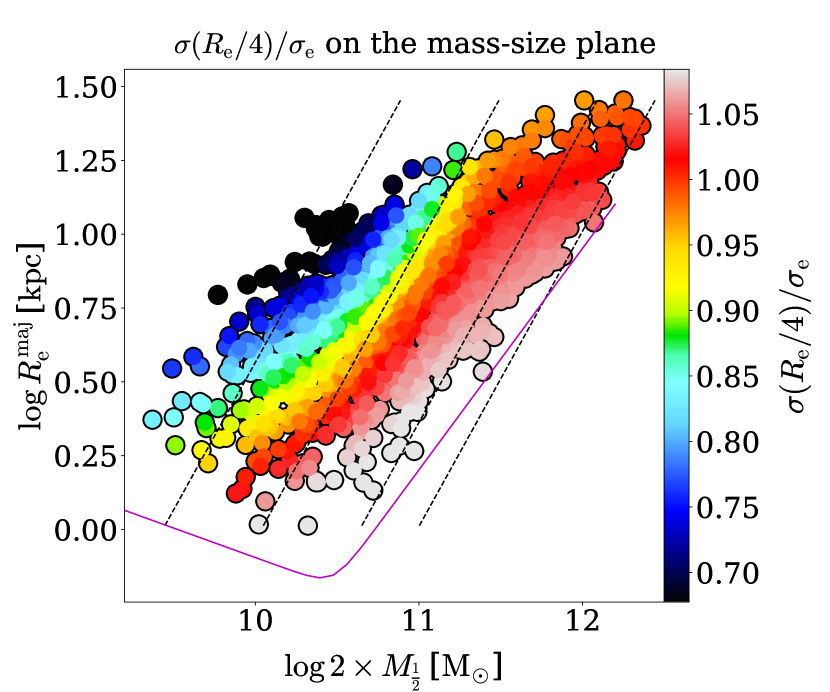
We show the distribution of () on the - plane (the ‘mass-size plane’) in Fig. 2, where is the enclosed total mass within a spherical aperture of the three-dimensional half-light radius. The here is from Li et al. (2018) which is derived using the Jeans anisotropic model (JAM) (Cappellari, 2008). Before plotting, we make use of the python implementation444The software is available from https://pypi.org/project/loess/ (see details in C13b) of the two-dimensional Locally Weighted Regression (LOESS) (Cleveland & Devlin, 1988) method to obtain smoothed distribution of . As can be seen, the gradient of varies systematically roughly along the direction, which is consistent with the result in C13b (the top panel of their fig. 6) in which is used. We note here that due to the fact that we use a different definition of the gradient of from C13b and our samples include late-type galaxies which typically have lower , the smoothed values obtained with the LOESS method in this figure are somehow lower than those in C13b.
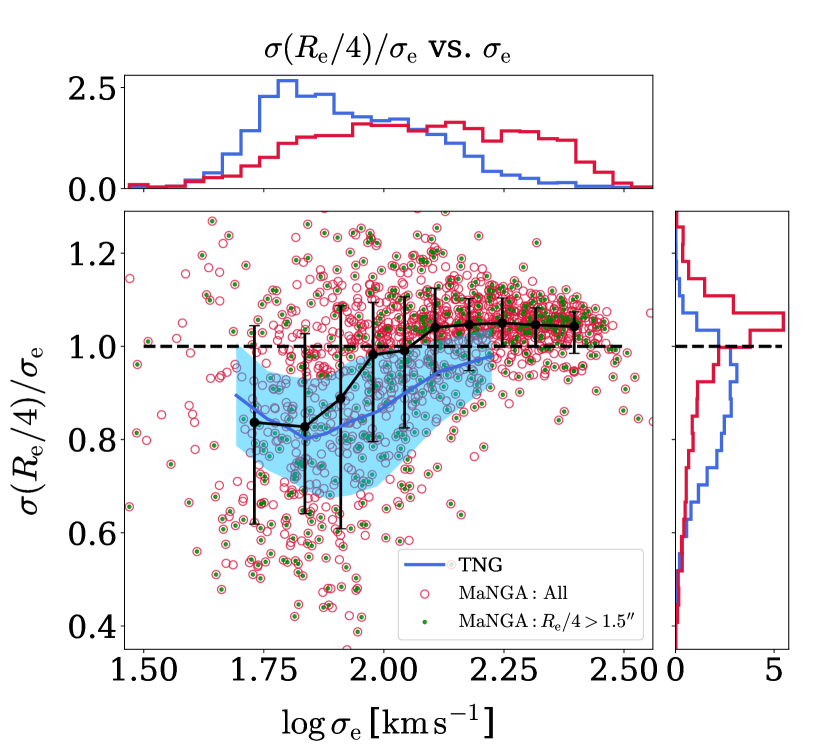
To better illustrate the correlation between and , we present Fig. 3. As shown in the figure, of MaNGA galaxies increases with from (at low ) to (at high ). The transition point , which corresponds to a flat profile, is at . For , the trend becomes flatter and stays at , indicating a mild decrease of from the central region of galaxies to the outer part. As demonstrated in C13b (fig. 5), galaxies with have maps in butterfly-like shapes with small bulges in the center, after which the peak of in the center gets stronger, indicating a rising bulge fraction. It implies that the relation between the gradient of and the bulge fraction saturates when this is larger than a threshold. In the idealized case in which the bulge and disk have fixed parametrization (e.g. exponential and Sérsic profiles), this can be qualitatively understood as due to the fact that, when the bulge dominates, the gradient must converge to that of the bulge alone. The most massive galaxies (), which also have large , tend to be slow rotators without disks. For those galaxies, and the coincides with the , which has a characteristic decreasing radial profile with radius. This is illustrated in Fig. 4, in which increases with and levels off when (see Section 3.2 for a detailed description). This trend in with is similar with the trend in total density slope found by Poci et al. (2017) and Li et al. (2019), which also shows a near constant trend above and a break, and an increase in , below that transition value (see fig.1 of Li et al. 2019). The key difference is that is a purely empirical quantity, which does not involve dynamical models. As a comparison, however, TNG galaxies show a decreasing trend at low end and do not show a flat tail at high end. Besides, most () TNG galaxies have , relative to in MaNGA, and of TNG galaxies is typically lower than MaNGA galaxies. This may be due to the overly-strong AGN feedback (typically the isotropic black hole kinetic winds in the AGN quiescent phase) in IllustrisTNG for puffing up the galaxies (Wang et al., 2019, 2020; Lu et al., 2020).
| MaGNA ID | ||||||
|---|---|---|---|---|---|---|
| [] | [] | [] | [] | |||
| 1-24295 | 0.85 | 0.85 | 2.27 | 2.16 | 1.05 | 1.95 |
| 1-260743 | 0.78 | 0.79 | 2.44 | 2.42 | 1.01 | 2.06 |
| 1-115128 | 0.90 | 1.07 | 1.83 | 1.97 | 0.93 | 1.83 |
| 1-258820 | 1.11 | 1.25 | 1.09 | 1.87 | 0.59 | 1.14 |
| 1-251662 | 0.76 | 0.78 | 2.24 | 1.98 | 1.13 | 1.78 |
| 1-637825 | 1.05 | 1.14 | 1.53 | 1.92 | 0.80 | 1.62 |
| 1-23877 | 1.02 | 1.31 | 1.70 | 2.09 | 0.82 | 1.60 |
| 1-109521 | 0.85 | 0.91 | 2.32 | 2.28 | 1.02 | 2.02 |
| 1-321967 | 0.39 | 0.45 | 1.88 | 1.88 | 1.00 | 1.74 |
| 1-147685 | 0.88 | 1.28 | 0.82 | 1.95 | 0.42 | 0.73 |
| 1-547185 | 0.93 | 0.99 | 1.76 | 1.83 | 0.96 | 1.84 |
| 1-38550 | 1.15 | 1.21 | 1.82 | 1.84 | 0.99 | 1.53 |
| 1-351790 | 0.62 | 0.73 | 1.56 | 1.66 | 0.94 | 1.50 |
| 1-258315 | 0.85 | 0.89 | 1.75 | 1.87 | 0.94 | 1.71 |
| 1-95770 | 0.85 | 0.95 | 1.64 | 1.87 | 0.88 | 0.98 |
| 1-22347 | 0.46 | 0.49 | 2.00 | 1.98 | 1.01 | 1.89 |
| 1-135091 | 0.87 | 0.94 | 2.28 | 2.22 | 1.02 | 2.05 |
| 1-260541 | 0.89 | 0.90 | 2.63 | 2.39 | 1.10 | 2.10 |
| 1-93908 | 0.85 | 0.91 | 2.58 | 2.33 | 1.11 | 2.35 |
| 1-275354 | 0.93 | 1.04 | 1.56 | 1.81 | 0.86 | 1.57 |
| 1-339116 | 0.67 | 0.81 | 1.34 | 1.81 | 0.74 | 1.30 |
| 1-167392 | 0.51 | 0.64 | 1.25 | 1.79 | 0.70 | 0.49 |
| 1-174036 | 0.78 | 0.82 | 2.27 | 2.37 | 0.95 | 1.80 |
| 1-55552 | 0.76 | 0.81 | 2.44 | 2.27 | 1.07 | 2.18 |
| 1-24476 | 0.96 | 1.05 | 2.19 | 2.08 | 1.05 | 2.01 |
| 1-545674 | 1.27 | 1.43 | 1.38 | 1.75 | 0.79 | 0.64 |
| 1-251278 | 0.66 | 0.70 | 2.54 | 2.35 | 1.08 | 2.20 |
| 1-594505 | 0.93 | 0.93 | 2.40 | 2.23 | 1.08 | 2.37 |
| 1-167334 | 0.60 | 0.68 | 2.06 | 2.00 | 1.03 | 2.39 |
| 1-217557 | 0.53 | 0.58 | 2.22 | 2.08 | 1.07 | 2.52 |
| 1-245908 | 0.57 | 0.68 | 1.99 | 1.95 | 1.02 | 1.96 |
| 1-44047 | 0.32 | 0.42 | 1.98 | 2.11 | 0.94 | 1.80 |
| 1-210667 | 1.12 | 1.25 | 1.64 | 1.76 | 0.93 | 1.28 |
| 1-73638 | 0.87 | 1.04 | 2.06 | 2.28 | 0.90 | 1.88 |
| 1-256465 | 0.61 | 0.66 | 2.38 | 2.28 | 1.04 | 2.42 |
| 1-114171 | 0.73 | 0.79 | 2.60 | 2.45 | 1.06 | 2.26 |
| 1-210961 | 0.58 | 0.86 | 1.89 | 2.03 | 0.93 | 2.16 |
| 1-217650 | 0.82 | 0.85 | 1.92 | 1.89 | 1.02 | 1.94 |
| 1-166739 | 0.83 | 0.88 | 2.40 | 2.32 | 1.04 | 2.26 |
| 1-164007 | 0.47 | 0.60 | 2.05 | 2.04 | 1.01 | 1.90 |
| 1-245940 | 0.91 | 1.03 | 2.36 | 2.52 | 0.93 | 2.03 |
| 1-274506 | 0.86 | 0.93 | 0.84 | 1.65 | 0.51 | 0.50 |
| 1-156011 | 0.75 | 0.75 | 2.57 | 2.09 | 1.23 | 2.31 |
| 1-210116 | 1.18 | 1.23 | 1.93 | 1.94 | 1.00 | 1.72 |
| 1-180208 | 0.55 | 0.67 | 2.44 | 2.27 | 1.07 | 2.90 |
| 12-84674 | 0.99 | 1.00 | 1.77 | 1.72 | 1.03 | 1.41 |
| 1-96075 | 1.05 | 1.11 | 1.82 | 2.07 | 0.88 | 1.61 |
| 1-23786 | 0.84 | 0.98 | 1.06 | 1.81 | 0.59 | 0.87 |
| 1-36977 | 0.78 | 0.81 | 2.20 | 2.12 | 1.04 | 2.00 |
| 1-457009 | 0.87 | 0.91 | 1.91 | 1.79 | 1.07 | 1.44 |
| 1-43272 | 0.47 | 0.53 | 1.57 | 1.81 | 0.87 | 1.22 |
| 12-84627 | 0.82 | 1.01 | 1.51 | 2.05 | 0.74 | 1.76 |
| 1-29726 | 0.68 | 0.77 | 2.55 | 2.44 | 1.04 | 2.28 |
| 1-38398 | 1.00 | 1.30 | 1.53 | 1.95 | 0.79 | 1.48 |
| 1-492524 | 0.79 | 1.03 | 1.69 | 1.83 | 0.92 | 1.67 |
| 1-273861 | 0.41 | 0.42 | 2.20 | 2.11 | 1.04 | 2.25 |
| 1-384548 | 0.43 | 0.56 | 2.33 | 2.22 | 1.05 | 2.56 |
3.2 vs. galaxy properties
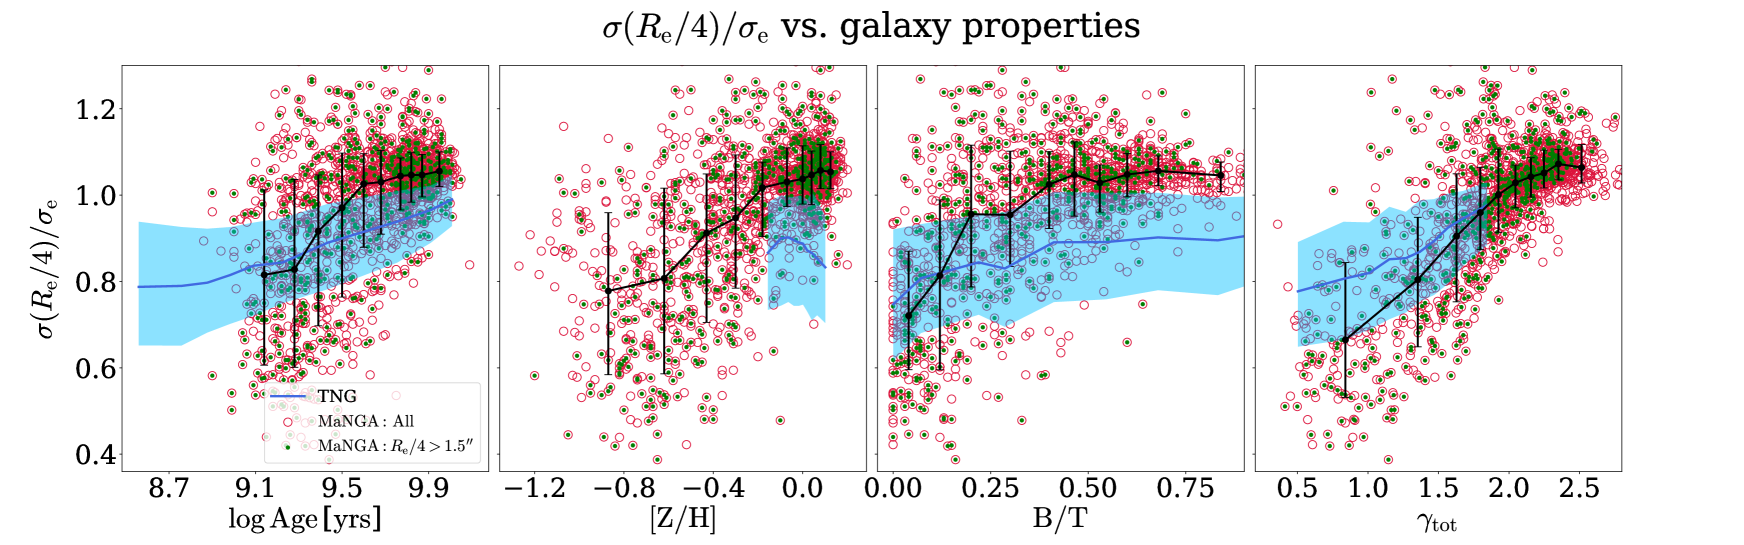
To investigate the relation between the gradient and galaxy properties (i.e. the stellar age, metallicity, the total density slope, and the bulge fraction), we present Fig. 4. As can be seen, of MaNGA galaxies increases with and , indicating that older and more metal-rich galaxies are more likely to have flatter or even declining profiles. For TNG galaxies, shows a shallower correlation with , while it does not show an obvious correlation with . We note here that TNG lacks galaxies with low metallicity which results in the narrower range of metallicity.
Regarding the galaxy structural parameters, one can note that () increases with bulge fraction until , but flattens for larger values. This implies that either is not a good indicator of bulge fraction for nearly pure spheroids (see also Section 3.1), or that extreme bulge fractions are more difficult to measure from photometry. For the total density slope , which is defined as (Dutton & Treu, 2014, eq. 1):
| (4) |
where is total mass density of the galaxy and is the total mass enclosed in a sphere with radius (Li et al., 2019), the gradient of rises across the whole range of . It means that the steeper the mass profile, the more likely the profile to be flat or even declining. of galaxies which are isothermal () is , indicating that flat profiles are exsitent in these galaxies. A purely isothermal spherical isotropic galaxy has constant (Binney & Tremaine 2008, denoted by in their eq. 4.100), while in this work, the same correspondence between and flat profile also works in our non-spherical case. By contrast, TNG galaxies show a gradually increasing but somehow shallower trend of towards the high and high end.
3.3 Relations at fixed
The results in Section 3.2 are generally consistent with the previous studies (Cappellari et al., 2013b; Scott et al., 2017; Li et al., 2018), in which stellar age, metallicity, and the gradient of are found to have similar distributions on the mass-size plane, indicating a correlation among them. However, it is still unclear whether the relations are only driven by , or in other words, whether the gradient of still correlates with galaxy properties at fixed .
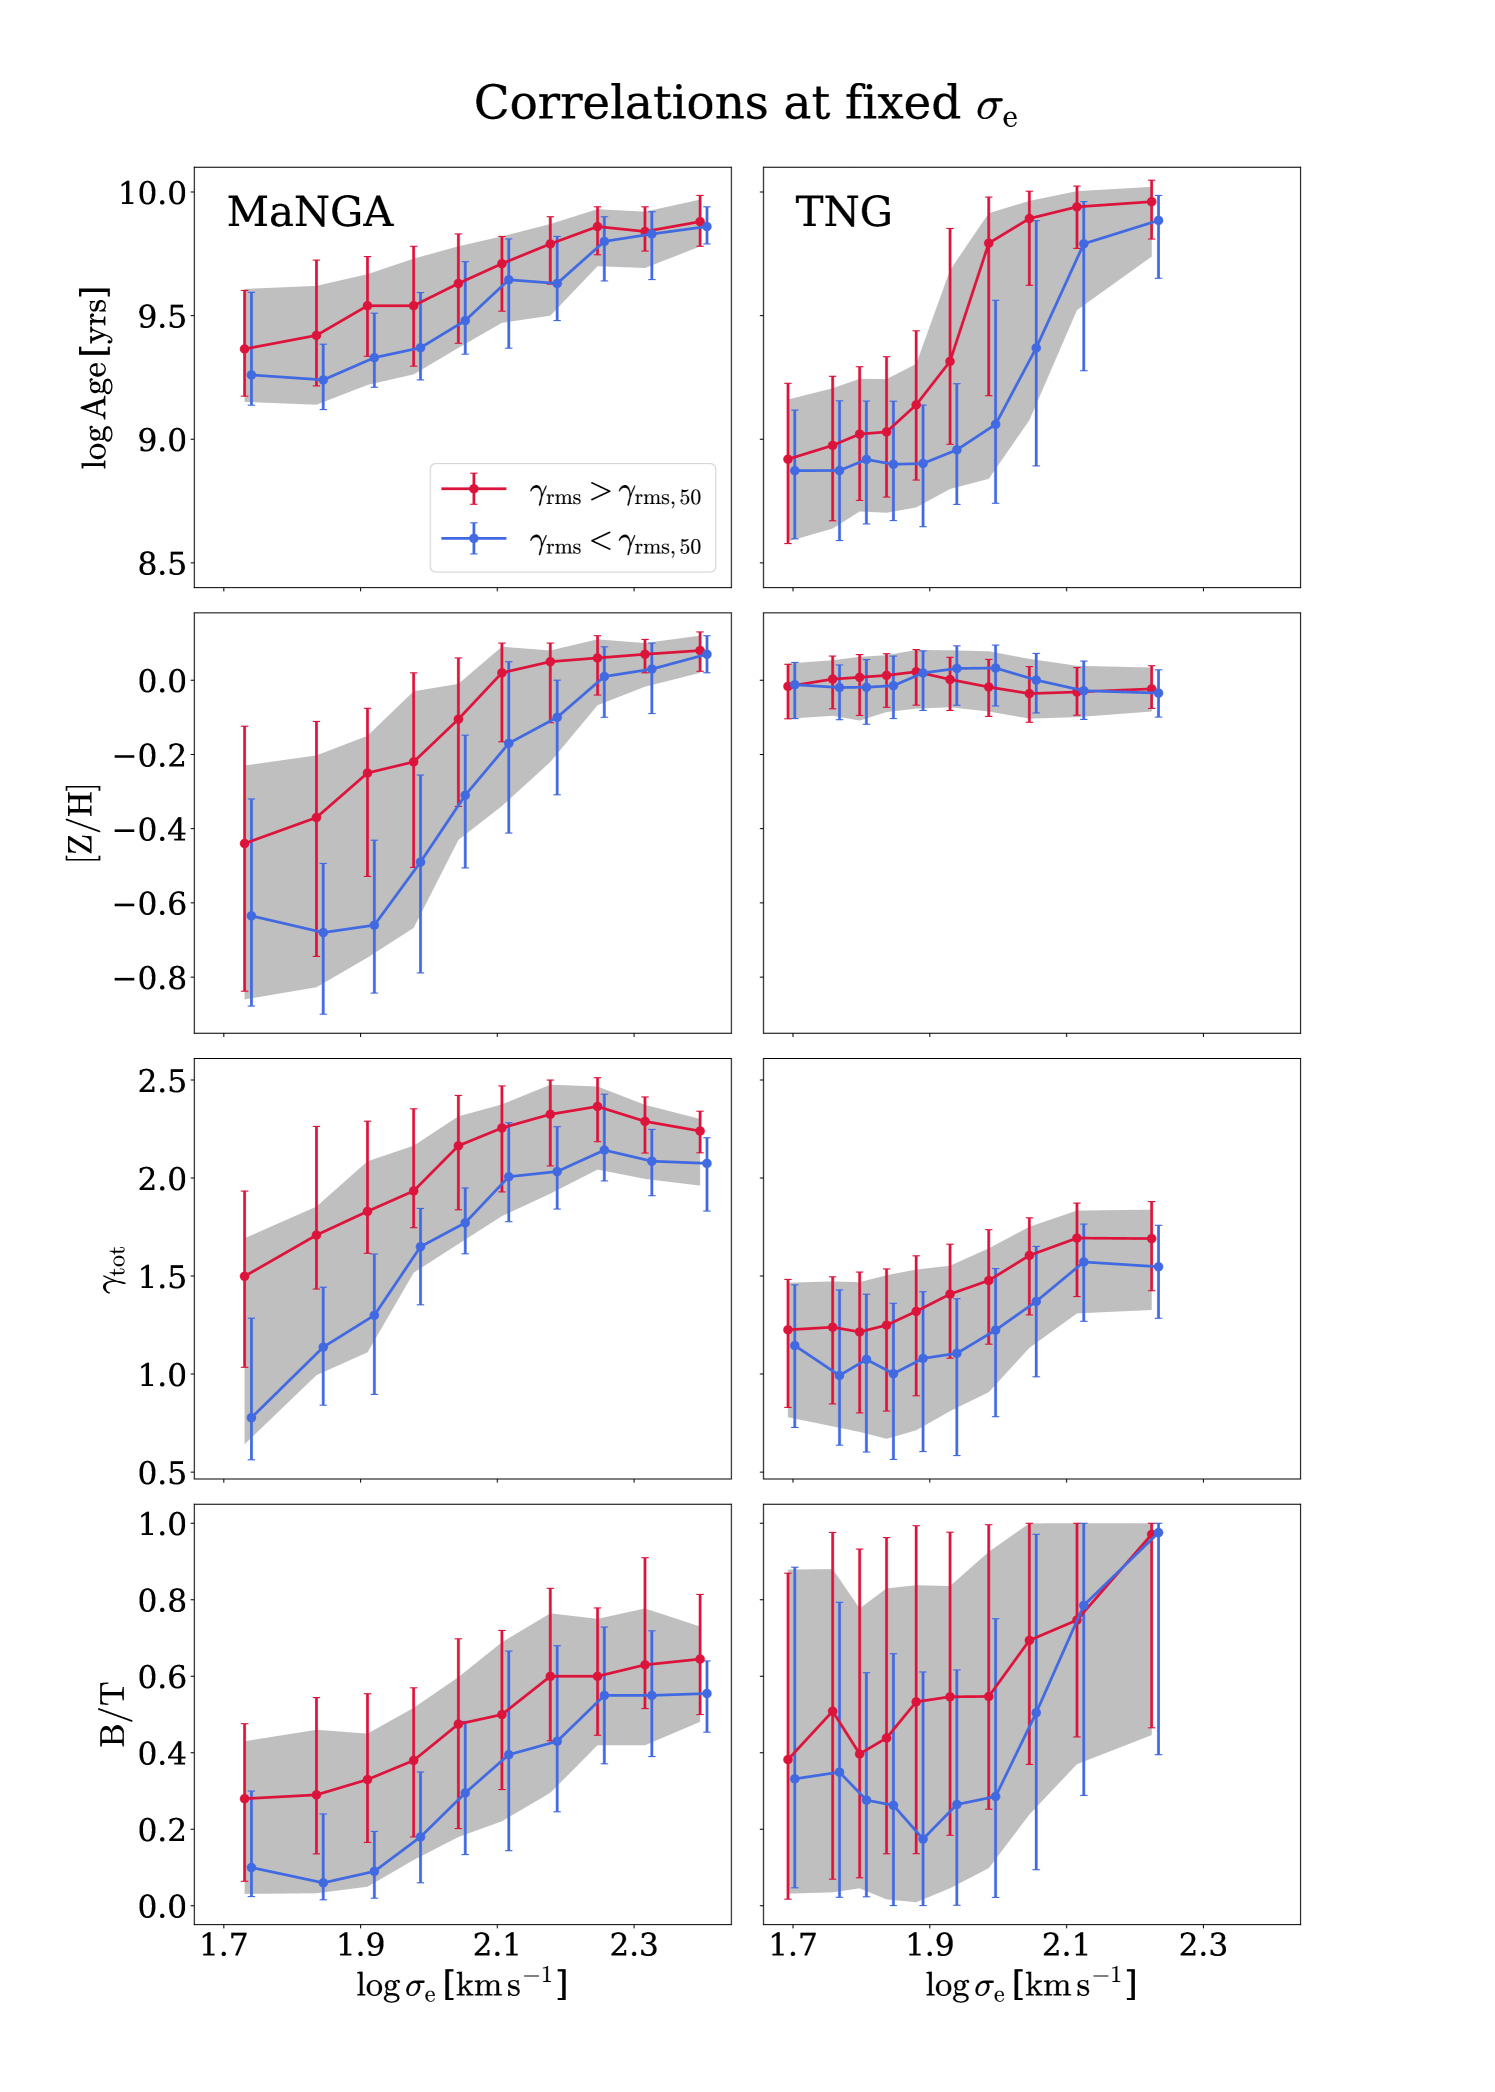
To answer this question, we first divide galaxies in our sample into 10 bins according to their , with the same number of galaxies in each bin. Then galaxies in each bin are further divided into two subgroups according to their gradient ( and , where is the median value of in each bin). Finally, we calculate the median values of galaxy properties for galaxies of both two subgroups in each bin.
Fig. 5 shows the trends of galaxy properties as a function of for both subgroups ( and ). It can be clearly seen that, although with large scatters, MaNGA galaxies with different gradients () appear to show systematic differences between each other. At fixed , galaxies with larger (red lines) are typically older, more metal-rich, more bulge-dominated, and have steeper mass profiles.
To quantitatively describe the discrepancy between the two subgroups ( and ), we employ a statistical analysis to estimate the probability of the difference being statistically significant. Thus, we set our null hypothesis to be: the two subgroups ( and ) do not have systematic difference in age (or other parameters). In the -th bin, if the discrepancy we see for the two subgroups arises by chance, the age (or other investigated parameters) difference should follow a normal distribution with its mean value being 0 and its variance being the combination of the errors of the two subgroups:
| (5) |
where and are the standard deviations of age (or other parameters) of the two subgroups in -th bin. We randomly sample from the 10 (the number of bins) normal distributions, and define:
| (6) |
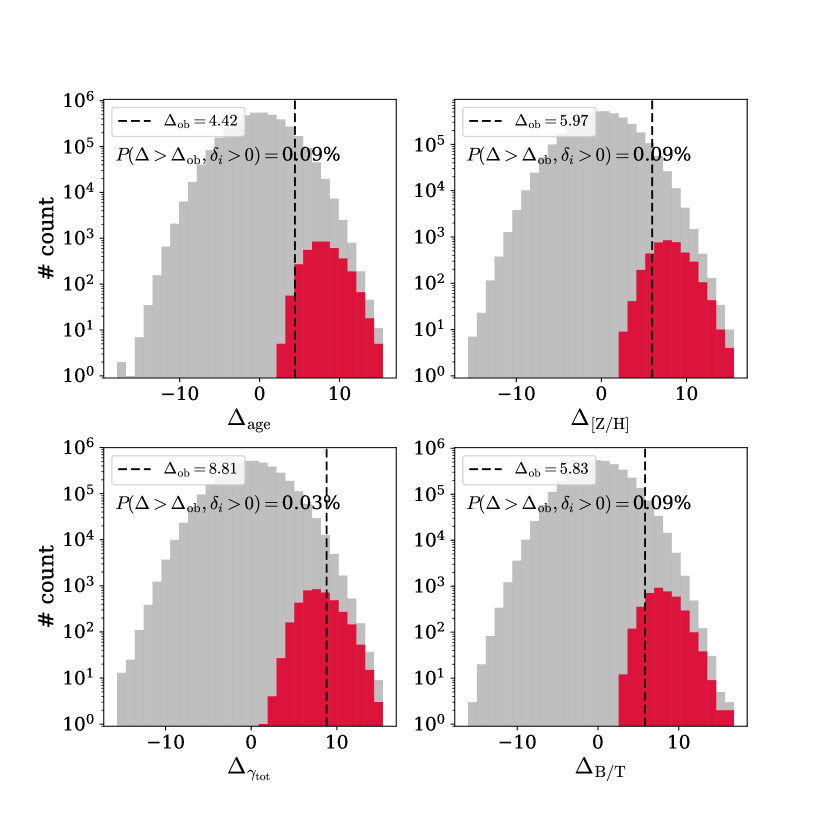
where is the value randomly sampled from the normal distribution of the -th bin. Then we compare with the observed relative difference (, where is the difference we see in Fig. 5 of the two subgroups in the -th bin). We want to evaluate the probability of seeing all sampled ’s being positive and greater than the observed value, , by random fluctuations.
To do this, we perform Monte Carlo samplings mentioned above by times, and find that for galaxy age, metallicity and , and for (see Fig. 6 for the distributions of sampled values). Given such low probabilities of our observed differences arising by chance, we reject our null hypotheses and conclude that there is indeed systematic difference in both stellar population properties and structural parameters of galaxies with different at fixed .
In comparison, the two subgroups of TNG galaxies also show discrepancies in the mass density slope, the bulge fraction, and the stellar age with being , , and , respectively. For metallicity, however, the difference between the two subgroups is again completely absent in the simulations. In particular, TNG galaxies span a rather limited range of compared to the observations, making any comparison with the observations flawed from the start.
The results seen from Fig. 5 indicate that the relations between and galaxy properties are not only driven by , but also by the gradient of . The fact that the gradient of contains information of both stellar populations and structural properties of galaxies, which are not fully accounted for by , has not been addressed before.
4 Conclusion and Discussion
In this work, we study the relations between the gradient of () and galaxies properties (i.e. the mass-weighted total density slope , the bulge fraction , galaxy age , and metallicity ) with 1339 galaxies from the MaNGA sample released by SDSS DR14, and make a comparison with the hydrodynamical simulations, the IllustrisTNG (TNG) simulations.
We employ () to represent the gradient of and find that changes systematically on the mass-size plane roughly along the direction of , consistent with C13b. Besides, increases with below . At high end, the gradient keeps nearly unchanged at , indicating a saturation in the slope for bulge-dominated galaxies (). Most galaxies () in TNG appear to have , which means a decreasing trend of from inner to outer regions in galaxies, relative to in MaNGA. It may be due to the overly-strong AGN feedback in TNG (Wang et al., 2019, 2020; Lu et al., 2020).
We find that gradients are closely related (in a non-linear way) to both the total mass density gradients and, more weakly, to the bulge fraction , which is a more uncertain quantity. We confirm the clear trends of with , age and metallicity (e.g. fig. 22 in the review by Cappellari 2016). The correlation of with age is more shallow in TNG than in the observations and our clear empirical correlation of with [Z/H] is completely absent in TNG.
The main goal of this paper is to look for trends in galaxy properties at fixed , which were impossible to investigate from smaller samples than MaNGA. We found that at fixed the stellar population clearly depends on the density gradients as here quantified by . In particular, at fixed , galaxies with larger are still older and more metal-rich. It means that both stellar populations and structural properties of galaxies are not fully accounted for by and the gradient of also contains these information. In TNG, galaxy age, , and show qualitatively similar trends as we derive from the MaNGA data, but the trends at fixed of with , which are clearly visible in MaNGA, are again completely absent in the simulations. It implies that the relation between metallicity and stellar age (and also other galaxy properties) seen in observations is not met in TNG.
This new empirical evidence that galaxy properties still correlate with the gradient at fixed provides an extra constraint on our understanding of galaxy quenching. In the current state-of-the-art simulations (e.g. the IllustrisTNG simulations), the relations between galaxy properties and are not well recovered, which shows the power of investigating this extra quantity it can be used to validate the simulations in terms of the relations between stellar population and dynamical properties of galaxies.
Acknowledgements
This work is partly supported by the National Key Basic Research and Development Program of China (No. 2018YFA0404501 to SM), by the National Natural Science Foundation of China (Grant Nos. 11821303, 11761131004 and 11761141012 to SM, 11903046 to JG), and by the Beijing Municipal Natural Science Foundation (No. 1204038 to JG). RL is supported by National Natural Science Foundation of China (Nos. 11773032 and 118513) and the NAOC Nebula Talents Program.
References
- Abolfathi et al. (2018) Abolfathi B., et al., 2018, ApJS, 235, 42
- Binney & Tremaine (2008) Binney J., Tremaine S., 2008, Galactic Dynamics: Second Edition. Princeton University Press, Princeton, NJ
- Bundy et al. (2015) Bundy K., et al., 2015, ApJ, 798, 7
- Cappellari (2002) Cappellari M., 2002, MNRAS, 333, 400
- Cappellari (2008) Cappellari M., 2008, MNRAS, 390, 71
- Cappellari (2016) Cappellari M., 2016, ARA&A, 54, 597
- Cappellari (2017) Cappellari M., 2017, MNRAS, 466, 798
- Cappellari & Copin (2003) Cappellari M., Copin Y., 2003, MNRAS, 342, 345
- Cappellari & Emsellem (2004) Cappellari M., Emsellem E., 2004, PASP, 116, 138
- Cappellari et al. (2006) Cappellari M., et al., 2006, MNRAS, 366, 1126
- Cappellari et al. (2011) Cappellari M., et al., 2011, MNRAS, 416, 1680
- Cappellari et al. (2013a) Cappellari M., et al., 2013a, MNRAS, 432, 1709
- Cappellari et al. (2013b) Cappellari M., et al., 2013b, MNRAS, 432, 1862
- Cleveland & Devlin (1988) Cleveland W. S., Devlin S. J., 1988, Journal of the American Statistical Association, 83, 596
- Dolag et al. (2009) Dolag K., Borgani S., Murante G., Springel V., 2009, MNRAS, 399, 497
- Drory et al. (2015) Drory N., et al., 2015, AJ, 149, 77
- Dutton & Treu (2014) Dutton A. A., Treu T., 2014, MNRAS, 438, 3594
- Emsellem et al. (1994) Emsellem E., Monnet G., Bacon R., 1994, A&A, 285, 723
- Falcón-Barroso et al. (2011) Falcón-Barroso J., Sánchez-Blázquez P., Vazdekis A., Ricciardelli E., Cardiel N., Cenarro A. J., Gorgas J., Peletier R. F., 2011, A&A, 532, A95
- Freeman (1970) Freeman K. C., 1970, ApJ, 160, 811
- Gerhard & Binney (1996) Gerhard O. E., Binney J. J., 1996, MNRAS, 279, 993
- Graves et al. (2009) Graves G. J., Faber S. M., Schiavon R. P., 2009, ApJ, 698, 1590
- Law et al. (2015) Law D. R., et al., 2015, AJ, 150, 19
- Li et al. (2018) Li H., et al., 2018, MNRAS, 476, 1765
- Li et al. (2019) Li R., et al., 2019, MNRAS, 490, 2124
- Lu et al. (2020) Lu S., et al., 2020, MNRAS, 492, 5930
- Magorrian et al. (1998) Magorrian J., et al., 1998, AJ, 115, 2285
- Marinacci et al. (2018) Marinacci F., et al., 2018, MNRAS, 480, 5113
- McDermid et al. (2015) McDermid R. M., et al., 2015, MNRAS, 448, 3484
- Naiman et al. (2018) Naiman J. P., et al., 2018, MNRAS, 477, 1206
- Nelson et al. (2018) Nelson D., et al., 2018, MNRAS, 475, 624
- Nelson et al. (2019) Nelson D., et al., 2019, Computational Astrophysics and Cosmology, 6, 2
- Pillepich et al. (2018) Pillepich A., et al., 2018, MNRAS, 475, 648
- Poci et al. (2017) Poci A., Cappellari M., McDermid R. M., 2017, MNRAS, 467, 1397
- Rybicki (1987) Rybicki G. B., 1987, in de Zeeuw P. T., ed., IAU Symposium Vol. 127, Structure and Dynamics of Elliptical Galaxies. p. 397, doi:10.1007/978-94-009-3971-4_41
- Salim et al. (2016) Salim S., et al., 2016, ApJS, 227, 2
- Sánchez-Blázquez et al. (2006) Sánchez-Blázquez P., et al., 2006, MNRAS, 371, 703
- Scott et al. (2017) Scott N., et al., 2017, MNRAS, 472, 2833
- Sersic (1968) Sersic J. L., 1968, Atlas de Galaxias Australes
- Simard et al. (2011) Simard L., Mendel J. T., Patton D. R., Ellison S. L., McConnachie A. W., 2011, ApJS, 196, 11
- Smee et al. (2013) Smee S. A., et al., 2013, AJ, 146, 32
- Springel et al. (2001) Springel V., White S. D. M., Tormen G., Kauffmann G., 2001, MNRAS, 328, 726
- Springel et al. (2018) Springel V., et al., 2018, MNRAS, 475, 676
- Stoughton et al. (2002) Stoughton C., et al., 2002, AJ, 123, 485
- Wang et al. (2019) Wang Y., et al., 2019, MNRAS, 490, 5722
- Wang et al. (2020) Wang Y., et al., 2020, MNRAS, 491, 5188
- Westfall et al. (2019) Westfall K. B., et al., 2019, AJ, 158, 231
- Xu et al. (2017) Xu D., Springel V., Sluse D., Schneider P., Sonnenfeld A., Nelson D., Vogelsberger M., Hernquist L., 2017, MNRAS, 469, 1824
- Xu et al. (2019) Xu D., et al., 2019, MNRAS, 489, 842
- Yan et al. (2016a) Yan R., et al., 2016a, AJ, 151, 8
- Yan et al. (2016b) Yan R., et al., 2016b, AJ, 152, 197
- van den Bosch (1997) van den Bosch F. C., 1997, MNRAS, 287, 543