The proper motion of sub-populations in Centauri
The galactic globular cluster Centauri is the most massive of its kind, with a complex mix of multiple stellar populations and several kinematic and dynamical peculiarities. Different mean proper motions have been detected among the three main sub-populations, implying that the most metal-rich one is of accreted origin. This particular piece of evidence has been a matter of debate because the available data have either not been sufficiently precise or limited to a small region of the cluster to ultimately confirm or refute the result. Using astrometry from the second Gaia data release and recent high-quality, multi-band photometry, we are now in a position to resolve the controversy. We reproduced the original analysis using the Gaia data and found that the three populations have the same mean proper motion. Thus, there is no need to invoke an accreted origin for the most metal-rich sub-population.
Key Words.:
globular clusters: individual: NGC 5139 – Astrometry – Proper Motions – Stars: Kinematics and Dynamics1 Introduction
Of all globular clusters (hereafter GCs) in the Milky Way, Centauri ( Cen, NGC 5139) is the most massive (3.24 10, Zocchi et al. 2017) and the most complex in terms of its sub-populations. It is known to host from a minimum of three (Pancino et al. 2000; Ferraro et al. 2004) to at least 15 (Bellini et al. 2017) sub-populations. The complexity is observed in colour-magnitude diagrams (hereafter CMDs), where it appears most clearly in Hubble Space Telescope (HST) photometry (Bellini et al. 2017), which shows several co-existing main sequences. The cluster is even more complex from the point of view of its chemistry, with a large spread in metallicity (Norris et al. 1996; Pancino et al. 2002), extreme multiple populations (Gratton et al. 2011; Bastian & Lardo 2018), including strong enhancements in helium (Dupree & Avrett 2013), and s-process elements (D’Orazi et al. 2011).
The complexity of Centauri is reflected in its kinematics, but often with controversial results. In their study of 400 red giants, Norris et al. (1997) found that the metal-rich population is more centrally concentrated and kinematically cooler than the metal-poor population (see also Sollima et al. 2007; Bellini et al. 2009b). Moreover, the metal-poor stars show systemic rotation, while the metal-rich stars seem to be non-rotating. These results were confirmed by van de Ven et al. (2006) and Bellini et al. (2018), who used different sets of data to find differences in the radial distribution and rotation of the sub-populations, as well as possible differences in their anisotropy. However, based on their radial velocity investigations, Pancino et al. (2007) and van Loon et al. (2007) did not find any significant difference in the rotation or velocity spreads among the sub-populations. Another controversial topic that lingers is the possible presence of an intermediate-mass black hole, initially proposed by Noyola et al. (2008), but later put into doubt by, for example, van der Marel & Anderson (2010) or Zocchi et al. (2019), who studied the effect of several dynamical ingredients on reproducing the available data.
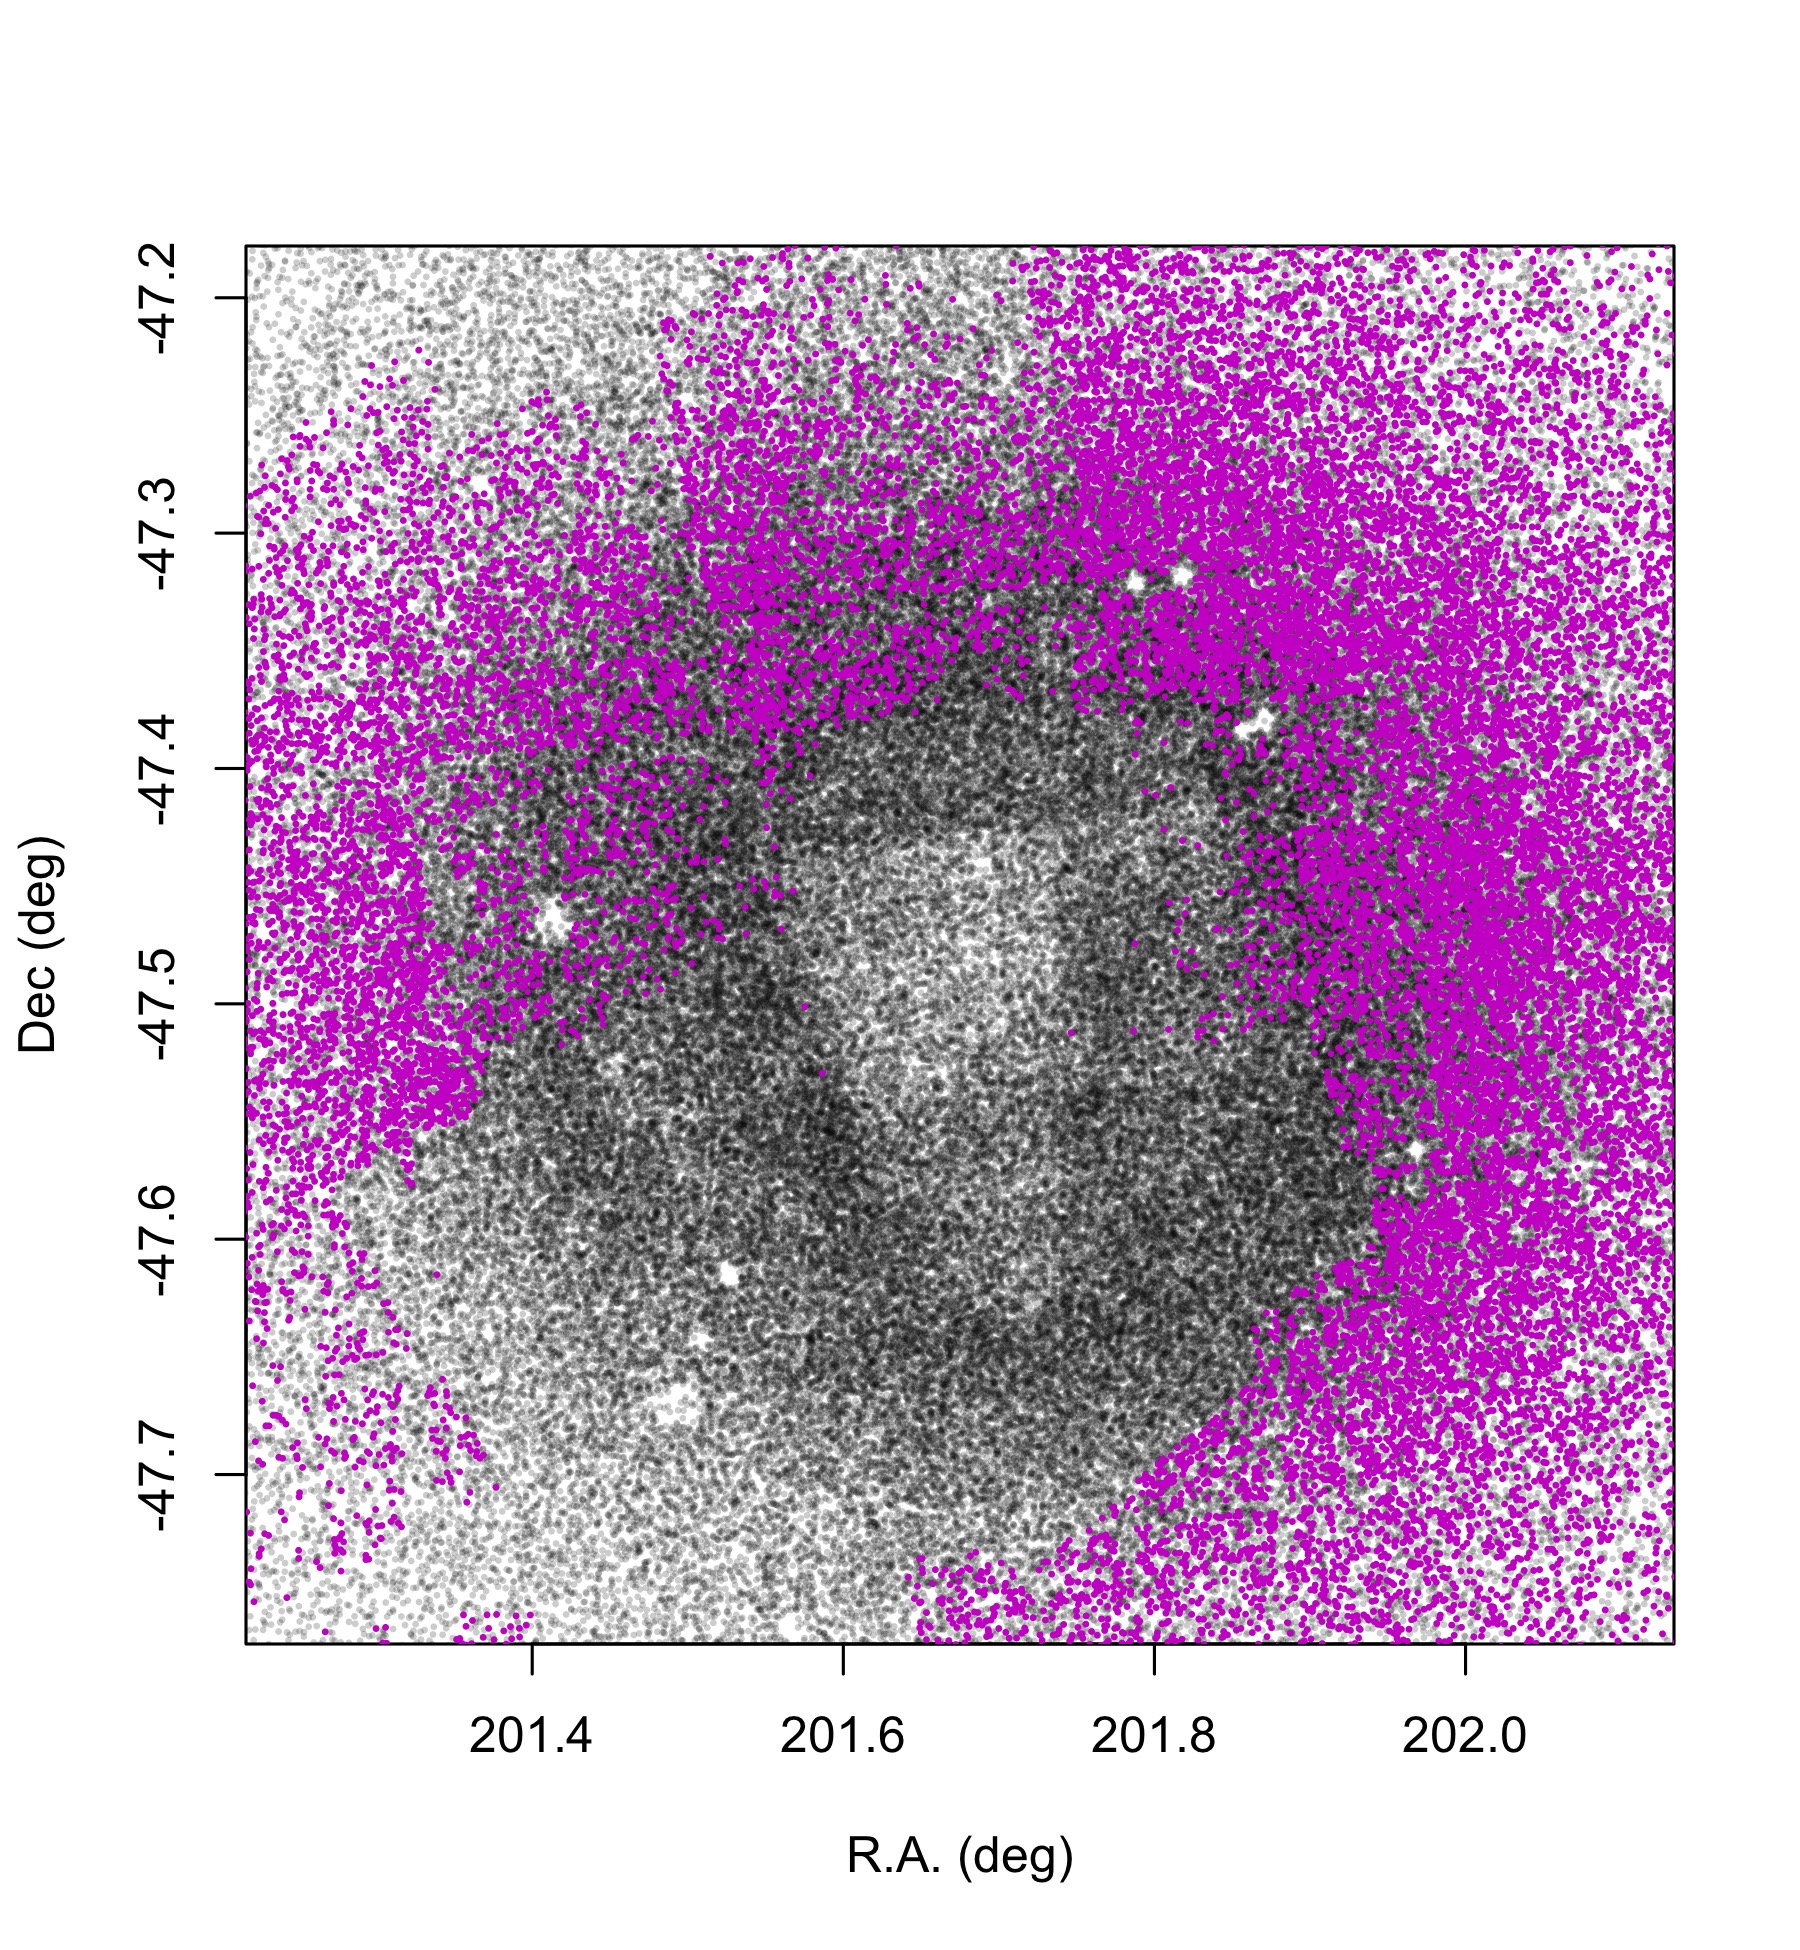
The recent second Gaia data release (hereafter DR2, Gaia Collaboration et al. 2018a, 2016) provided data that could in principle settle some of the open issues, but unfortunately the central regions of Centauri are incomplete, as illustrated in Figure 1. The incompleteness is caused by a combination of crowding effects, along with incomplete Gaia coverage due to the scanning law, and quality filtering of the catalogue prior to the release. The extremely strict membership selection performed by Gaia Collaboration et al. (2018b) exacerbates the incompleteness, producing a large void in the central parts of the GC (Figure 1, see also Figure A.6 by Gaia Collaboration et al. 2018b). The quality is expected to improve significantly with future Gaia releases (Pancino et al. 2017). It is not surprising, therefore, that no detailed analysis of the internal kinematics and dynamics of Cen, based on Gaia DR2 data, has yet appeared: so far, only studies on the systemic properties (Bianchini et al. 2018; Sollima et al. 2019) and on the tidal tails and stream (Myeong et al. 2018; Ibata et al. 2019) have been published. Baumgardt et al. (2019) derived a velocity dispersion profile for Cen with Gaia DR2 data, but no study of the kinematic differences among sub-populations in Cen has been published so far.
There is, however, one dispute about a particularly controversial piece of evidence that can be settled with the present Gaia DR2 astrometry, even considering the limitations in the case of the central Cen regions. Combining the photometry by Pancino et al. (2000) with the proper motions by van Leeuwen et al. (2000), Ferraro et al. (2002) investigated the proper motions of three RGB sub-populations, which they labelled metal-poor (RGB-MP), metal-intermediate (RGB-MInt), and metal-rich or anomalous (RGB-a or), concluding that the metal-rich sub-population should have an independent origin because its mean proper motion is not consistent with the bulk of the RGB stars. In other words, the RGB-a population would be an accreted system, not yet fully mixed, that was not originally part of the Cen main body; it may be, perhaps, a small GC of the original parent galaxy.
This result has been debated since. Platais et al. (2003) suggested that it was an artefact caused by instrumental effects because the telescope used to obtain the proper motions by van Leeuwen et al. (2000) was moved from South Africa to Australia, so the optics and detectors were not the same in different epochs. Hughes et al. (2004) showed that a small colour term of 1 mas yr-1 in the proper motions was properly corrected by van Leeuwen et al. (2000) and it was in the opposite sense with respect to the RGB-a motion, thus the catalogue was reliable and the result solid. A deeper discussion of the problem can also be found in Bellini et al. (2009a), who presented a proper motion investigation using ground-based photometry and astrometry and found no proper motion difference among sub-populations. The authors suggested that an internal stellar proper motions investigation was required, but at that time a catalogue of sufficient quality was not available. More recently, Bellini et al. (2018) and Libralato et al. (2018) investigated the proper motions of small external regions of the main sequence (MS) sub-populations of the cluster using HST data and found that all the sub-populations – which do not correspond exactly to those defined by Ferraro et al. (2002) – share the same median proper motions within the uncertainties. Any difference they found was very small, much smaller than the 0.8 mas yr-1 found by Ferraro et al. (2002). However, the HST astrometry was confined to small-area pointings in Cen.
Here, we profit from the updated multi-band photometry that was recently published by Stetson et al. (2019) and the exquisite proper motions available in Gaia DR2 to revisit the proper motion investigation of the three RGB sub-populations in Centauri. In particular, the Gaia DR2 astrometry has a much higher quality compared to any previous ground-based catalogue and covers the entire extent of the cluster, unlike previous HST astrometry, and therefore it is the only available astrometric catalogue that has the potential to finally settle this open controversy.
2 Data analysis and results
We based our analysis on the Johnson-Cousins photometry by Stetson et al. (2019) and on the Gaia DR2 proper motions111The two catalogues were cross-matched with in-house software by P. B. Stetson.. We also cross-matched the combined Stetson-Gaia catalogue with the original van Leeuwen et al. (2000) astrometry that was used by Ferraro et al. (2002)222The cross-match was performed using the CataXcorr package, developed by P. Montegriffo at the INAF-Osservatorio di Bologna.. We examined some of the quality flags provided by Gaia DR2 for this sample, limiting our analysis to the red giant stars with ¡17 mag. We verified that the behaviour of the astrometric excess noise, goodness of fit, number of good observations used, and RUWE of the selected stars did not deviate from the typical collective behaviour of the sample; thus, we did not apply any specific selection. The initial catalogue of stars in common among the three sources contained 8613 stars.
| Population | Reference | ||
|---|---|---|---|
| (mas yr-1) | (mas yr-1) | ||
| RGB-MP | –4.000.02 | –4.440.02 | Here, using V00 |
| RGB-Mint | –3.760.03 | –4.200.02 | |
| RGB-a | –3.440.08 | –3.780.08 | |
| RGB-MP | –3.94 | –4.40 | F02, using V00 |
| RGB-Mint | –3.65 | –4.27 | |
| RGB-a | –3.53 | –3.71 | |
| RGB-MP | –3.210.02 | –6.730.02 | Here, using G18 |
| RGB-Mint | –3.270.02 | –6.740.02 | |
| RGB-a | –3.280.07 | –6.640.07 |
We could not use the membership selection by Gaia Collaboration et al. (2018b) because it is quite restrictive and it does not contain enough stars in the RGB-a population (see also Figure 1). Therefore, we performed a less restrictive membership selection, with the goal of cleaning the catalogue from obvious non-members, by retaining all stars within a 5D ellipsoid defined as follows:
where =30′ (the maximum extension allowed for a uniform coverage in the ground-based photometry); (,) are the central coordinates of Centauri by Stetson et al. (2019); (,,) are the systemic motion and parallax measurements by Gaia Collaboration et al. (2018b) 333As customary, (see, e.g. Lindegren et al. 2016).; (,,) represent the median absolute deviation (MAD) of the proper motion and parallax distributions of members, refined after a few iterations, and set to (1.09,1.29) mas yr-1 and 0.69 mas, respectively. Following the selection, the sample was made up of 5113 stars. The typical (median) uncertainties on the individual stars are in the range of 0.08–0.12 mas yr-1 in the case of and 0.12–0.17 mas yr-1 in the case of . We note that the errors are larger for the bright stars (G13 mag) than for the faint ones, owing to the fact that Gaia is not designed to target bright stars.
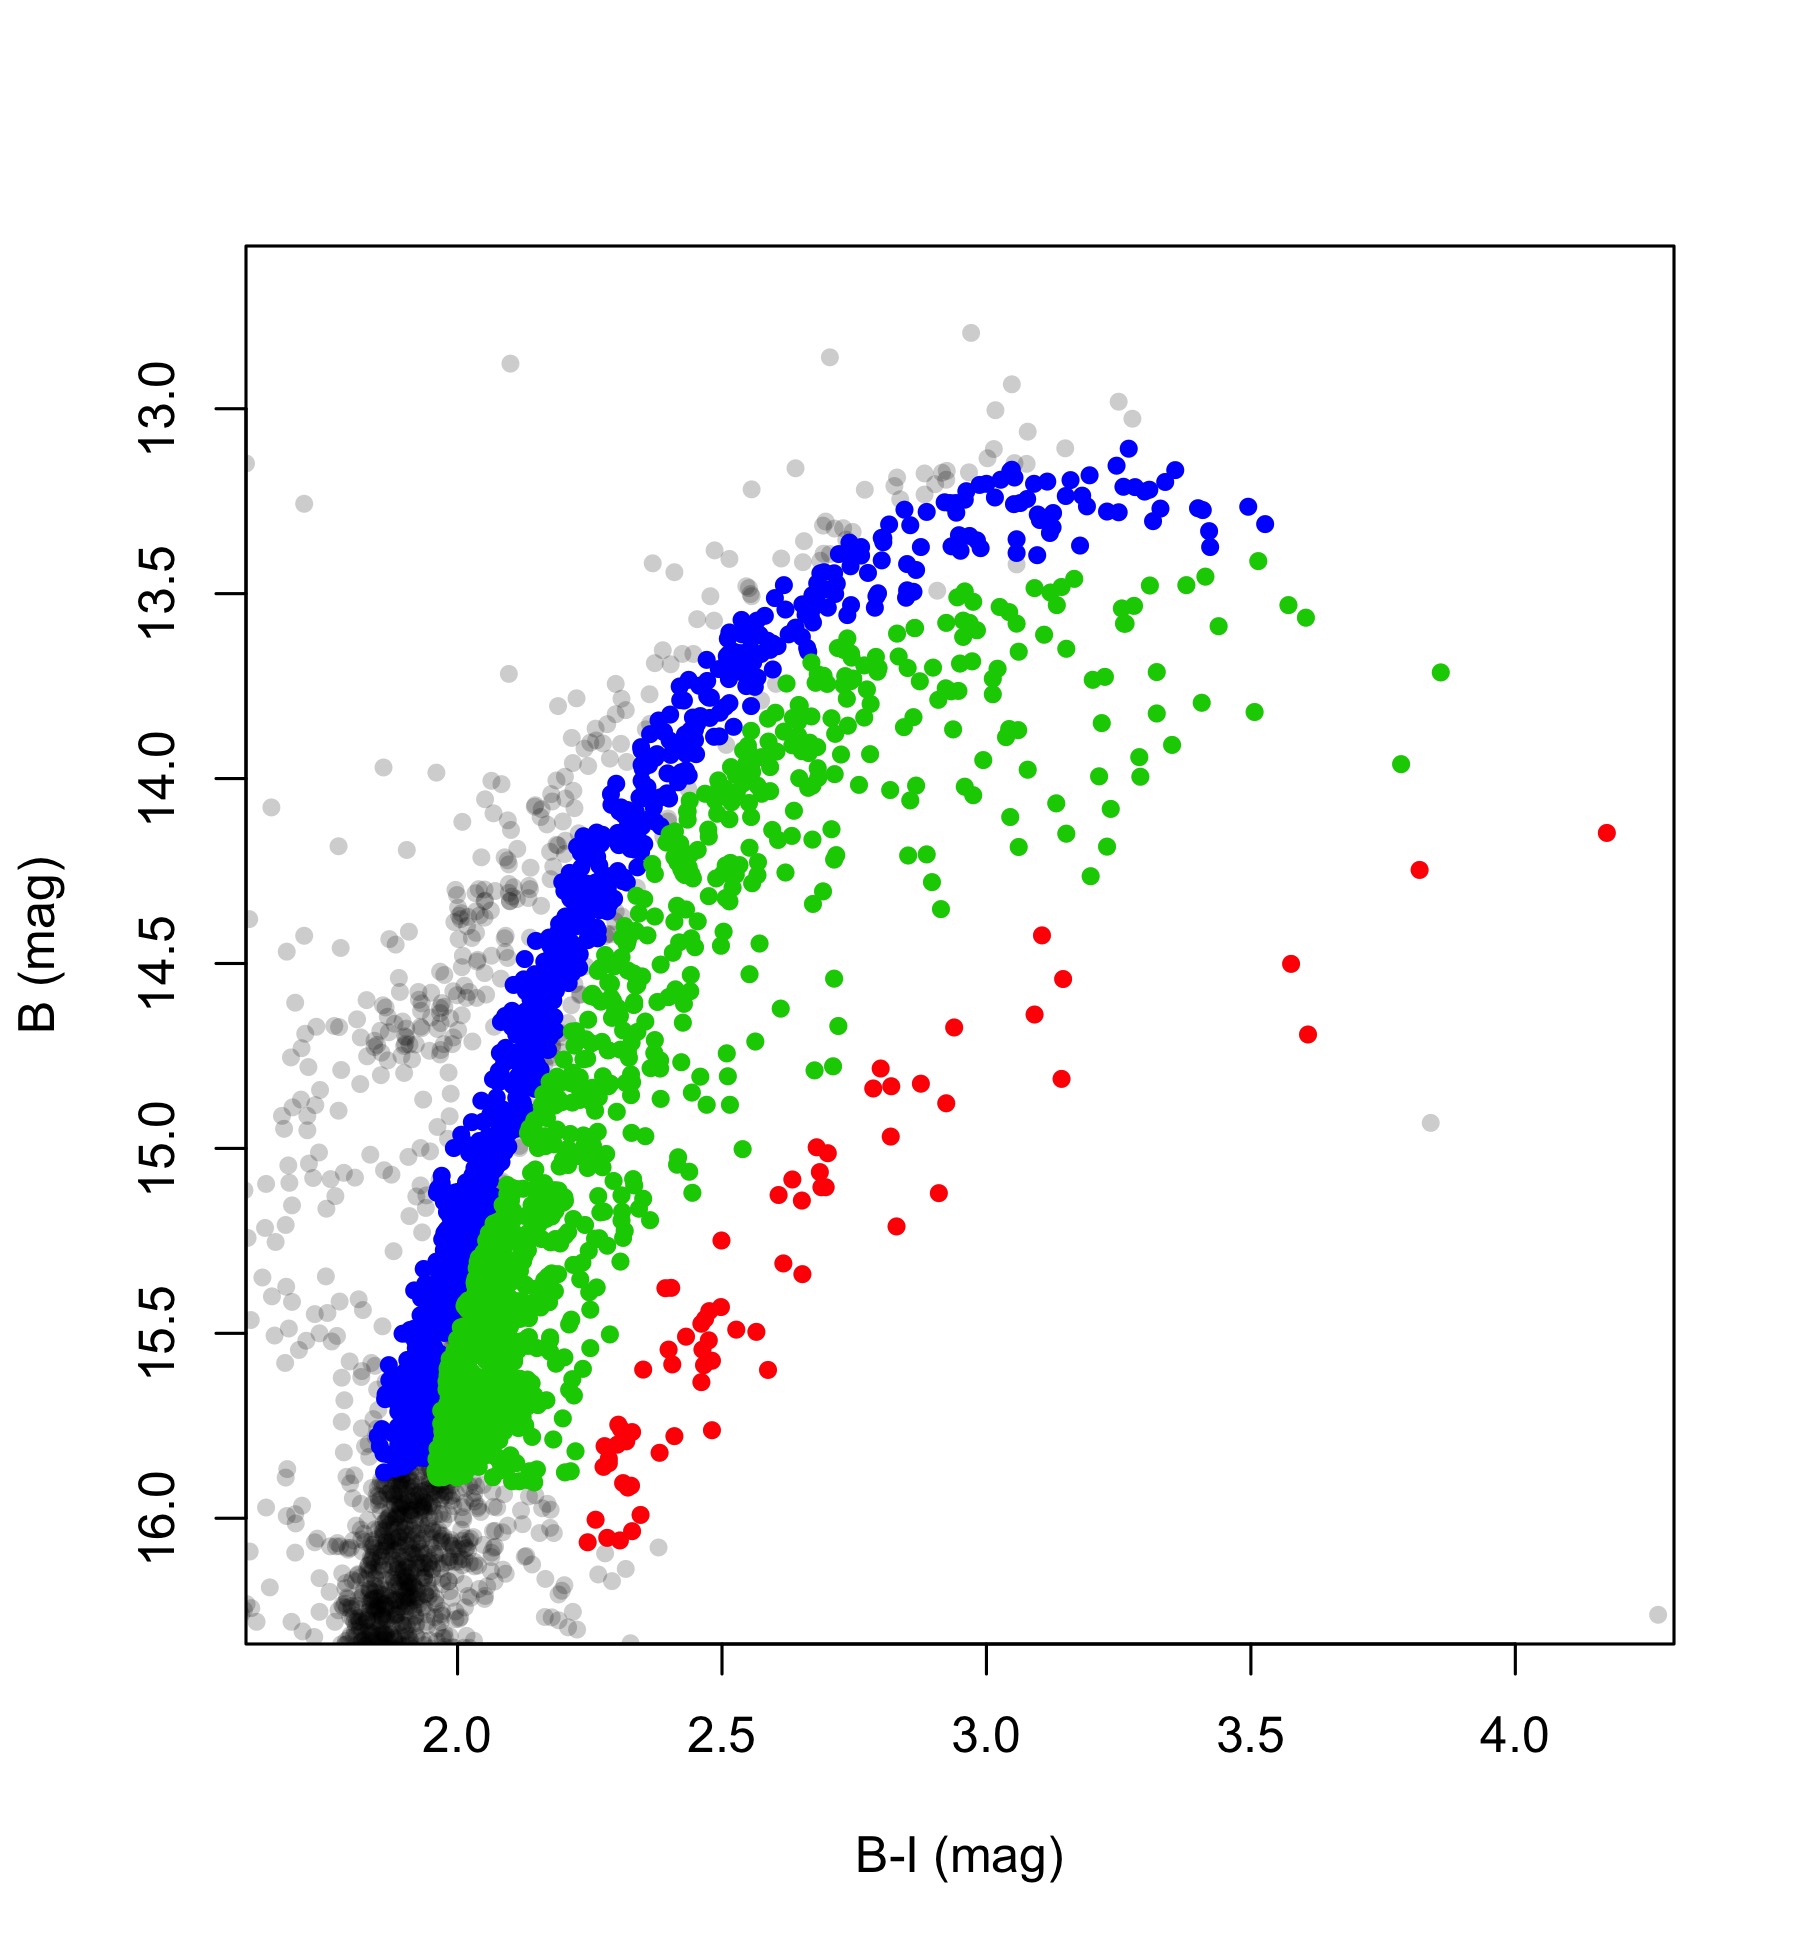
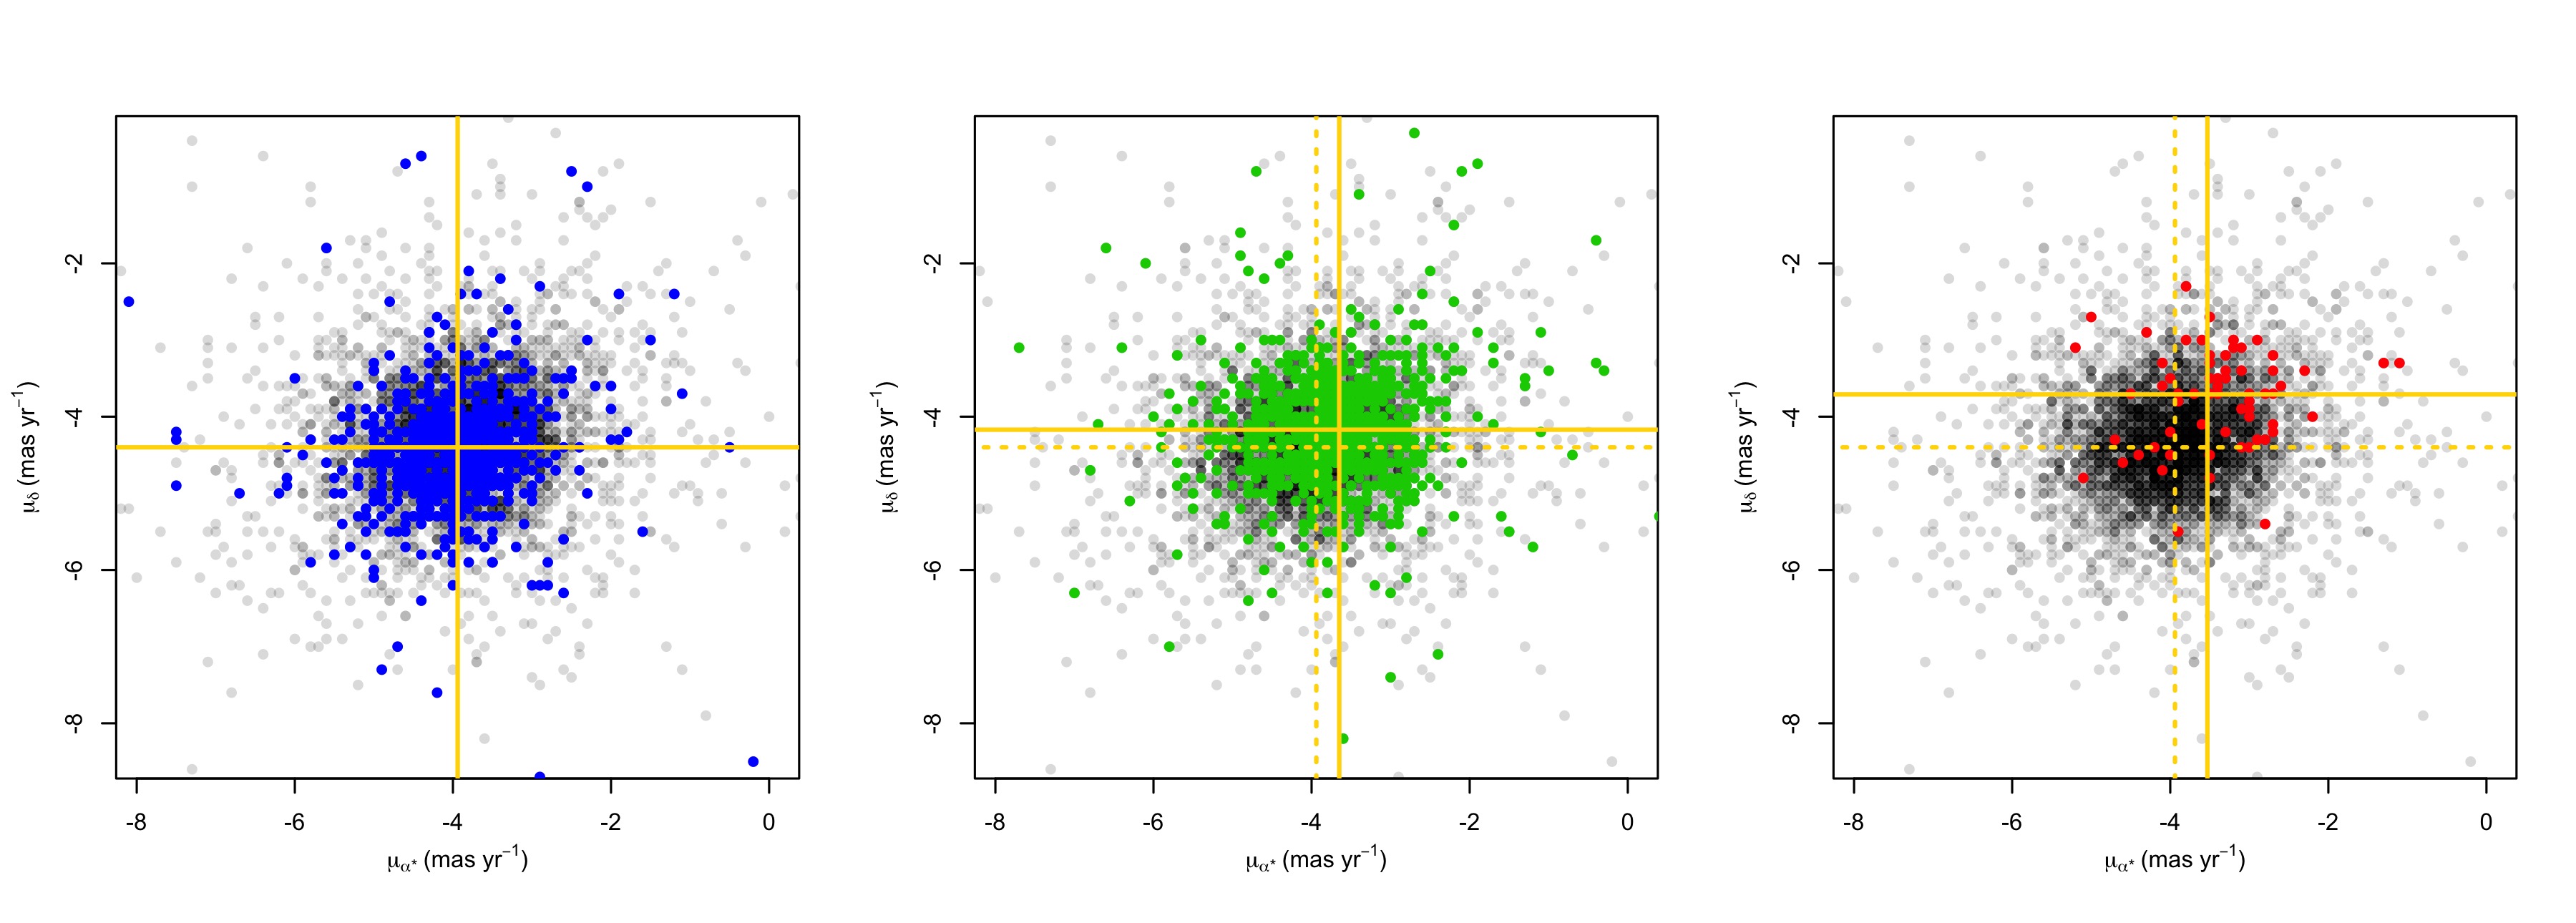
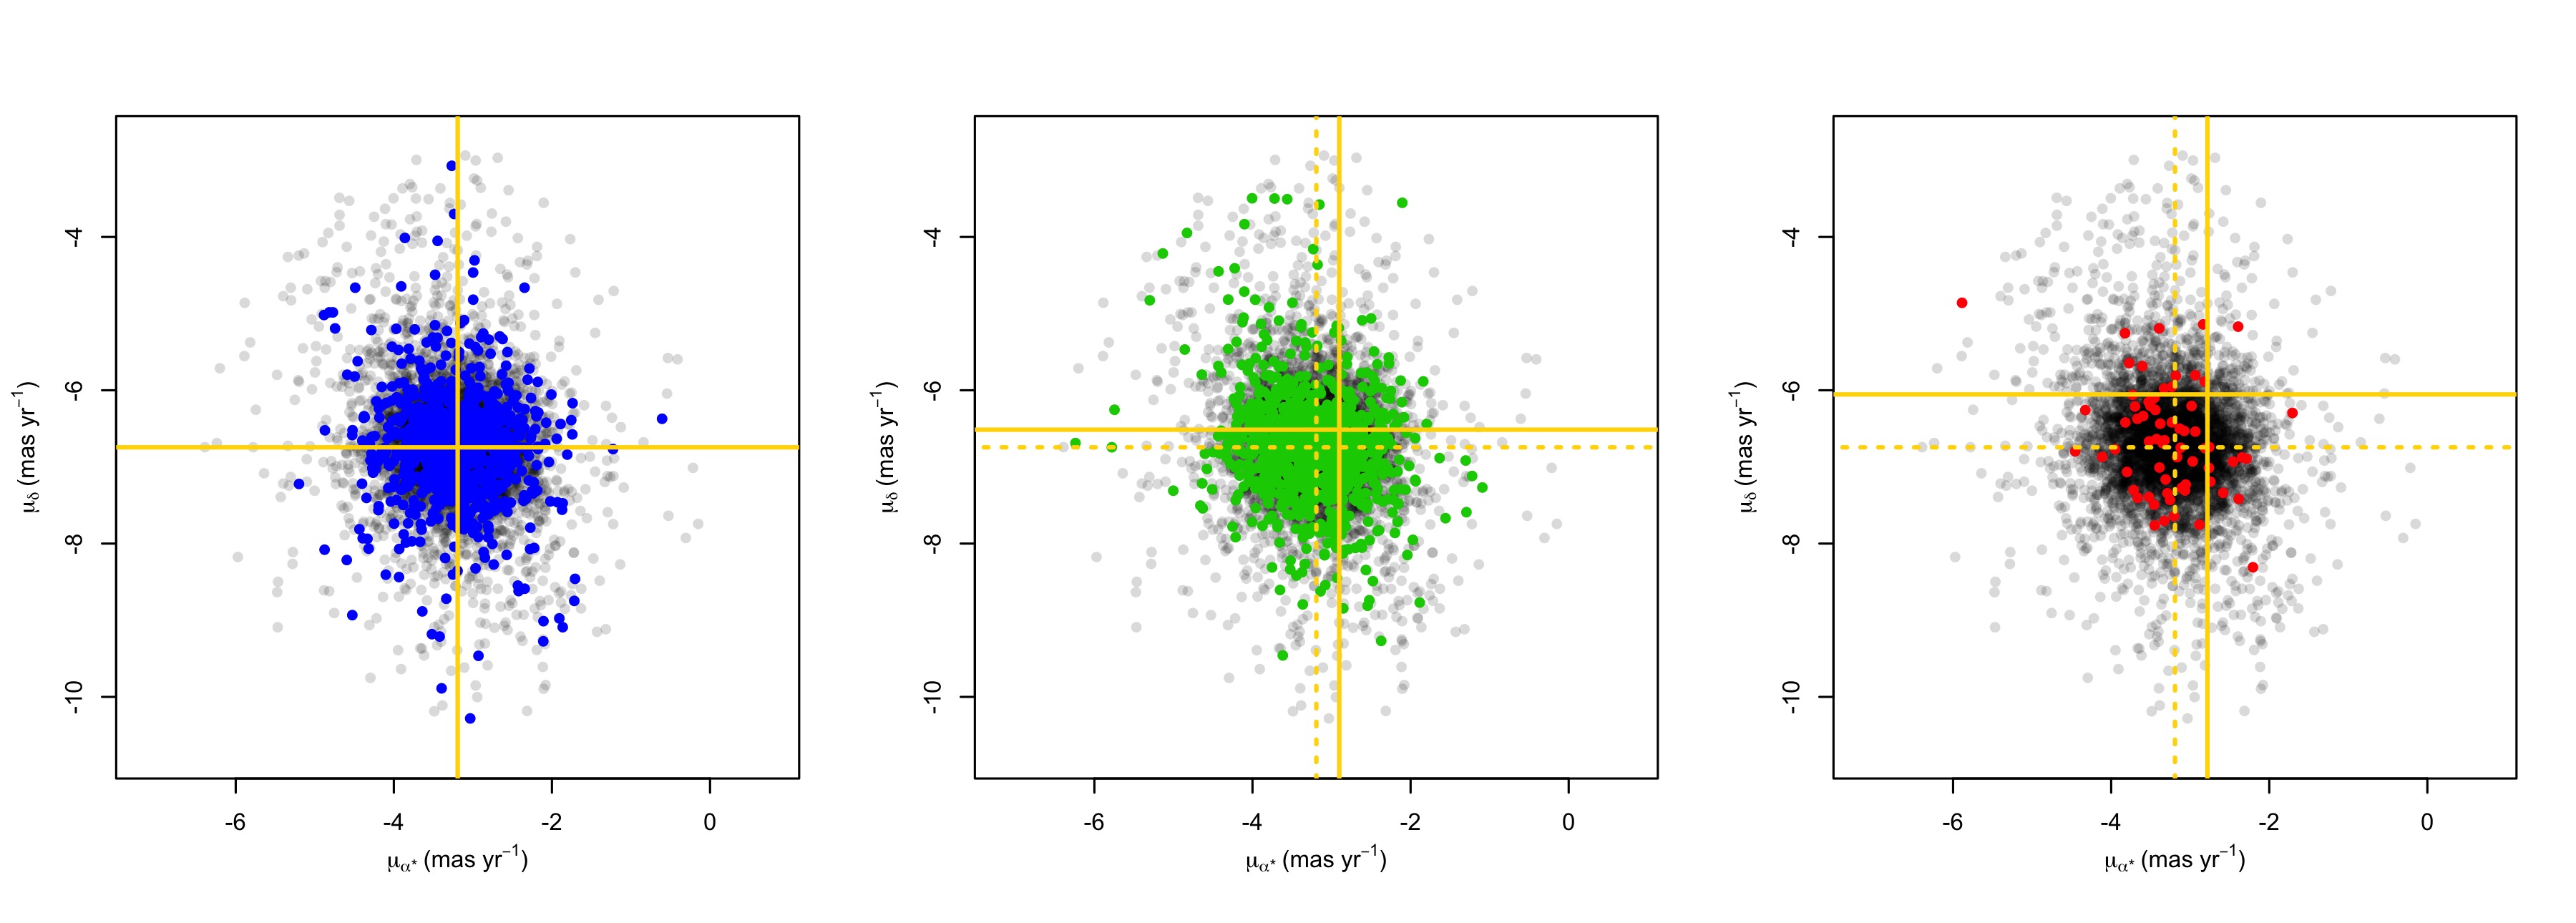
We manually selected the three RGB sub-population samples following the criteria by Ferraro et al. (2002) as closely as possible, as shown in Figure 2. In particular, we used the same limiting magnitudes for the selection of the populations labelled by Pancino et al. (2000) and Ferraro et al. (2002) as RGB-MP and RGB-MInt, while for the so-called RGB-a population we selected slightly fainter stars (B16.1 mag) thanks to the clearer separation from the bulk of the RGB population. As a first sanity check, adopting our selections, we reproduced the original result by Ferraro et al. (2002) using the van Leeuwen et al. (2000) astrometry to make sure that our selection of the three sub-populations was comparable with theirs. The result is shown in Figure 3, where we do indeed observe that the populations labelled by Pancino et al. (2000) and Ferraro et al. (2002) as RGB-MInt and RGB-a have a different mean proper motion compared to the RGB-MP population. In particular, as shown in Table 1, our results are fully compatible with the offsets found by Ferraro et al. (2002). We then repeated the same experiment with the Gaia DR2 proper motions, as illustrated in Figure 4 and with the results reported in Table 1, but in this case all three populations appear clearly compatible with the same mean proper motion and with the Gaia Collaboration et al. (2018b) systemic value for the cluster. We note here that the systemic motion of Cen derived by van Leeuwen et al. (2000) and by Gaia Collaboration et al. (2018b) are quite different from each other, especially as far as is concerned. Both estimates are quite different from the one by Dinescu et al. (1999) as well.
| Population | ||||||||
|---|---|---|---|---|---|---|---|---|
| RGB-MP | B | –0.10 0.54 | –0.046 0.037 | 0.21 | –0.044 | –0.005 | –0.005 | |
| B | 1.91 0.59 | 0.027 0.040 | 0.51 | 0.023 | 0.021 | 0.013 | ||
| B-I | –1.05 0.19 | 0.119 0.086 | 0.17 | 0.048 | –0.001 | 0.001 | ||
| B-I | 2.25 0.21 | 0.024 0.094 | 0.80 | 0.009 | –0.008 | –0.006 | ||
| RGB-MInt | B | 0.67 0.83 | –0.076 0.055 | 0.17 | –0.044 | –0.101 | –0.070 | |
| B | 2.77 0.62 | –0.015 0.041 | 0.72 | –0.012 | –0.062 | –0.042 | ||
| B-I | –1.02 0.27 | 0.238 0.117 | 0.04 | 0.066 | 0.184 | 0.124 | ||
| B-I | 2.20 0.20 | 0.153 0.087 | 0.08 | 0.057 | 0.150 | 0.101 | ||
| RGB-a | B | 2.72 3.89 | –0.192 0.253 | 0.45 | –0.093 | –0.048 | –0.023 | |
| B | –1.74 2.69 | 0.305 0.175 | 0.09 | 0.212 | 0.212 | 0.159 | ||
| B-I | –0.30 0.85 | 0.031 0.321 | 0.92 | 0.012 | 0.029 | 0.006 | ||
| B-I | 4.07 0.58 | –0.431 0.219 | 0.05 | –0.237 | –0.185 | –0.143 |
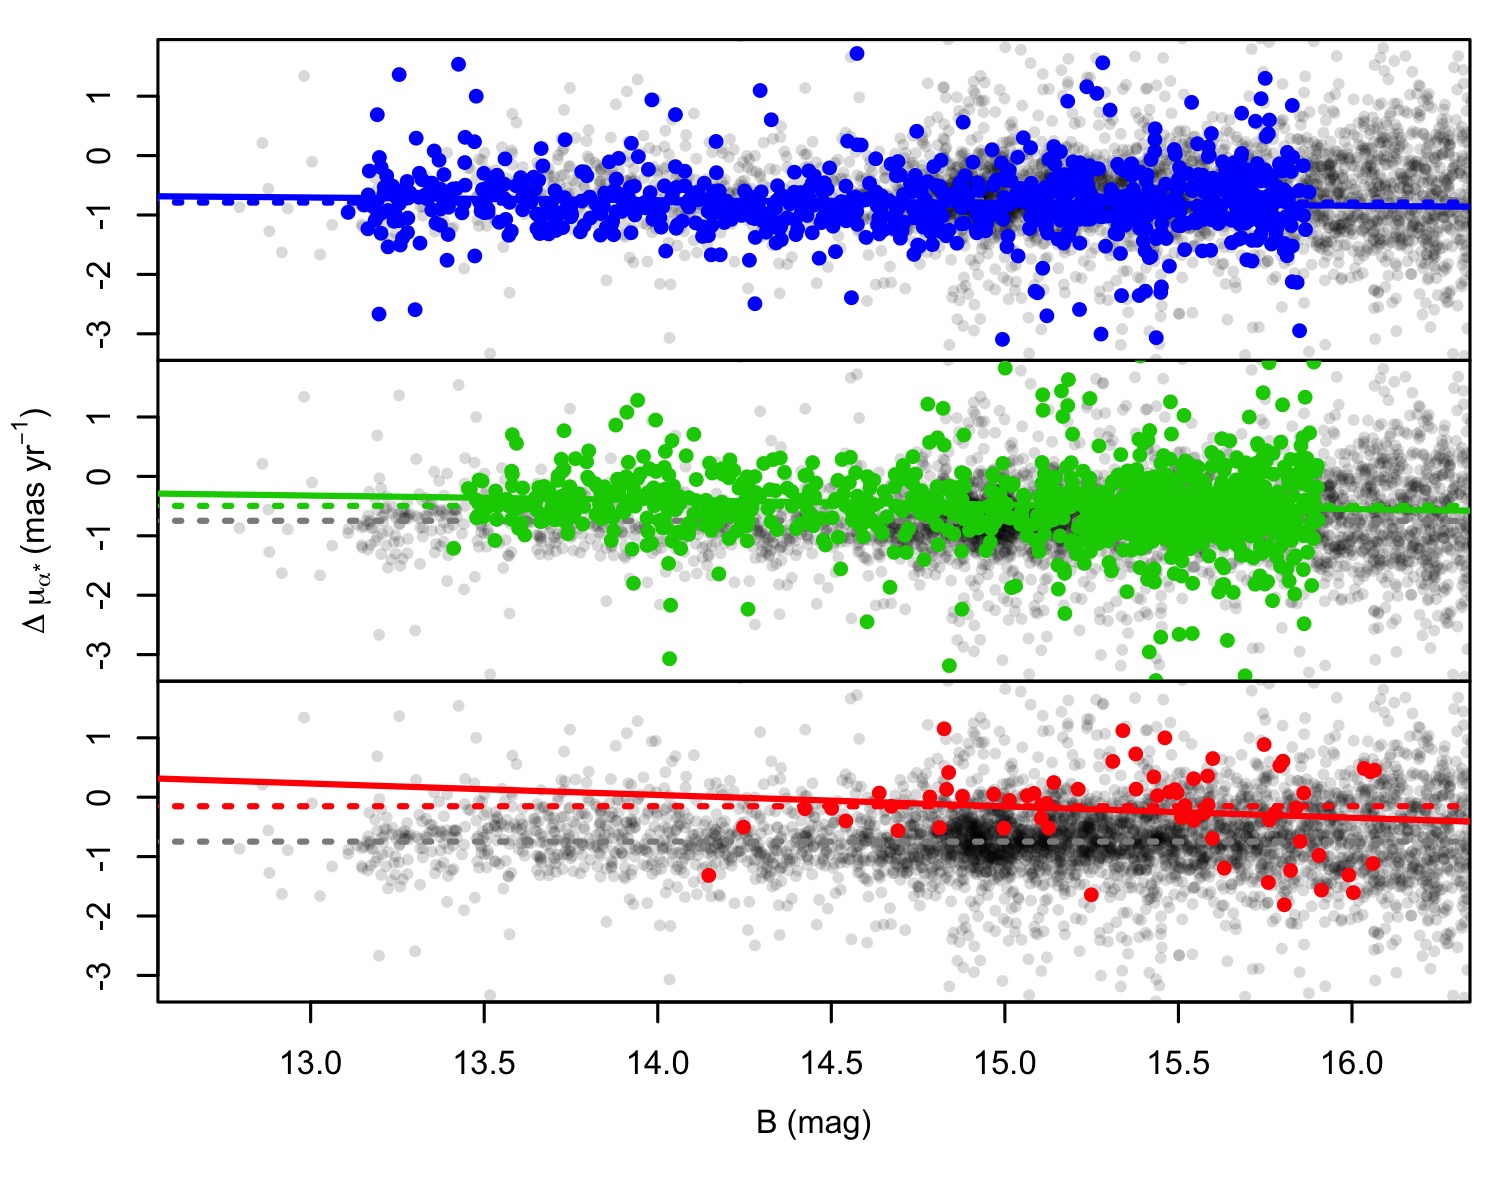
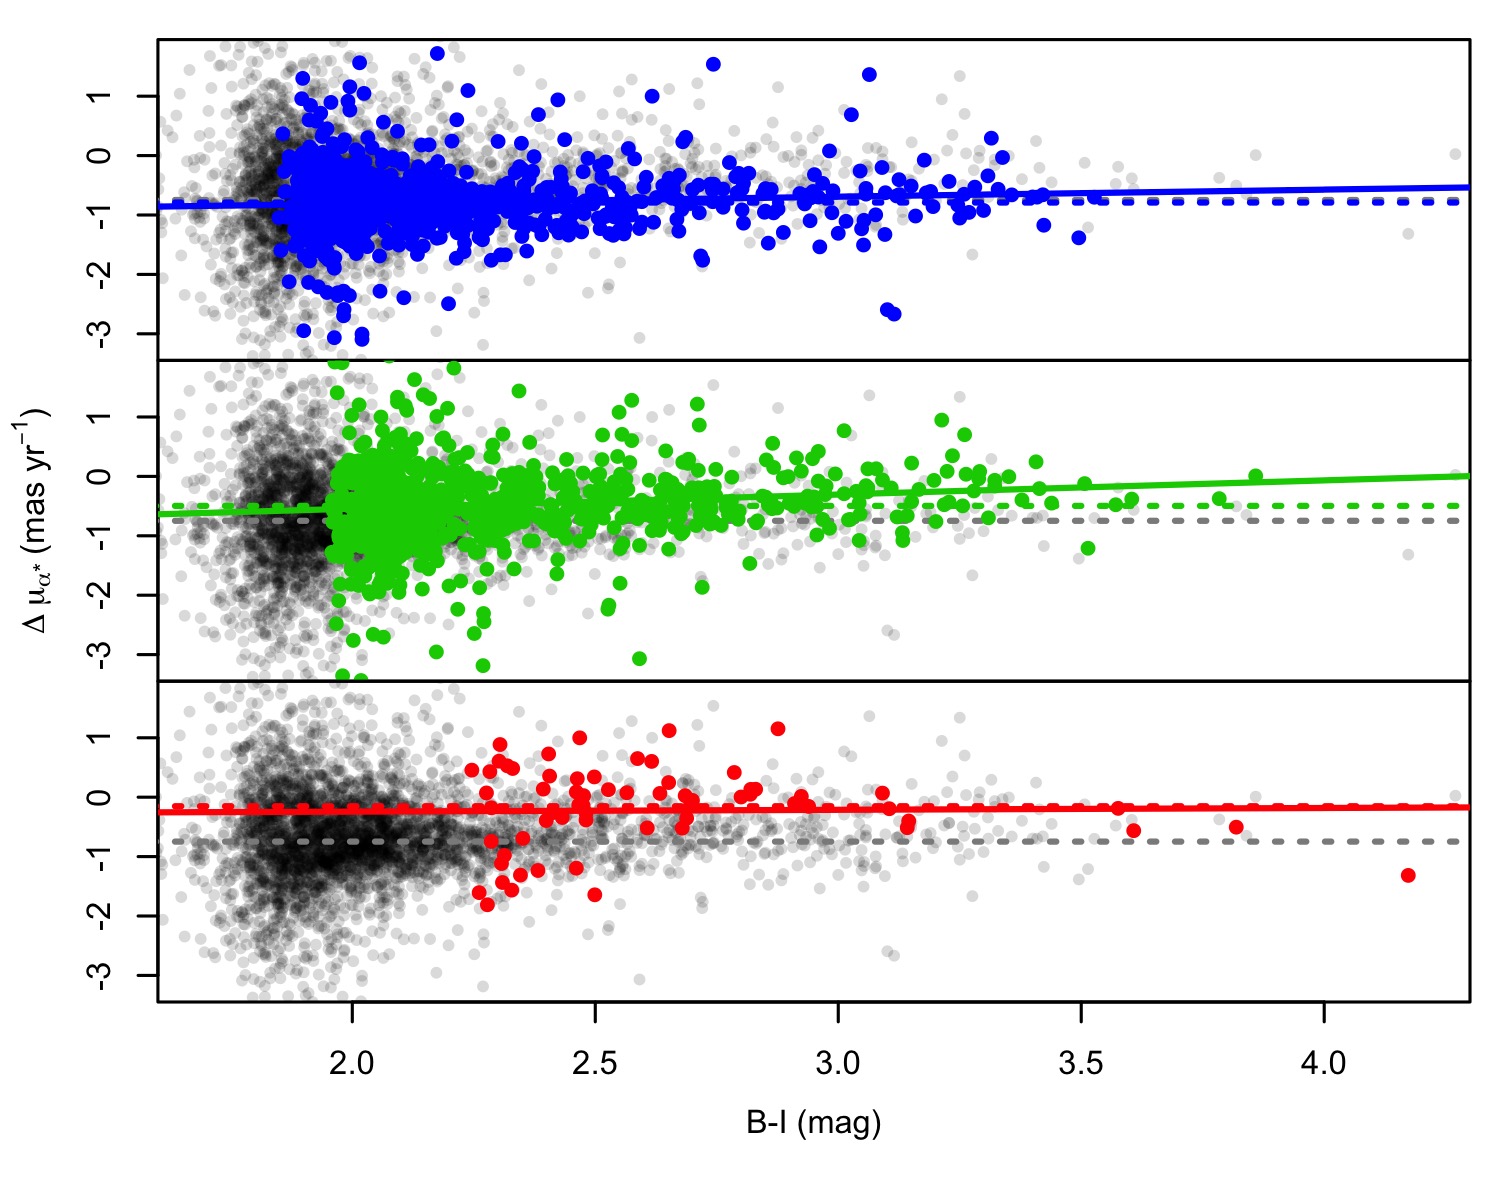
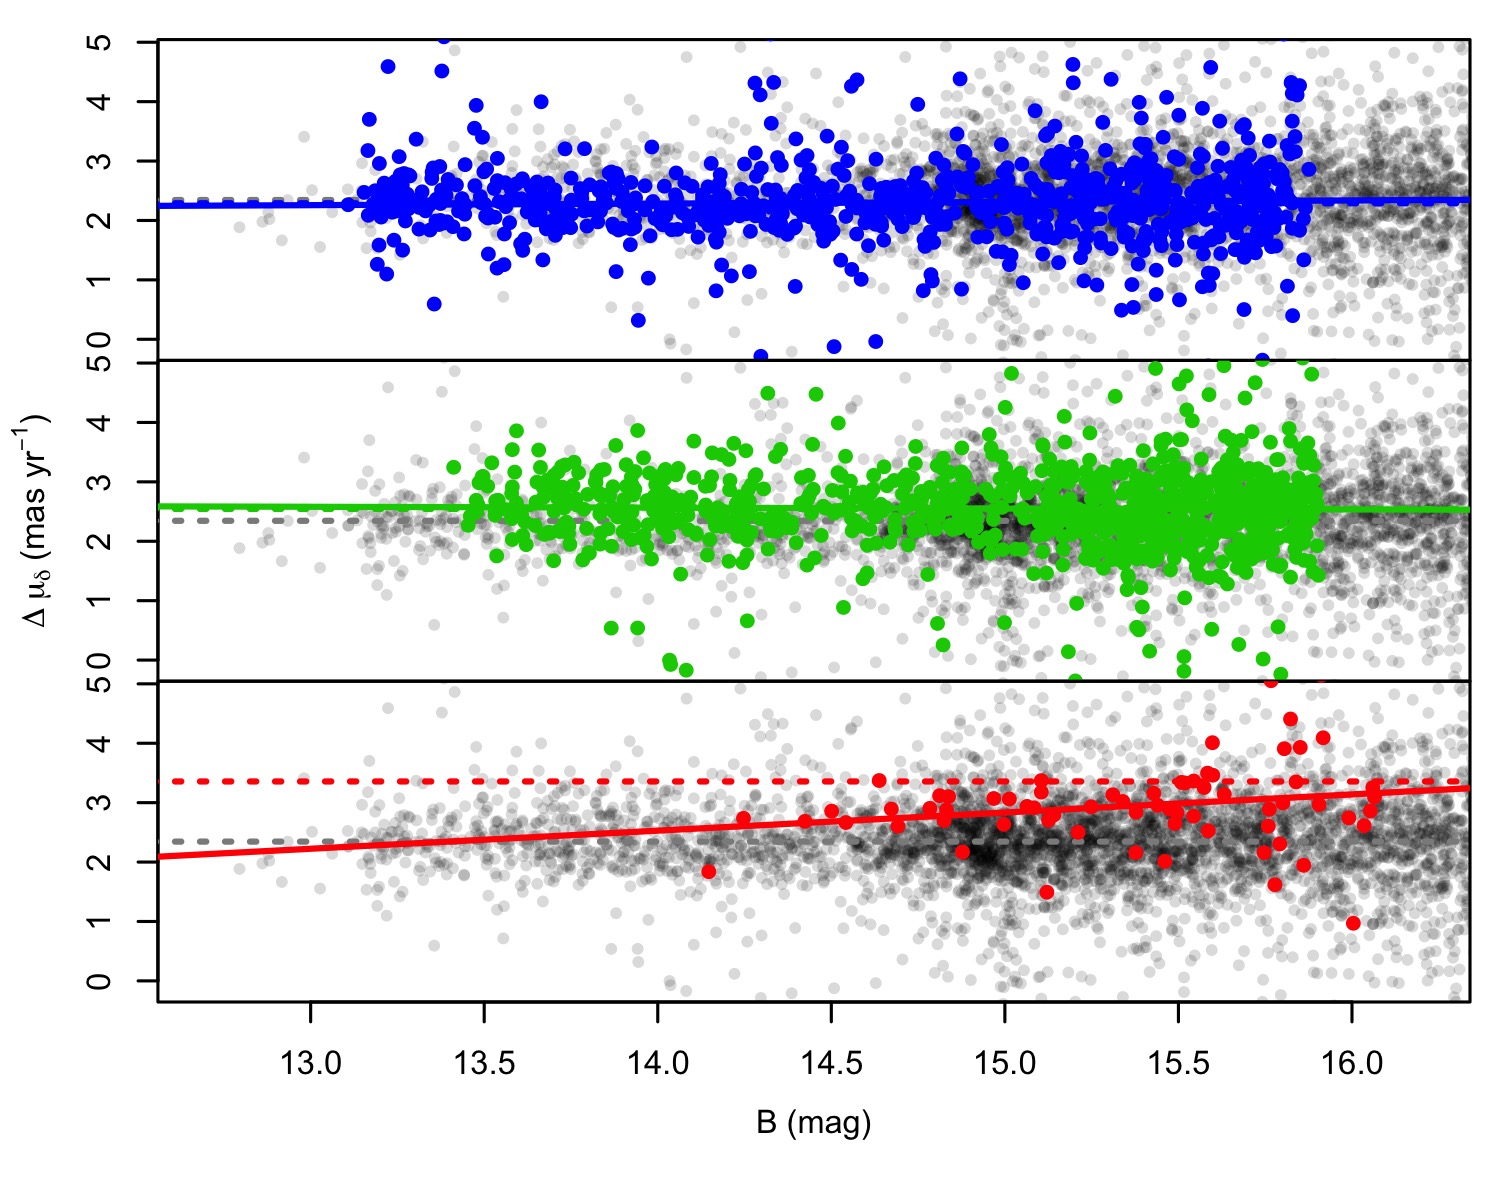
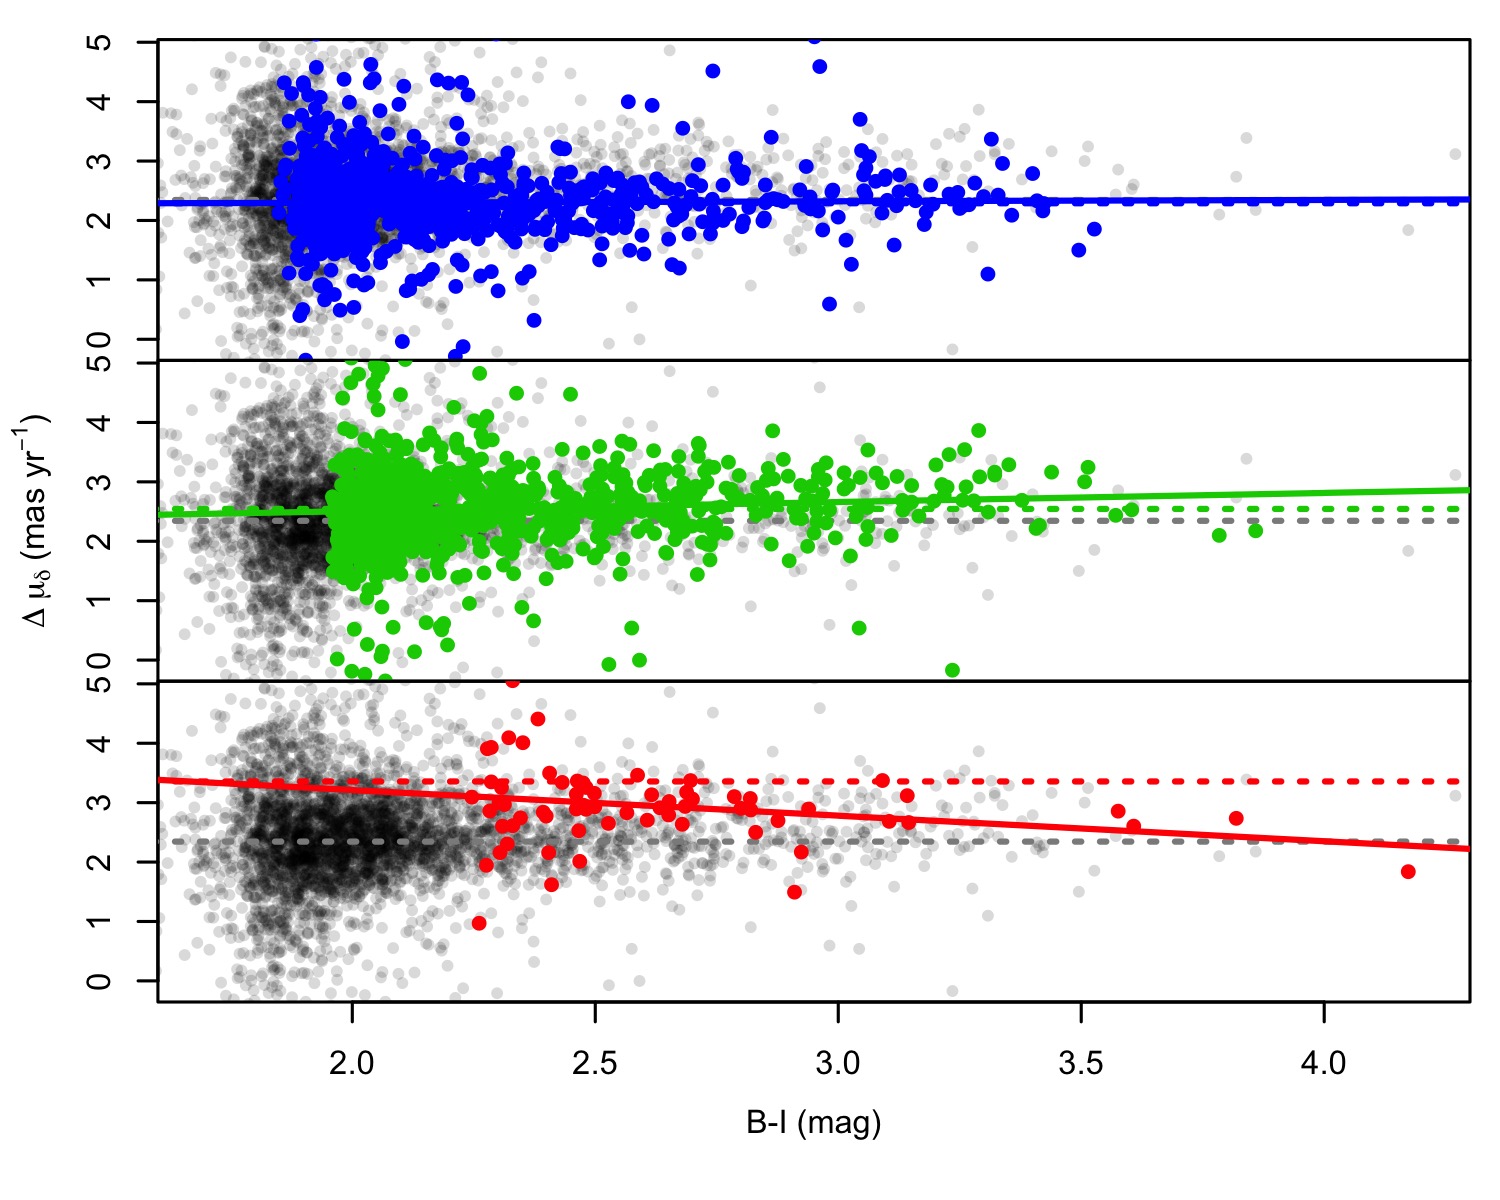
As a final check, we plot the star-by-star differences of the van Leeuwen et al. (2000) and Gaia Collaboration et al. (2018b) proper motions as a function of magnitude and colour (Figure 5). We checked for the presence of significant slopes using four indicators: the p-values of the angular coefficient of linear fits, the Spearman rank coefficient , the Pearson correlation coefficient , and the Kendall rank coefficient (Table 2). We found no significant slopes in any of the samples against colour or magnitude, contradicting the finding by Platais et al. (2003) but confirming the findings by Pancino (2003) and Hughes et al. (2004) in this respect. Even the apparent slopes visible in some of the panels of Figure 5 are not significant and driven by single data points and sample sizes. As can be seen in Table 2, the errors on the angular coefficents and intercepts of the fits are very large. Besides the p-value of the linear fit, all three correlation tests have also large p-values (generally well above 0.05) and the correlation coefficients , , and, are always much closer to zero than to 1.
In past studies, the absence of a significant residual slope of the proper motion as a function of colour and magnitude was taken as proof that no spurious effect was present in the van Leeuwen et al. (2000) catalogue. However, from Figure 5, it is evident that this condition was necessary but not sufficient; even if no slope is present in the data, each sub-population clearly drifts away from the mean motion of the cluster in one catalogue but not in the other. We can also see from Figure 5 that the offsets found in Figure 3 and Table 1 are entirely compatible with the differences between the proper motion measurements in the two catalogues, suggesting a spurious measurement effect in the van Leeuwen et al. (2000) catalogue.
3 Conclusions
Our main result is that when using Gaia DR2 data, the three sub-populations have compatible mean motions with each other and with the Gaia Collaboration et al. (2018b) systemic motion of Cen. Previous astrometric catalogues, most notably those by Bellini et al. (2009a) and Bellini et al. (2018), have provided the same result. However, (Bellini et al. 2009a) could count on astrometric errors of the order of a few mas yr-1, that is, a few times larger than the putative proper motion offsets among sub-populations, similarly to van Leeuwen et al. (2000), while the HST astrometric catalog by Bellini et al. (2018) had sub-mas uncertainties, comparable to those in the Gaia DR2 catalogue but, of course, limited to a very small area. Thus, Gaia DR2 is the only presently available catalogue with sufficient quality and area coverage to settle the controversy.
The conclusion that can be drawn from the available literature body and the present analysis is that, indeed, as was suggested by Platais et al. (2003), the van Leeuwen et al. (2000) catalogue contained spurious instrumental effects, although they were not so immediately evident as a simple colour or magnitude trend. Indeed, a colour trend of about 1 mas yr-1 was found and removed from the van Leeuwen et al. (2000) catalogue, as pointed out by Hughes et al. (2004), but this was not sufficient to correct the problem. This implies that it is not necessary to assume that the RGB-a population was an external system which was then accreted by the main body of Cen. We expect that the next Gaia releases will include a treatment of crowding effects (Pancino et al. 2017) and will rely on more high-quality data in the central parts. Combined perhaps with HST astrometry, Gaia data do have the potential to help us decipher the complex kinematic structure and evolution of Cen and its sub-populations.
Acknowledgements.
We thank the referee for the useful suggestions. NS and EP acknowledge the financial support to this research by INAF, through the Mainstream Grant 1.05.01.86.22 assigned to the project “Chemo-dynamics of globular clusters: the Gaia revolution” (P.I. E. Pancino). AZ acknowledges support through a ESA Research Fellowship. This work has used data from the European Space Agency (ESA) mission Gaia (https://www.cosmos.esa.int/gaia), processed by the Gaia Data Processing and Analysis Consortium (DPAC, https://www.cosmos.esa.int/web/gaia/dpac/consortium). Funding for the DPAC has been provided by national institutions, in particular the institutions participating in the Gaia Multilateral Agreement. All figures and the statistical analysis were done with the R programming language (R Core Team 2017; Dowle & Srinivasan 2017) and Rstudio (https://www.rstudio.com/).References
- Bastian & Lardo (2018) Bastian, N. & Lardo, C. 2018, ARA&A, 56, 83
- Baumgardt et al. (2019) Baumgardt, H., Hilker, M., Sollima, A., & Bellini, A. 2019, MNRAS, 482, 5138
- Bellini et al. (2018) Bellini, A., Libralato, M., Bedin, L. R., et al. 2018, ApJ, 853, 86
- Bellini et al. (2017) Bellini, A., Milone, A. P., Anderson, J., et al. 2017, ApJ, 844, 164
- Bellini et al. (2009a) Bellini, A., Piotto, G., Bedin, L. R., et al. 2009a, A&A, 493, 959
- Bellini et al. (2009b) Bellini, A., Piotto, G., Bedin, L. R., et al. 2009b, A&A, 507, 1393
- Bianchini et al. (2018) Bianchini, P., van der Marel, R. P., del Pino, A., et al. 2018, MNRAS, 481, 2125
- Dinescu et al. (1999) Dinescu, D. I., Girard, T. M., & van Altena, W. F. 1999, AJ, 117, 1792
- D’Orazi et al. (2011) D’Orazi, V., Gratton, R. G., Pancino, E., et al. 2011, A&A, 534, A29
- Dowle & Srinivasan (2017) Dowle, M. & Srinivasan, A. 2017, data.table: Extension of ‘data.frame‘, r package version 1.10.4-3
- Dupree & Avrett (2013) Dupree, A. K. & Avrett, E. H. 2013, ApJ, 773, L28
- Ferraro et al. (2002) Ferraro, F. R., Bellazzini, M., & Pancino, E. 2002, ApJ, 573, L95
- Ferraro et al. (2004) Ferraro, F. R., Sollima, A., Pancino, E., et al. 2004, ApJ, 603, L81
- Gaia Collaboration et al. (2018a) Gaia Collaboration, Brown, A. G. A., Vallenari, A., et al. 2018a, A&A, 616, A1
- Gaia Collaboration et al. (2018b) Gaia Collaboration, Helmi, A., van Leeuwen, F., et al. 2018b, A&A, 616, A12
- Gaia Collaboration et al. (2016) Gaia Collaboration, Prusti, T., de Bruijne, J. H. J., et al. 2016, A&A, 595, A1
- Gratton et al. (2011) Gratton, R. G., Johnson, C. I., Lucatello, S., D’Orazi, V., & Pilachowski, C. 2011, A&A, 534, A72
- Hughes et al. (2004) Hughes, J., Wallerstein, G., van Leeuwen, F., & Hilker, M. 2004, AJ, 127, 980
- Ibata et al. (2019) Ibata, R. A., Bellazzini, M., Malhan, K., Martin, N., & Bianchini, P. 2019, Nature Astronomy, 3, 667
- Libralato et al. (2018) Libralato, M., Bellini, A., Bedin, L. R., et al. 2018, ApJ, 854, 45
- Lindegren et al. (2016) Lindegren, L., Lammers, U., Bastian, U., et al. 2016, A&A, 595, A4
- Myeong et al. (2018) Myeong, G. C., Evans, N. W., Belokurov, V., Sand ers, J. L., & Koposov, S. E. 2018, MNRAS, 478, 5449
- Norris et al. (1997) Norris, J. E., Freeman, K. C., Mayor, M., & Seitzer, P. 1997, ApJ, 487, L187
- Norris et al. (1996) Norris, J. E., Freeman, K. C., & Mighell, K. J. 1996, ApJ, 462, 241
- Noyola et al. (2008) Noyola, E., Gebhardt, K., & Bergmann, M. 2008, ApJ, 676, 1008
- Pancino (2003) Pancino, E. 2003, PhD thesis, Università degli studi di Bologna
- Pancino et al. (2017) Pancino, E., Bellazzini, M., Giuffrida, G., & Marinoni, S. 2017, MNRAS, 467, 412
- Pancino et al. (2000) Pancino, E., Ferraro, F. R., Bellazzini, M., Piotto, G., & Zoccali, M. 2000, ApJ, 534, L83
- Pancino et al. (2007) Pancino, E., Galfo, A., Ferraro, F. R., & Bellazzini, M. 2007, ApJ, 661, L155
- Pancino et al. (2002) Pancino, E., Pasquini, L., Hill, V., Ferraro, F. R., & Bellazzini, M. 2002, ApJ, 568, L101
- Platais et al. (2003) Platais, I., Wyse, R. F. G., Hebb, L., Lee, Y.-W., & Rey, S.-C. 2003, ApJ, 591, L127
- R Core Team (2017) R Core Team. 2017, R: A Language and Environment for Statistical Computing, R Foundation for Statistical Computing, Vienna, Austria
- Sollima et al. (2019) Sollima, A., Baumgardt, H., & Hilker, M. 2019, MNRAS, 485, 1460
- Sollima et al. (2007) Sollima, A., Ferraro, F. R., Bellazzini, M., et al. 2007, ApJ, 654, 915
- Stetson et al. (2019) Stetson, P. B., Pancino, E., Zocchi, A., Sanna, N., & Monelli, M. 2019, MNRAS, 485, 3042
- van de Ven et al. (2006) van de Ven, G., van den Bosch, R. C. E., Verolme, E. K., & de Zeeuw, P. T. 2006, A&A, 445, 513
- van der Marel & Anderson (2010) van der Marel, R. P. & Anderson, J. 2010, ApJ, 710, 1063
- van Leeuwen et al. (2000) van Leeuwen, F., Le Poole, R. S., Reijns, R. A., Freeman, K. C., & de Zeeuw, P. T. 2000, A&A, 360, 472
- van Loon et al. (2007) van Loon, J. T., van Leeuwen, F., Smalley, B., et al. 2007, MNRAS, 382, 1353
- Zocchi et al. (2017) Zocchi, A., Gieles, M., & Hénault-Brunet, V. 2017, MNRAS, 468, 4429
- Zocchi et al. (2019) Zocchi, A., Gieles, M., & Hénault-Brunet, V. 2019, MNRAS, 482, 4713