Unraveling the Topological Phase of ZrTe5 via Magneto-infrared Spectroscopy
Abstract
For materials near the phase boundary between weak and strong topological insulators (TIs), their band topology depends on the band alignment, with the inverted (normal) band corresponding to the strong (weak) TI phase. Here, taking the anisotropic transition-metal pentatelluride ZrTe5 as an example, we show that the band inversion manifests itself as a second extremum (band gap) in the layer stacking direction, which can be probed experimentally via magneto-infrared spectroscopy. Specifically, we find that the band anisotropy of ZrTe5 features a slow dispersion in the layer stacking direction, along with an additional set of optical transitions from a band gap next to the Brillouin zone center. Our work identifies ZrTe5 as a strong TI at liquid helium temperature and provides a new perspective in determining band inversion in layered topological materials.
Narrow-gap semiconductors and semimetals have regained broad interests in the past decade, as they host a rich variety of topological materials including topological insulators (TIs) and semimetals TI_review_0 ; TI_review ; Vafek ; Burkov ; Armitage . The low-energy electronic structure of such materials usually exhibits mixing characters of both linear band (LB, , where is the wave vector) and parabolic band (PB, ), if higher-order terms are neglected. This concept is well reflected in the effective TI model BHZ_Zhang1 ; BHZ_Zhang2 , which has been proven successful in describing many topological material systems such as HgTe quantum wells BHZ_Molenkamp ; BHZ_Buttner ; BHZ_Smirnov , Bi2Se3 BHZ_Zhang1 ; BHZ_Orlita , alkali pnictides Bi (Na, K, Rb) BHZ_Fang_1 , Cd3As2 BHZ_Fang_2 , Pb1-xSnxSe PbSnSe_1 ; PbSnSe_2 , and transition-metal pentatelluride ZrTe5 Refl_NLW ; YJ_ZT5 .
The rising interest in ZrTe5 is due to the theoretical prediction of a room-temperature quantum spin Hall insulator phase in its monolayer limit Thoery1_FZ and the experimental observation of the chiral magnetic effect Arpes0_GDG , anomalous Hall effect Ong , and three-dimensional (3D) quantum Hall effect 3DQH in bulk material. However, because of the delicate dependence of its band topology on the lattice constants Thoery1_FZ ; NewTheory_Zhou , there has not yet been a consensus on the bulk topological phase of ZrTe5 from experiments Arpes0_GDG ; Refl1_NLW ; ARST_SHP ; STM_XQK ; Arpes4_AC ; Chen_PNAS , especially with several recent contradicting temperature-dependent studies Arpes1_MG ; Arpes2_XJZ ; Arpes5_YLC ; Temp1_ZT5 ; Strain_ZT5 ; Temp2_ZT5 . In these studies, the non-trivial topological phase is either probed through its surface states or relying on the transition behavior of certain indirect parameters such as conductivity. Alternatively, one could also seek to probe the PB component of ZrTe5, which is associated with band inversion and thus provide direct evidence of the band topology without changing external parameters such as temperature and strain. However, this direct approach has not been reported to date.
In this Letter, we show that the LB and PB components of the electronic structure of ZrTe5 can be determined using magneto-infrared (magneto-IR) spectroscopy, combining Faraday and Voigt geometry measurements. The application of a magnetic field () quantizes the electronic states into Landau levels (LLs). By carefully tracking the magnetic field dependence of the inter-LL transitions, we can extract important band parameters along the three principal crystal axes and reconstruct the 3D electronic structure of ZrTe5 with great energy resolution. Most saliently, we demonstrate both theoretically and experimentally that the band inversion leads to a second extremum (band gap) next to the Brillouin zone center, giving rise to two distinct sets of inter-LL transitions. Our results unambiguously identify ZrTe5 as a strong topological insulator (STI) at liquid helium temperature.
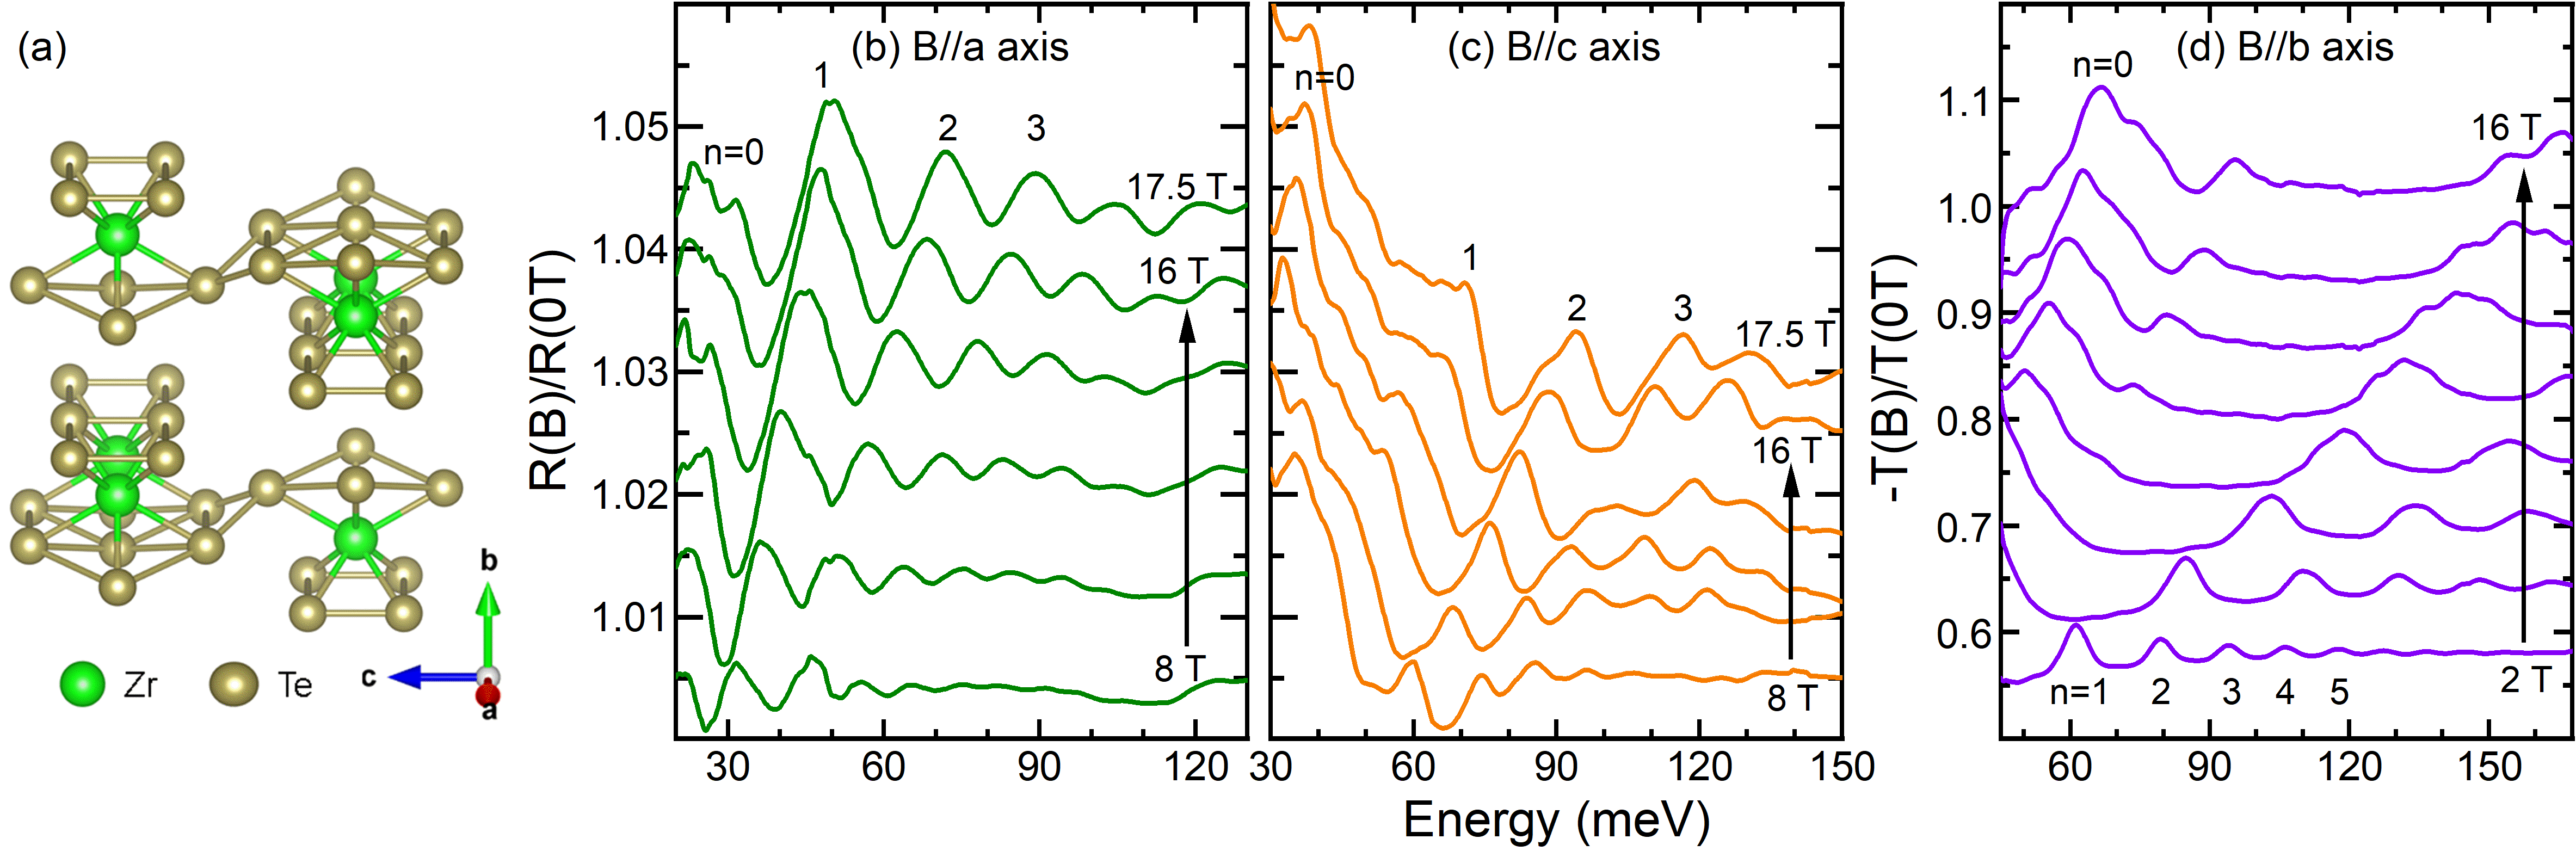
The ZrTe5 single crystals studied in this work were prepared by the Te-assisted chemical vapor transport method YJ_ZT5 or molten Te flux growth jgcheng . The orthorhombic crystal structure is illustrated in Fig. 1(a). The as-grown samples exhibit a shiny needle-like surface (typically 0.5 mm by 10 mm) in the -plane but with a thin thickness (typically 0.1 mm) along the -axis. With such high aspect ratio, the commonly used Faraday geometry measurement, where light travels in the magnetic field direction, is only suitable for studying the electronic structure in the -plane, while the Voigt geometry measurement, where light travels perpendicular to , is more effective for the study in the - and -planes. Specifically, to optimize the signal, we employed Faraday transmission measurements with -axis and Voigt reflection measurements with -axis and -axis, respectively. All the measurements were performed at 4.2 K with a magnetic field up to 17.5 T. Further crystal synthesis and experimental details can be found in the Supplementary Material (SM) SM .
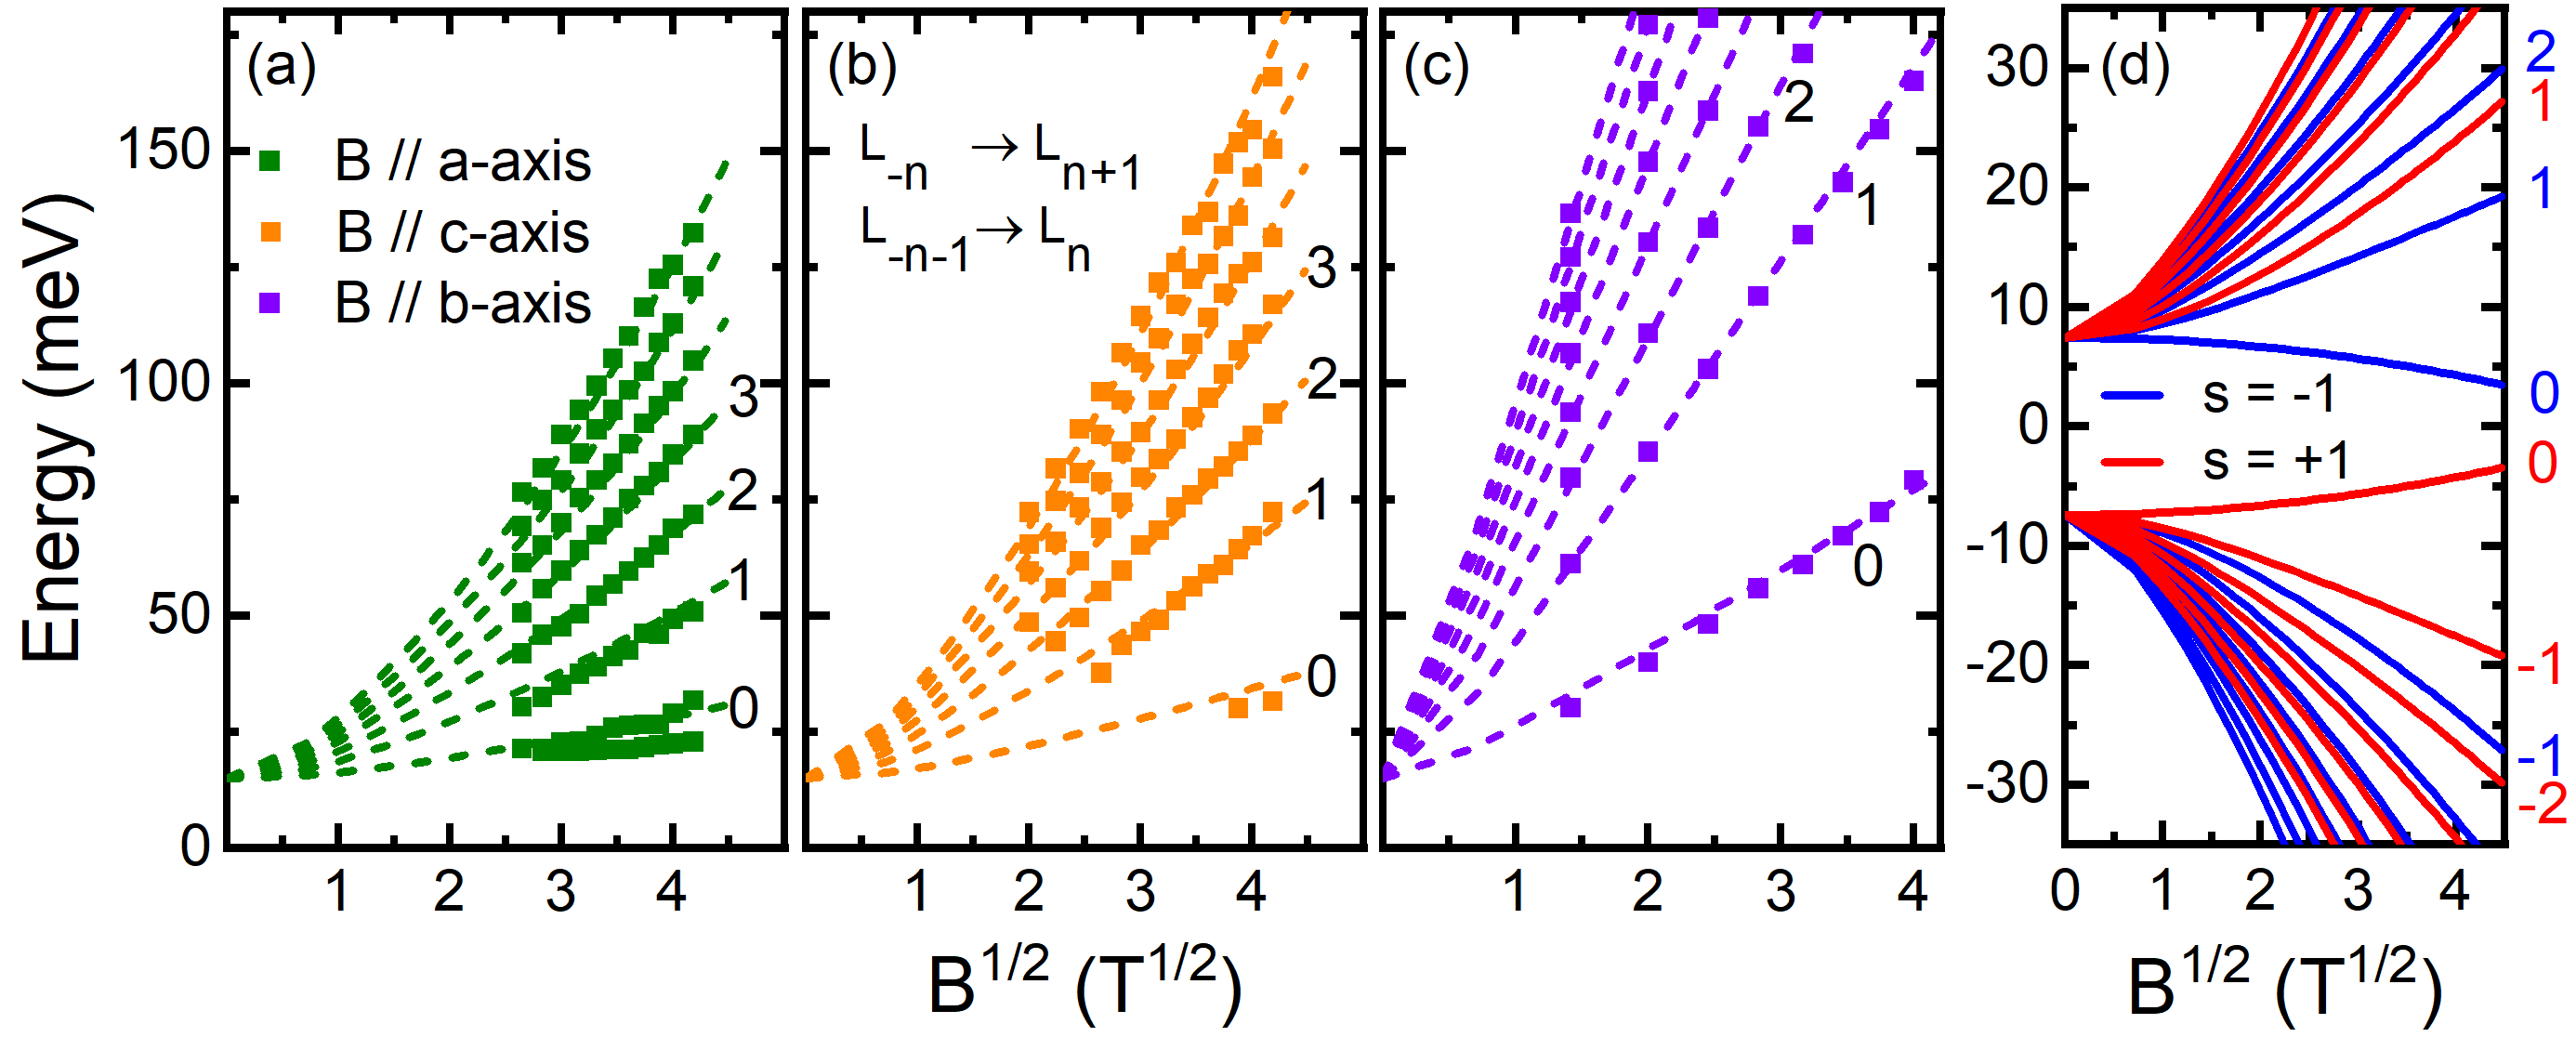
Figure 1(b-d) shows the normalized magneto-IR spectra of ZrTe5 with the magnetic field applied along different crystal axes. In all three cases, one can readily identify a series of peaks (or modes), which blue-shift as increases and can be attributed to specific inter-LL transitions labeled by integer . In Fig. 2(a-c), we summarize the magnetic field dependence of the transition energies as a function of by extracting the central energy of each mode at different magnetic fields. Here, for simplicity, we focus on the central peak of each transition with the strongest optical weight and omit the weak satellite peaks from the splitting of low-lying transitions.
By comparing the three cases in Fig. 2(a-c), one can see the anisotropy in the electronic structure of ZrTe5. On the one hand, the LL transition energies with -axis (Fig. 2(c)) exhibit a nearly perfect linear-in- dependence, characteristic of Dirac-like dispersion. On the other hand, the transition energies with -axis (Fig. 2(a)) and -axis (Fig. 2(b)) grow much more slowly with increasing and show strong deviations from the dependence. A closer inspection of Fig. 2(a,b) also reveals that if one linearly extrapolates (linear in ) the LL transitions to zero magnetic field, a negative energy intercept is obtained. This behavior is very similar to that in inverted PB semiconductors YJ_InAs .
Quantitatively, the modes in Fig. 2(c) can be described by a massive Dirac fermion model YJ_ZT5 ; 2DZT5_AA , where the LL energies read
| (1) |
with integer being the LL index, the band index, the electron charge, the reduced Planck’s constant, the Fermi velocity, and the Dirac mass. However, this model fails to explain the data in Fig. 2(a,b) because (1) the model predicts a positive zero-field intercept regardless of the sign of ; (2) for low-lying LL transitions (), the energy ratio of two adjacent modes significantly deviates from the model prediction; and (3) for high-order LL transitions (), the model predicts a linear-in- dependence at high magnetic fields but the experimental data curve up. All these deviations from the massive Dirac fermion model suggest strong band anisotropy in ZrTe5 and the necessity to extend the model to include PB contributions.
Next, we show that all our data can be well explained by a model that accounts for the symmetry at point, the PB contributions, and the material anisotropy. The effective Hamiltonian SM reads
where , , and . The -, -, and -directions correspond to the -, -, and -axes of ZrTe5, respectively. The electronic structure is then determined by a set of material parameters: (1) LB component ; (2) PB component , which is also called the band inversion parameter; and (3) Dirac mass . Both and carry anisotropy. The resulting LL spectrum of ZrTe5 reads at
| (2) | ||||
where , is the inverse magnetic length, and is the field induced gap. Representative Landau fan diagram for the case of -axis is shown in Fig. 2(d). This model is an extension of the effective TI model BHZ_Zhang1 ; BHZ_Zhang2 , but due to the band anisotropy, parameters and now represent the geometric average of their values in the plane perpendicular to the magnetic field SM . That is, for , and . Note that there is a sign freedom in Eq. (2) since simultaneously reversing the signs of and will not affect the results. In this work, we fix the sign of to be positive and allow the sign of to vary. A positive (negative) represents an inverted (normal) band, respectively.
With the above model, one can produce excellent fits to the experimental data in all configurations, as shown in Fig. 2(a-c). Here, we only consider the electric dipole transitions, and , while leaving the discussion of possible and transitions to SM SM . Our fitting results of -axis and -axis clearly show that the term breaks the energy dependence in Eq. (2) via introducing a linear-in- mass term (PB contribution). This PB component is comparable with the LB component, suggesting a relatively small and/or a relatively large in these two configurations. When -axis, however, the LB component dominates the LL transition energies due to the large . In this case, the PB contribution is relatively small, rendering the determination of the value less accurate in this direction note1 . More importantly, we note that the sign of cannot be solely determined from the data shown in Figs. 1 and 2, as the most influential PB contribution in Eq. (2), for a small , insensitive to the sign of .
Fortunately, we find an intriguing scenario that can help circumvent the above situation and resolve the topological phase of ZrTe5. This is shown in Fig. 3(a,b), where we plot the band dispersion along the -axis with different values for an inverted () and normal () band, respectively. For the inverted band (Fig. 3(a)), the electronic structures exhibit a local extremum not only at point but also at a non-zero -vector (denoted by point) when is sufficiently small. As increases, the extremum at point gradually disappears. On the contrary, such extremum at point never occurs in the normal band case (Fig. 3(b)) regardless of the magnitude of . From our experimental data shown in Figs. 1 and 2, one can extract the values along all three crystal axes with as small as m/s, close to the violet lines in Fig. 3(a,b). Therefore, the presence of a second extremum at point signifies band inversion in ZrTe5 and provide a smoking gun evidence for the STI phase. Practically, this direct approach does not require any quantitative analysis, but solid proof of the second extremum.
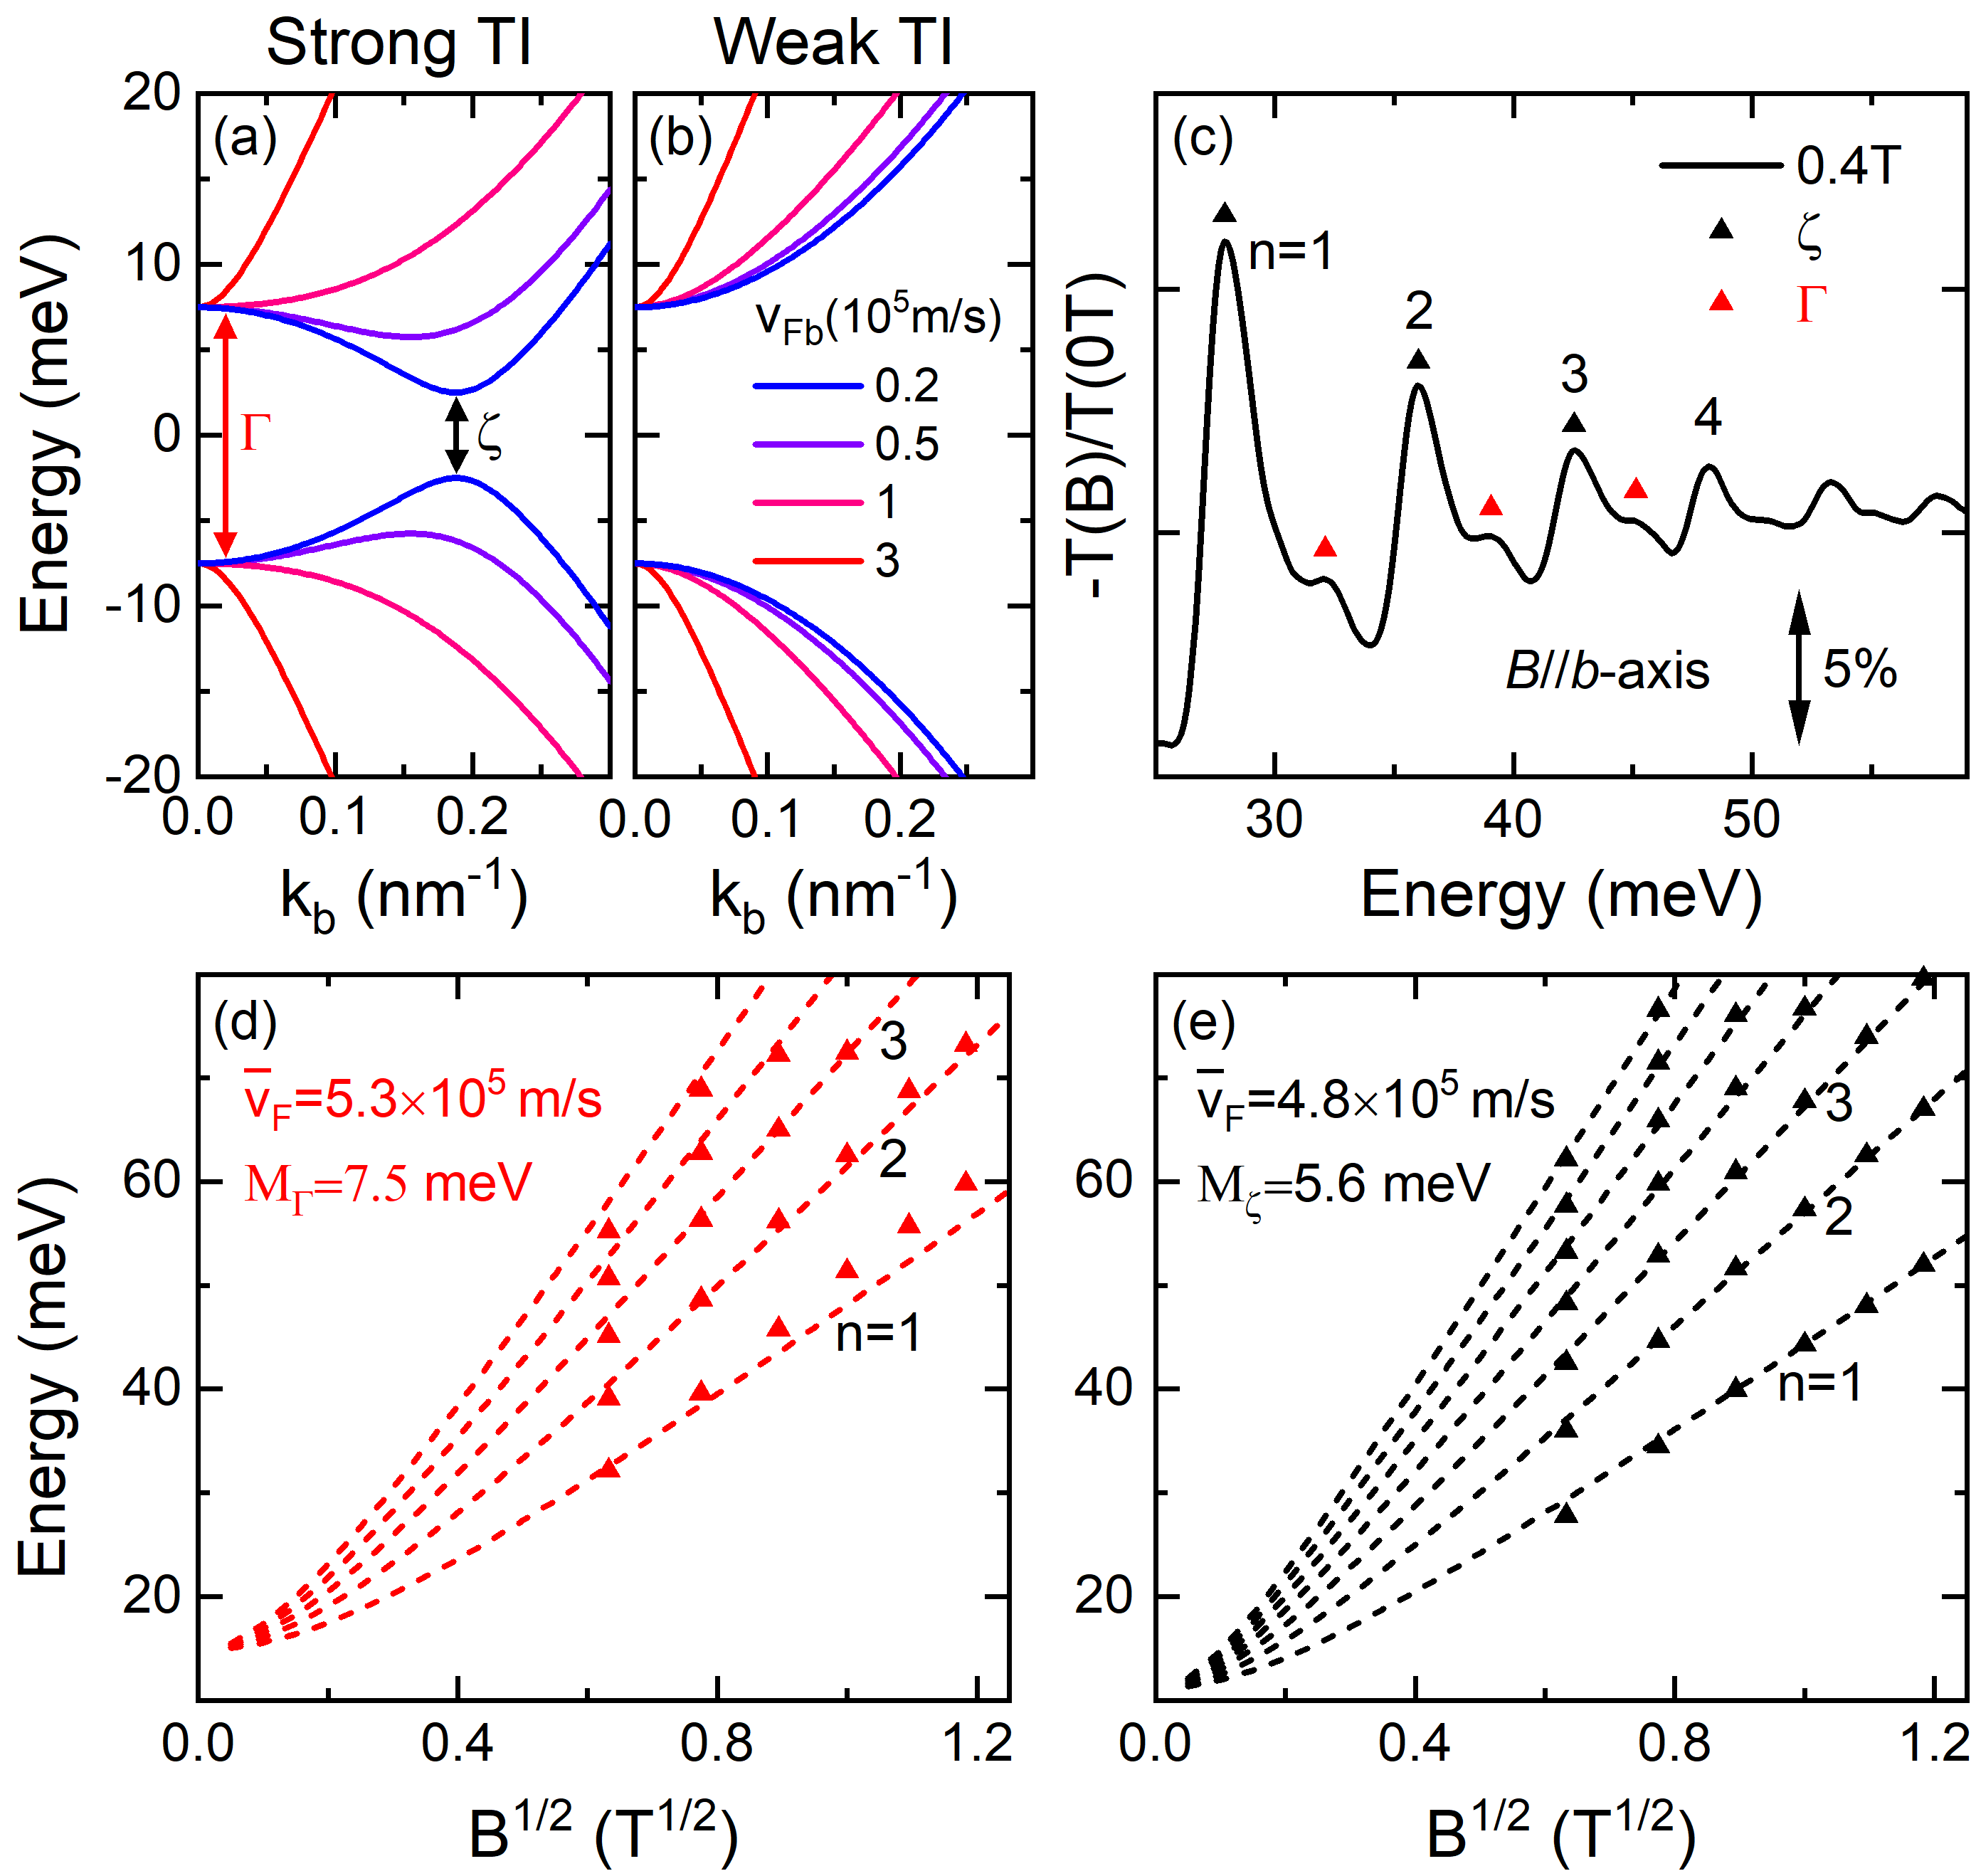
Since each local extremum in electronic structure carries a large density of states note1_5 , it can host a set of LL transitions under a magnetic field. This is indeed the case observed in our experiment when the magnetic field is applied in the slow direction (when -axis), as shown in Fig. 3(c). Here, due to the high quality of our ZrTe5 samples, clear interband LL transitions () occur in a very low field and unambiguously exhibit a doublet structure (marked by black and red up-triangles) before the field-induced linewidth broadening takes place. The energy splitting of the doublet at such a low magnetic field cannot originate from field-induced effects such as -factor or band asymmetry note2 . Linear extrapolation of the magnetic field dependence of the doublet reveals two different energy intercepts at zero field, suggesting that they belong to two distinct sets of LL transitions presumably from the (black) and (red) points, respectively. With increasing , the LB component becomes dominant, and the energy splitting caused by the mass difference between the and points diminishes. Therefore, our results strongly suggest that the ZrTe5 band is inverted, and it is in an STI phase at K.
For more quantitative analysis, one can simply fit each set of the LL transitions with the massive Dirac fermion model of Eq. (1), as a non-zero effectively renormalizes the Dirac mass in our anisotropic model SM . Figure 3(d,e) shows best fits to the data, where the extracted energy gaps are meV and meV, respectively. The extracted and values in Fig. 3(e) are also consistent with the fitting result of Fig. 2(c). With this information and using the zero-field model, one can further deduce eVnm2 SM . By combining with the fitting results of Fig. 2(a,b) along the - and -axes, the anisotropy of is now fully resolved with improved accuracy. Similarly, the anisotropy of at point can be deduced using the extracted values from Fig. 3(d) and Fig. 2(a,b).
| ZrTe5 @ point | |||
|---|---|---|---|
| (105m/s) | 6.85 | 0.50 | 4.10 |
| (eVnm2) | 0.12 | 0.21 | 0.08 |
| (meV) | 7.5 | 7.5 | 7.5 |
In Table I, we summarize the band parameters of ZrTe5 along the three principal crystal axes. Owing to the small , the low-energy electronic structure along the -axis is dominated by the PB component, leading to a much weaker dispersion than those along the LB dominated - and -directions. Our findings are consistent with recent transport and IR experiments Tp_WP ; Tp_FXX ; Tp_MLT ; JY_PNAS ; 2DZT5_AA .
In conclusion, we have performed a magneto-IR spectroscopy study of the band anisotropy in ZrTe5. We find that the LB dispersion (characterized by ) along the -axis is about one order of magnitude smaller than those along the - and -axes. When is small, the PB component can strongly modify the band dispersion, and the presence of a second extremum in -direction indicates band inversion. Incorporating prior results of first-principles calculations, we further identify ZrTe5 as an STI at low temperatures. Our work provides an experimental approach to directly infer the topological phase of anisotropic materials from their bulk band structure.
This work was primarily supported by the DOE (Grant No. DE-FG02-07ER46451), while crystal growth at GT and UT were supported by Grant No. DE-SC0018660 and DE-SC0020254. Crystal characterization was performed in part at the GT Institute for Electronics and Nanotechnology, a member of the National Nanotechnology Coordinated Infrastructure, which is supported by the NSF (Grant No. ECCS-1542174). IR measurements were performed at NHMFL, which is supported by the NSF Cooperative Agreement No. DMR-1644779 and the State of Florida. Y.J. acknowledges support from the NHMFL Jack Crow Postdoctoral Fellowship, and Z.J. acknowledges the NHMFL Visiting Scientist Program. J.W. acknowledges support from the China Scholarship Council. Work at Sandia is supported by a Laboratory Directed Research and Development project and a user project at the Center for Integrated Nanotechnologies, an Office of Science User Facility operated for the DOE Office of Science. Sandia National Laboratories is a multimission laboratory managed and operated by National Technology and Engineering Solutions of Sandia, LLC., a wholly owned subsidiary of Honeywell International, Inc., for the U.S. DOE’s National Nuclear Security Administration under contract DE-NA-0003525. This paper describes objective technical results and analysis. Any subjective views or opinions that might be expressed in the paper do not necessarily represent the views of the U.S. DOE or the U.S. Government.
References
- (1) M. Z. Hasan and C. L. Kane, Rev. Mod. Phys. 82, 3045 (2010).
- (2) X.-L. Qi and S.-C. Zhang, Rev. Mod. Phys. 83, 1057 (2011).
- (3) O. Vafek and A. Vishwanath, Annu. Rev. Condens. Matter Phys. 5, 83 (2014).
- (4) A. A. Burkov, Nat. Mater. 15, 1145 (2016).
- (5) N. P. Armitage, E. J. Mele, and A. Vishwanath, Rev. Mod. Phys. 90, 15001 (2018).
- (6) H. Zhang, C.-X. Liu, X.-L. Qi, X. Dai, Z. Fang, and S.-C. Zhang, Nat. Phys. 5, 438 (2009).
- (7) C.-X. Liu, X.-L. Qi, H. Zhang, X. Dai, Z. Fang, and S.-C. Zhang, Phys. Rev. B 82, 045122 (2010).
- (8) M. König, S. Wiedmann, C. Brüne, A. Roth, H. Buhmann, L. W. Molenkamp, X.-L. Qi, and S.-C. Zhang, Science 318, 766 (2007).
- (9) B. Büttner , Nat. Phys. 7, 418 (2011).
- (10) J. Ludwig, Yu. B. Vasilyev, N. N. Mikhailov, J. M. Poumirol, Z. Jiang, O. Vafek, and D. Smirnov, Phys. Rev. B 89, 241406(R) (2014).
- (11) M. Orlita , Phys. Rev. Lett. 114, 186401 (2015).
- (12) Z. J. Wang, Y. Sun, X. Q. Chen, C. Franchini, G. Xu, H. M. Weng, X. Dai, and Z. Fang, Phys. Rev. B 85, 195320 (2012).
- (13) Z. J. Wang, H. M. Weng, Q. S. Wu, X. Dai, and Z. Fang, Phys. Rev. B 88, 125427 (2013).
- (14) N. Anand, S. Buvaev, A. F. Hebard, D. B. Tanner, Z. G. Chen, Z. Li, K. Choudhary, S. B. Sinnott, G. D. Gu, and C. Martin, Phys. Rev. B 90, 235143 (2014).
- (15) G. Krizman, B. A. Assaf, T. Phuphachong, G. Bauer, G. Springholz, L. A. de Vaulchier, and Y. Guldner, Phys. Rev. B 98, 245202 (2018).
- (16) R. Y. Chen, Z. G. Chen, X.-Y. Song, J. A. Schneeloch, G. D. Gu, F. Wang, and N. L. Wang, Phys. Rev. Lett. 115, 176404 (2015).
- (17) Y. Jiang, Z. L. Dun, H. D. Zhou, Z. Lu, K.-W. Chen, S. Moon, T. Besara, T. M. Siegrist, R. E. Baumbach, D. Smirnov, and Z. Jiang, Phys. Rev. B 96, 041101(R) (2017).
- (18) H. M. Weng, X. Dai, and Z. Fang, Phys. Rev. X 4, 011002 (2014).
- (19) Q. Li, D. E. Kharzeev, C. Zhang, Y. Huang, I. Pletikosić, A. V. Fedorov, R. D. Zhong, J. A. Schneeloch, G. D. Gu, and T. Valla, Nat. Phys. 12, 550 (2016).
- (20) T. Liang , Nat. Phys. 14, 451 (2018).
- (21) F. Tang , Nature 569, 537 (2019).
- (22) Z. Fan, Q.-F. Liang, Y. B. Chen, S.-H. Yao, and J. Zhou, Sci. Rep. 7, 45667 (2017).
- (23) R. Y. Chen, S. J. Zhang, J. A. Schneeloch, C. Zhang, Q. Li, G. D. Gu, and N. L. Wang, Phys. Rev. B 92, 075107 (2015).
- (24) R. Wu , Phys. Rev. X 6, 021017 (2016).
- (25) X.-B. Li , Phys. Rev. Lett. 116, 176803 (2016).
- (26) G. Manzoni , Phys. Rev. Lett. 117, 237601 (2016).
- (27) Z.-G. Chen , Proc. Natl. Acad. Sci. USA 114, 816 (2017).
- (28) L. Moreschini, J. C. Johannsen, H. Berger, J. Denlinger, C. Jozwiak, E. Rotenberg, K. S. Kim, A. Bostwick, and M. Grioni, Phys. Rev. B 94, 081101(R) (2016).
- (29) Y. Zhang , Nat. Comm. 8, 15512 (2017).
- (30) L. Shen , J. Electron Spectrosc. Relat. Phenom. 219, 45 (2017).
- (31) B. Xu, L.-X. Zhao, P. Marsik, E. Sheveleva, F. Lyzwa, Y.-M. Dai, G.-F. Chen, X.-G. Qiu, and C. Bernhard, Phys. Rev. Lett. 121, 187401 (2018).
- (32) J. Mutch, W.-C. Chen, P. Went, T. Qian, I. Z. Wilson, A. Andreev, C.-C. Chen, and J.-H. Chu, Sci. Adv. 5, eaav9771 (2019).
- (33) Y. Tian, N. Ghassemi, and J. H. Ross, Jr., Phys. Rev. B 100, 165149 (2019).
- (34) P. Shahi, D. J. Singh, J. P. Sun, L. X. Zhao, G. F. Chen, Y. Y. Lv, J. Li, J.-Q. Yan, D. G. Mandrus, and J.-G. Cheng, Phys. Rev. X 8, 021055 (2018).
- (35) See Supplemental Material for crystal synthesis and experimental details, additional experimental data, extended effective Hamiltonian model, and optical weight analysis of magneto-IR spectra, which includes Refs. winkler ; Orlita_new .
- (36) For example, see our earlier work: Y. Jiang , Phys. Rev. B 95, 045116 (2017).
- (37) E. Martino , Phys. Rev. Lett. 122, 217402 (2019).
- (38) Note that the Dirac mass obtained from fitting the data in Fig. 2(c) is slightly smaller than that from Fig. 2(a,b). This is because the band gap along the -axis is not at point, as discussed in the context of Fig. 3.
- (39) The point assigned here is a second extremum of the same band as the point. Due to its proximity to the point, point is different from the point reported in Refs. Arpes1_MG ; Arpes2_XJZ , which belongs to another band across the Fermi energy.
- (40) Based on our prior results YJ_ZT5 , we estimate the splitting of the LL transition, due to -factor or band asymmetry, meV, one order of magnitude smaller than the 4 meV splitting observed in Fig. 4(c).
- (41) W. Yu, Y. Jiang, J. Yang, Z. L. Dun, H. D. Zhou, Z. Jiang, P. Lu, and W. Pan, Sci. Rep. 6, 35357 (2016).
- (42) X. Yuan , NPG Asia Mater. 8, e325 (2016).
- (43) J. L. Zhang, C. Y. Guo, X. D. Zhu, L. Ma, G. L. Zheng, Y. Q. Wang, L. Pi, Y. Chen, H. Q. Yuan, and M. L. Tian, Phys. Rev. Lett. 118, 206601 (2017).
- (44) J. Wang, J. Niu, B. Yan, X. Li, R. Bi, Y. Yao, D. Yu, and X. Wu, Proc, Natl. Acad. Sci. 115, 9145 (2018).
- (45) R. Winkler, Spin-Orbit Coupling Effects in Two-Dimensional Electron Hole Systems, Springer Tracts in Modern Physics, Vol. 191 (Springer-Verlag, Berlin, 2003).
- (46) M. Orlita, C. Faugeras, R. Grill, A. Wysmolek, W. Strupinski, C. Berger, W. A. de Heer, G. Martinez, and M. Potemski, Phys. Rev. Lett. 107, 216603 (2011).