IEEE Copyright Notice
©2020 IEEE. Personal use of this material is permitted. Permission from IEEE must be obtained for all other uses, in any current or future media, including reprinting/republishing this material for advertising or promotional purposes, creating
new collective works, for resale or redistribution to servers or lists, or reuse of any copyrighted component of this work in other works.
Accepted to be Published in: Proceedings of the 21st International Symposium on Quality Electronic Design (ISQED 2020), Mar. 25-26, 2020, Santa Clara, CA.
Analytical Estimation and Localization of Hardware Trojan Vulnerability in RTL Designs
Abstract
Offshoring the proprietary Intellectual property (IP) has recently increased the threat of malicious logic insertion in the form of Hardware Trojan (HT). A potential and stealthy HT is triggered with nets that switch rarely during regular circuit operation. Detection of HT in the host design requires exhaustive simulation to activate the HT during pre- and post-silicon. Although the nets with variable switching probability less than a threshold are primarily chosen as a good candidate for Trojan triggering, there is no systematic fine-grained approach for earlier detection of rare nets from word-level measures of input signals. In this paper, we propose a high-level technique to estimate the nets with the rare activity of arithmetic modules from word-level information. Specifically, for a given module, we use the knowledge of internal construction of the architecture to detect “low activity” and “local regions” without resorting to expensive RTL and other low-level simulations. The presented heuristic method abstracts away from the low-level details of design and describes the rare activity of bits (modules) in a word (architecture) as a function of signal statistics. The resulting quick estimates of nets in rare regions allows a designer to develop a compact test generation algorithm without the knowledge of the bit-level activity. We determine the effect of different positions of the breakpoint in the input signal to calculate the accuracy of the approach. We conduct a set of experiments on six adder architectures and four multiplier architectures. The average error to calculate the rare nets between RTL simulation and estimated values are below 2% in all architectures.
I Introduction
The use of fabrication equipment in offshore for manufacturing and testing Integrated Circuits (IC) has become common in the semiconductor design eco-system. In the long electronics supply chain with untrusted entities, IC has become prone to malicious modifications. Various malicious manipulations (insertions or deletions) exist that modify part of the design so that an attacker objective is achieved. Such covert manipulations, known as Hardware Trojan (HT), may affect the system by leaking the secret information, disabling parts of the system, weakening performance with early failures. HT is normally activated during a small time window and infrequent time of a circuit operation with low efforts. Since HT is typically connected to the rare switching nets of design, the time required to activate the triggering mechanism of HT can be significant. Various detection approaches exist that attempt to finding the minimal variations in power and timing due to the presence of HT. However, variants of HT concerning their physical properties, activation, and action characteristics make the current HT detection approaches non-unified [1].
To be stealthy as possible, an attacker utilizes rare nets in design to insert HT without any functional modification(s). Further, the size of the HT is adjusted (3-4x smaller than original design) accordingly so that any possible change in design parameter (timing, power, area) is insignificant during post-silicon detection technique (e.g. side-channel analysis, SCA) [2]. However, measurements during SCA are susceptible to pessimistic manufacturing variations. Several works studied how to improve the resolution of path-based timing analysis with additional test structure [3, 4], on-chip time-to-digital converter [5]. On the contrary, logic-based detection requires switching activity analysis of the internal nets that facilitate a non-invasive technique to investigate the possible HT in a design. This analysis acts as the de-facto for improved test vector generation to detect HT during pre-silicon [6, 7] and post-silicon [8, 9] using functional testing and verification.
Moreover, the switching activity of the design (both HT-free and HT-affected) is input vector dependent which can be generated randomly or following spatial correlation [10]. Further, functional testing is independent of process parameters that make it suitable for the attacker to simulate and find out the rare switching nets during pre-silicon. As the switching activity of the nets can vary within a wide range of values, an intelligent attacker can find a way of combining the rare nets with variable toggle rate to trigger HT. In both cases, the analysis of switching activity file regarding input vector occurs before HT insertion or detection. Such activity analysis also avoids the expensive and destructive de-packaging and de-layering of the encapsulated IC.
In this paper, we propose a new approach for estimating nets that switch rarely from input signal word-level statistics in a given Register Transfer Level (RTL) description. High-level estimation of rare nets provides fast and efficient localization of internal signals within an arithmetic module that can be responsible for hard-to-detect HT activation. Given a technology-independent RTL description of the arithmetic module, the proposed technique will guide the designer (defender) to locate rare transition activity nets analytically which is dependent on word-length and its’ statistics. This information can be used for efficient segmentation of a module into smaller sub-module(s) before logic synthesis. We develop this characterization technique based on Dual-Bit-Type (DBT) model [11] of the datapath components (adder and multiplier). The model breaks the component word-length into three regions of continuous bits: LSB, linear, and MSB regions. Highly correlated bits are found in MSB regions that exhibit non-random behavior and low transition activity. Thus, transition activity at MSB node(s) of the primitives (adder, multiplier, register, etc.), has been used to provide rare activity estimates of the architecture.
An attacker normally chooses nets with very rare internal logic conditions (low controllability and observability) to trigger HT. For efficient activation of HT, attacker considers the region(s) with low bit-level activity to avoid accidental triggering. Analytically, with known delay and statistical distribution of the architecture, an IP integrator can distinguish between competing architectures in terms of the lower rarity nets from word-level characteristics. To the best of our knowledge, the proposed approach is first to identify modules whose models of rare activity are characterized by statistics of input word-lengths. In summary, the novelty and contributions of the paper are as follows:
-
•
high level modeling of rare activity nets and location of these nets in the arithmetic module.
-
•
application of word-level statistics (mean, variance, and correlation coefficient) to estimate rare nets and hence complementing expensive simulation.
-
•
technology independent, closed-form analytical techniques to estimate rare nets in MSB region(s).
The rest of the paper is organized as follows. Section II provides background on HT detection techniques based on switching activity analysis. Section III describes the attack model, theoretical background and framework to estimate rare nets. Section IV reports the experimental results. Finally, section V draws the conclusion and future work.
II Background and Related Work
We briefly summarize the methods to detect (and possibly remove) malicious functionality at behavioral, RT-, and gate-level design. In particular, we review only the compact test vector generation technique to identify rare nodes during functional testing under specific assumptions and search space. A comprehensive overview of HT diversity is available in [12].
Although the HT triggering mechanisms are non-trivial, we classify the test pattern generation methods into two broad categories, namely, statistical- and probabilistic-modeling. With statistical modeling, one can simulate the circuit under randomly generated test patterns and differentiate rare nets from the rest based on an arbitrary triggering threshold. Statistical technique such as MERO [13] prunes the test vector space functional simulation to improve ‘Trojan Coverage’ and ‘Trigger Coverage’. Genetic algorithm and Boolean Satisfiability based ‘Trojan sensitization’ have been proposed in [14] to improve the detection sensitivity. An automatic and compact test vector generation algorithm to aid in the side-channel analysis is proposed in [15, 16]. An improved methodology to increase bit-level transition activity is proposed in [17]. These approaches did not take data correlation (both spatial and temporal) into account and utilized random vector-based simulation. However, the probabilistic model of dependencies exists for input data sequence that may appear at the re-convergent input(s) in a design [18, 19].
Probabilistic modeling approaches propagate the switching probability of primary inputs to estimate the internal switching activities in design. Characteristic polynomial based signature of the Circuit Under Test (CUT) is proposed in [20]. With the help of 2-to-1 MUXs, the switching activity of rare nets has been improved considering only one form of transition ( or ) [21].
Statistical signal correlation-based HT detection techniques avoid the triggering state and payload sensitization at the output. In [22], the authors presented an information-theoretic approach to simulation data to detect HT. Cross-correlation based test vector generation technique for the hard-to-reach region in design is proposed in [23].
Unlike previous studies, our work (a) focuses on word-level statistical behavior to estimate rare nets, (b) provides an early-on estimation framework without RTL and low-level simulation, and (c) requires no knowledge of internal implementation of the architecture.
III Proposed Approach and Implementation
III-A Threat Model
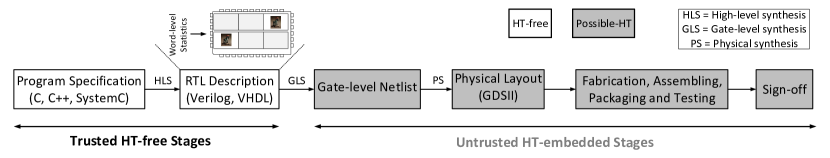
Traditional HT attacks deal with an agent who maliciously inserts some of her chosen logic to ensure that the additional circuitry will be activated during rare conditions. In our threat model, we assume two parties, a benign designer, who develops the RTL model using trustworthy High-Level Synthesis (HLS) tool and an attacker to whom the designer ports the RTL design for system integration during pre-silicon or from whom the end-user accepts the design as a packaged product during post-silicon (Fig. 1). We also assume the attacker has access to a subset of IP models drawn from the same distributor to make it harder to discriminate between malicious and benign IP. As part of the attacker objective, they control exactly the triggering logic and location of HT that have minimal impact on global parameters (power, performance, and area). Another goal of the attacker is to ensure the higher misclassification rate against the measures to detect HT. We can broadly classify attacker goal in two categories (targeted and non-targeted). In a targeted attack setting, h/she may disable the device on-field or degrade the reliability earlier than Mean Time to failure (MTF). During a non-targeted attack, the adversary may aim to leak sensitive information as a backdoor instead of ‘visible’ consequences.
We aim to explore the possibility and location of HT attack in an RTL IP using its model parameters. Given a high-level IP/IC description, our approach checks two critical properties. First, the designer can locate whether a module in IP, in isolation, generates more rare activity nets than others given a triggering threshold. Second, a compact test pattern generation algorithm can be developed to identify any malicious updates. We also find that the proposed analytical approach can be complemented with an expensive RTL simulation to provide a qualitative notion of stealthy HT behavior.
III-B Theoretical modeling for transition activity estimation
Let be an -bit signal in the time interval for a single-input module. Given normal distribution of input data environment, the signal probability for the -th bit, of to be evaluated to logic-1 can be calculated as follows [25]:
| (1) |
where is the set of all elements in that the signal can assume. The value at any net can be derived, given word-level statistical parameters such as mean (), variance (), and spatio-temporal autocorrelation (). Therefore, temporally uncorrelated input data leads to an error in the signal activity estimation of internal nets. Mean, variance, and spatio-temporal autocorrelation of can be expressed as
| (2) |
| (3) |
| (4) |
The normalized transition activity (toggle), of the over all bit positions is given by
| (5) |
where denotes a logic-1 to logic-0 transition, denotes a logic-0 to logic-1 transition, and T is the clock period. We can also define from [26] to input data for exact synthesis of single-bit signal in terms of as follows:
| (6) |
For uncorrelated data , Eqn. 6 reduces to Eqn. 5. For a given zero-mean Gaussian signal, the signal probability () at the bit position is 0.5 in 2’s complement representation. Hence, bit-level switching activity in Eqn. 6 can be rewritten as follows:
| (7) |
An accurate estimation of switching activity (independent of encoding of the signal) in the sign-bit, has been proposed in [26] in terms of Eqn. 4:
| (8) |
From Eqns. 7 and 8, we can determine the correlation of sign-bit in terms of word-level correlation () from the following expression:
| (9) |
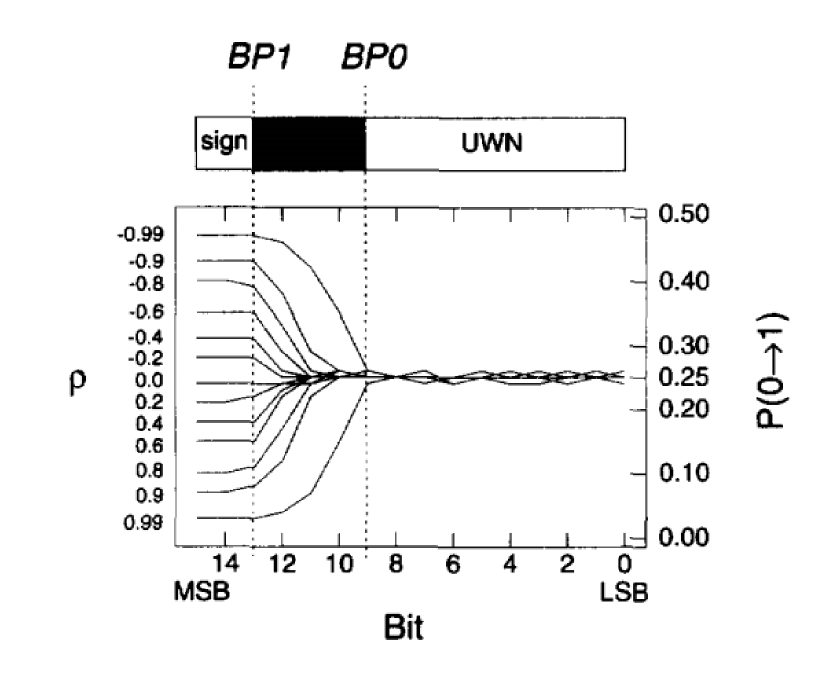
Calculation of BP0 and BP1: Using a computationally inexpensive method, we can divide a signal in 2’s complement representation into three different regions (LSB, linear, and MSB) based on transition activity. We can see from Fig. 2 that the temporal correlation () from the LSB up to a first breakpoint is almost zero and hence we observe the maximum switching activity in LSB region (). The uncorrelated bits in LSB region exhibit random switching where both and are equal to . We can see a linear increase in from to sign bit (MSB) and lower switching activity in the sign region. In the linear region (), we see an increasing spatial correlation and correspondingly, decrease in the switching activity. We can compute the first breakpoint, BP0 as follows from [27]:
| (10) |
where is the rounding operation. We multiply by two to include both positive and negative region (-2N-1 2N-1 - 1). Similarly, we can define BP1 as follows from [27]:
| (11) |
Hence, with the knowledge of BP0 and BP1, we can express the correlation coefficient values as follows [25]:
| (12) |
III-C Framework for rare activity nets estimation
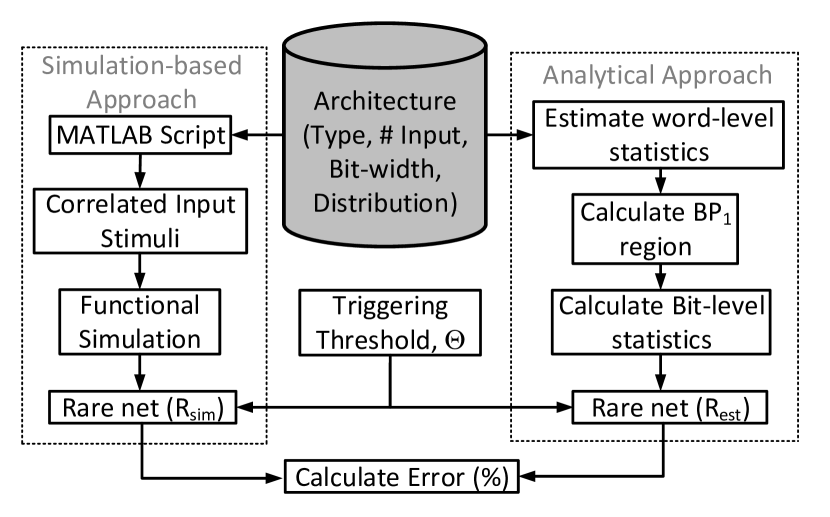
As we can see from Fig. 2, the highly correlated bit(s) in the MSB region of a word lead to minimal switching. As such, the MSB region(s) manifest themselves as a possible location of HT. Alternatively, if higher toggle activity of some internal nets happens in rare condition, one can focus on LSB region of a signal word. The length of both regions can be demonstrated from word-level models of macro-blocks. The high-level estimation flow to identifying and localizing Trojan vulnerable blocks using model parameters is shown in Fig. 3. It contains three steps, namely, modeling, estimation, and simulation phase.
Modeling phase: We assume the signal shows Gaussian distribution with non-zero mean and is in two’s complement representation. The modeling parameters selected are independent of the distribution type and signal representation. On a higher level of abstraction, we can model the word-level characteristics as follows:
| (14) |
where and refer to the signal into consecutive timestamp and being the input bit-width of the signal. We can determine and from of the signal using Eqns. 2 and 3. Using these characteristics data, we can determine the bit-level statistics of any RTL design. The bit-level characteristics can be used to derive an exact estimation of rare nets that are captured during input dependent functional simulation of the design. In this paper, we restrict our analyses to word-level information and it provides us architecture- and pattern-independent tight upper bound estimation of the nets that fall under particular triggering probability. In some cases, the accuracy loss can be significant which is architecture-dependent but it can be significantly improved by considering bit-level statistics at the cost of characterization time. Nevertheless, our word-level modeling approach can be used for architecture’s characterization of HT vulnerability in less than a minute. We present a heuristic to intelligently select sub-module(s) that have shown good accuracy in practice.
Estimation phase: Enumerating all possible input patterns (4n patterns for primary inputs) for a large circuit are not helpful to guide us the Trojan location and triggering logic. During the simulation-based approach, an attacker considers the sign transition(s) at the internal nodes of a module which are input pattern dependent and drawn from a particular distribution. It also turns out that the inexact delay model during simulation can lead to inaccurate transition probability at circuit nodes.
On the contrary, the statistical properties of the possible input stream in a design can lead to better search technique of Trojan location. Moreover, the statistical estimation can ignore the delay influences. Although the assumption made by the attacker on the signal distribution cannot be assured during pre-silicon, word-level statistical information required for breakpoint estimation is independent of the distribution type. To reduce the complexity and higher flexibility in the estimation, we focus on calculating breakpoints (BP0 and BP1) from statistical properties. Similar to Eqn. 14, we can determine a functional relationship between breakpoints, signal statistics, and architecture bit-width as follows:
| (15) |
where () and will provide the required to determine breakpoints from Eqns. 10 and 11. Given an RTL datapath design, we divide the circuit into a set of sub-components where each sub-component is a bit-slice design. Considering each sub-component separately, we can find total nets from the structural description of the architecture. Using Eqn. 15 for breakpoints estimation, first, we find the sub-module(s) that lie from BP1 position to the largest bit position required to represent the signal and then the nets within these sub-modules to calculate total rare triggering nets. Let us assume there are modules in the architecture of type , and each type has nets. If the set of modules that can be responsible for providing rare nets to Trojan triggering are (), the following equation accounts all these rare nets:
| (16) |
Clearly, the module having least rare nets can be found as:
| (17) |
Simulation phase: To investigate the model accuracy, we perform gate-level simulation and measure the difference of nets between estimated and simulated value. For the simulation, we generate the correlated input stream according to statistics of the above modeling and estimation phase. For each n-bit arithmetic architecture, we generate different word-level statistics () and calculate the breakpoints (BP0, BP1). Depending on the statistics, the signal value can range from () to (). For each choice of the breakpoint (BP1), we perform the simulation to count the nets whose signal transitions fall under particular triggering probability. For architecture with two operands and (un)equal bit-width, we can determine the upper and lower bound in the LSB and MSB region as follows [29]:
| (18) |
To assess the model, we use the following equations to estimate absolute error, and mean square error, :
| (19) |
where denotes the number of triggering threshold bound in a particular BP1 position, and refer the simulated and estimated rare triggering nets.
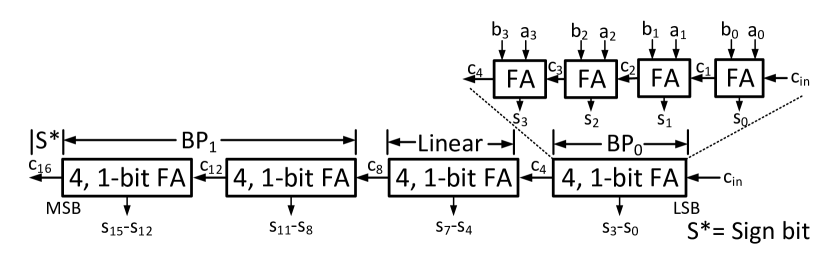
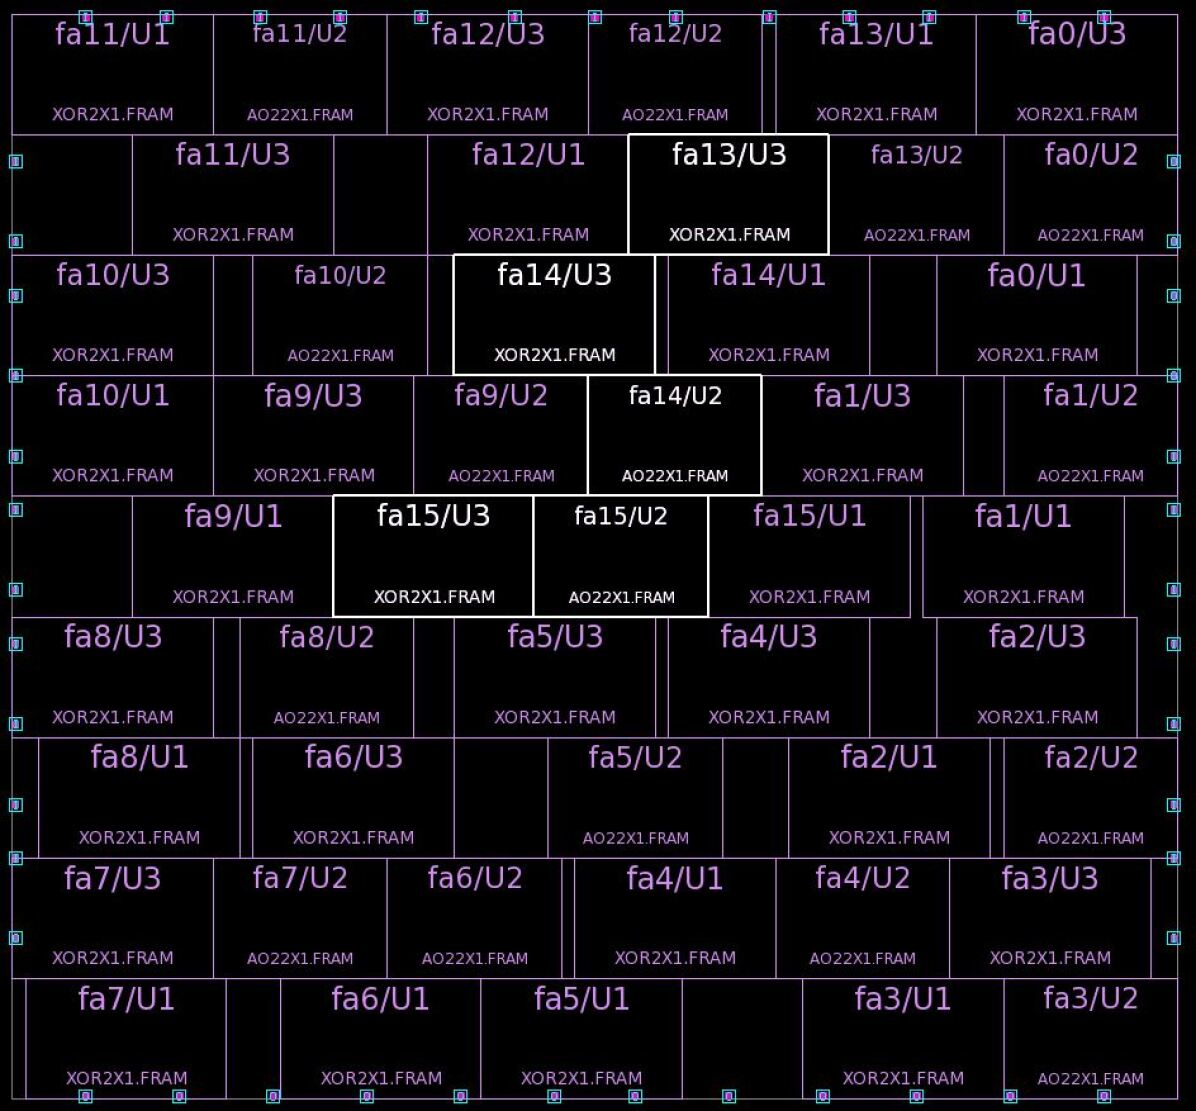
Motivational example to estimate rare activity nets: A 16-bit Ripple-Carry Adder (RCA) is presented in Fig. 4 where we decompose the adder into four blocks. Each block contains four, 1-bit Full Adder (FA). Let us assume, given the statistics in terms of input operands, we calculate the breakpoints position as BP0 (0th to 3rd), linear (4th to 7th), and BP1 (8th to 15th). As mentioned earlier, the rarest activity will be generated in the BP1 region. Hence, HT vulnerable region can be modeled as the location of FA from 15th- to 8th-bit position and the sum of nets in these FA’s in 3rd and 4th block constitute the upper bound of rare activity nets for ripple-carry adder. However, in the case, where the operands have different bit-width, we see two distinct scenarios. In one case, BBP1 is contained in ABP0 when (ABP0 > BBP0) and vice-versa when (ABP0 < BBP0). In both cases, we use Eqn. 18 to calculate the breakpoints. For triggering threshold < 10-5, we found 5 nets that belong to FA13, FA14 and FA15. After the module placement shown in Fig. 5, we also found the geometric positions of these cells are significantly close enough to localize HT triggering signal that would increase HT impact. Hence, the word-level estimation clearly indicates that the majority of rare transitions happen in BP1 position.
IV Experimental Results
In this section, we present the results of our word-level statistics based on rare activity net modeling approach. We have evaluated the accuracy of the approach on six adder and four multiplier architectures each having width of 8- and 16-bit. For each architecture, we assume two operands are available with equal bit-width. All architectures are taken from OpenCores (cite).
First, we generate correlated input vectors for different BP1 positions using an in-house MATLAB script. Then we perform RTL simulation using Synopsys VCS-MX on each architecture for 10000 input vectors and find out the nets having variable toggle probability in between 0 to 10-6. The total number of rare nets within a toggle threshold by the analytical approach of a given architecture are compared to those from the simulations and accordingly, the average errors are computed.
 |
 |
 |
 |
| (a) | (b) | (c) | (d) |
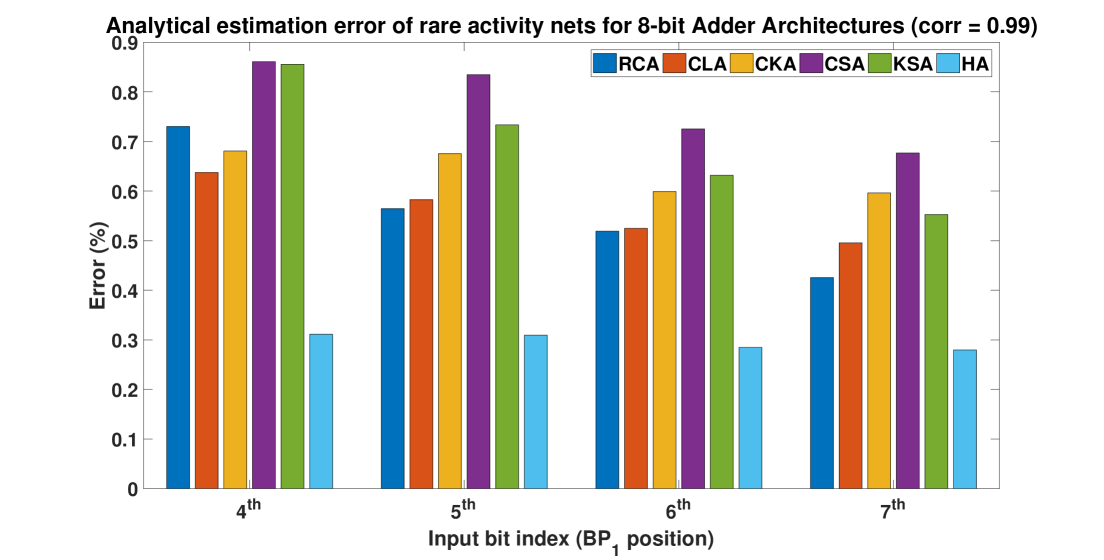
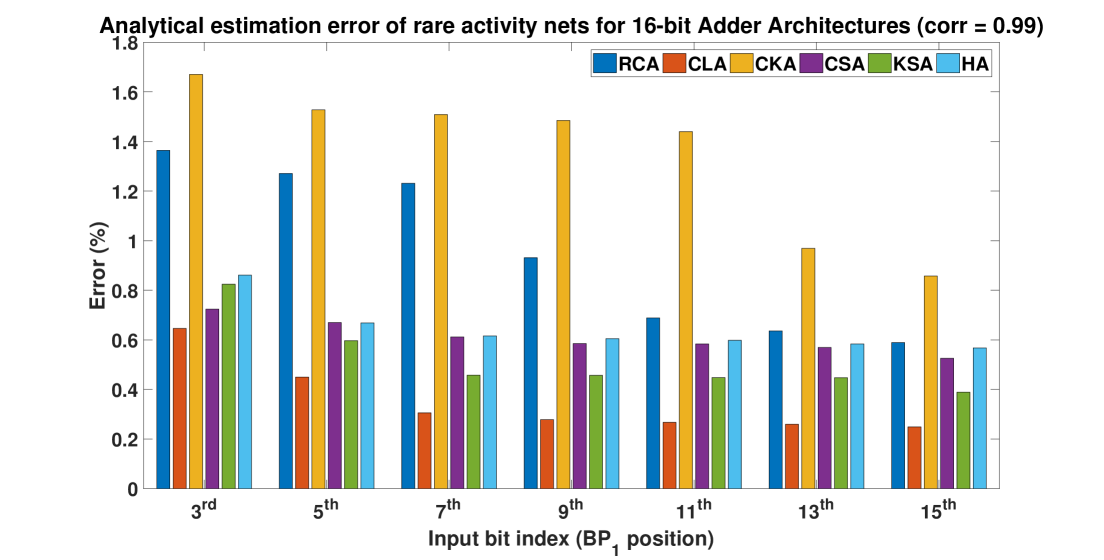
Analytical estimation error of adder architectures: We have considered Ripple Carry (RCA), Carry Lookahead (CLA), Carry Skip (CKA), Carry Select (CSA), Kogge-Stone (KSA), and Hybrid Adder (HA). Fig. 6 (a,b) shows error (%) vs. BP1 positions for adders of 8- and 16-bit for correlation ( = 0.99). Reference values of rare nets are obtained from Switching Activity Interchange Format (SAIF) file after the RTL simulation. It is evident from the figure that as BP1 moves towards sign bit region, analytical estimation is close to functional simulation. One important source of error is when BP1 is close to LSB region. This is because we see a limited range of random activity and simulation also considers the glitch activities (e.g. or ) as a transition. An attacker may want to localize the triggering signals within a sub-module to evade SCA. Otherwise, incorporating rare nets from different sub-modules that are placed far away in architecture would increase detection sensitivity.
From Table I, we see CLA shows average error less than 0.4% while that due to CKA, the average error is around 1.35%. This is because, in CLA, we have unrolled carry equations to build carry network of given bit-width. Although the delay increases due to each additional level of lookahead, however, we can closely approximate the rare nets as we decompose the carry equations to basic gates. In CKA, we have skip paths for each 4-bit adder blocks. Although we have the shortest carry propagation time through the skip blocks, we even include the nets of the skip logic when the bit-width from BP1 position to sign-bit is not multiple of 4. Though it simplifies the estimation, it implies an effect on error calculation.
| Arch. | 8-bit | 16-bit | |
| Adder | RCA | 0.95 | 0.55 |
| CLA | 0.56 | 0.35 | |
| CKA | 1.35 | 0.63 | |
| CSA | 0.77 | 0.60 | |
| KSA | 0.69 | 0.51 | |
| HA | 0.64 | 0.29 | |
| Multiplier | Array | 0.81 | 0.78 |
| Vedic | 0.83 | 0.80 | |
| Dadda | 0.57 | 0.55 | |
| Booth | 0.27 | 0.22 |
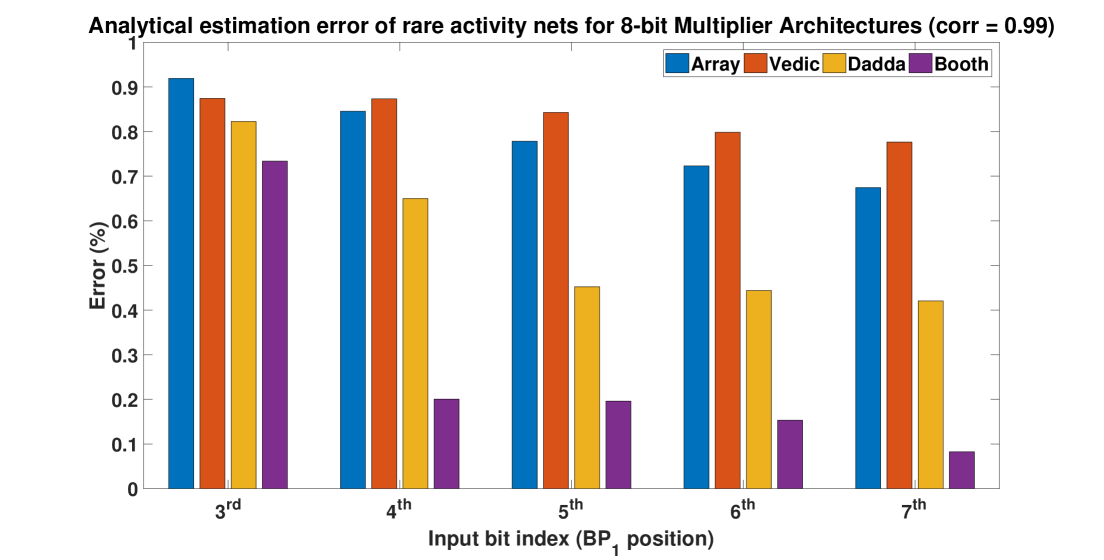
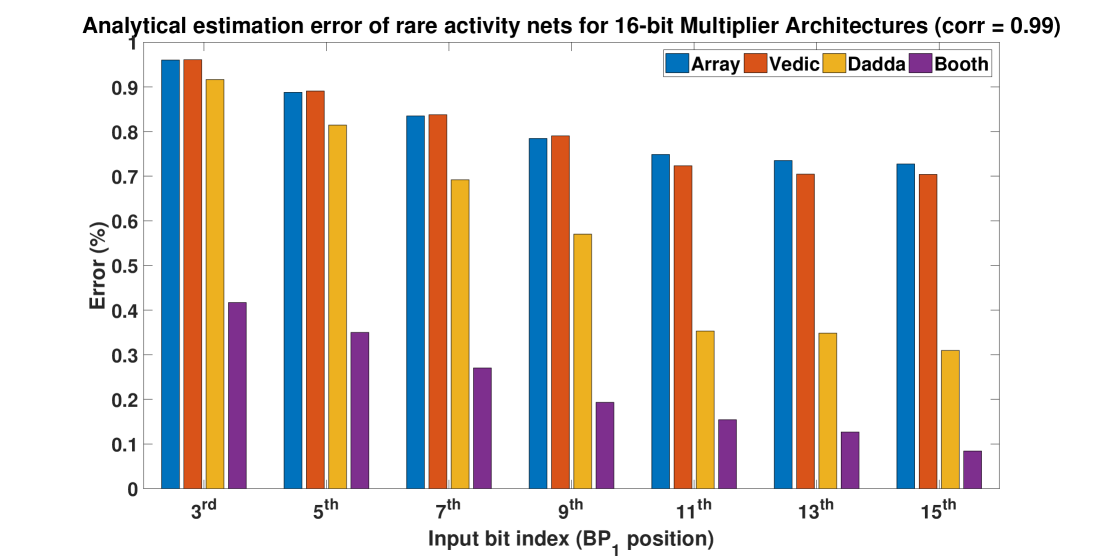
Analytical estimation error on multiplier architectures: Similar to adder architecture, we consider four multiplier architectures (array, vedic, dadda, booth) of two different bit-widths (8- and 16-bit). We consider the correlation value () of the signal to be 0.99 and correspondingly we estimate the BP1 position. For both bit-widths, we see booth multiplier shows least error (0.27% for 8bit and 0.22% for 16bit) whereas vedic multiplier shows the highest error (0.83% for 8bit and 0.80% for 16bit). For booth multiplier, the implementation is fully parallel and carry-free, hence the estimation closely matches with the simulation. For vedic multiplier, we can determine the partial products in parallel but it requires more than two additional levels of adders (e.g. CLA). These additional levels would sufficiently relate to the error (< 1%) in vedic multiplier.
V Conclusion
In this paper, we present macro-models to estimate rare nets in adder and multiplier architectures using word-level input statistics. We have shown that input statistics can closely approximate the rare triggering probabilities of internal nets in design and locate them as well. Such modeling techniques of high-level rare activity nets can reduce the Trojan detection time and complement the expensive low-level simulations. We analyzed both architectures of different bit-widths and found the error within 1-2%. In the future, we plan to find both combinational and sequential Trojan triggering logic from the modeling-based approach with low false positive/negative rates.
References
- [1] M. Tehranipoor and F. Koushanfar. A Survey of Hardware Trojan Taxonomy and Detection. IEEE Design Test of Computers, 27(1):10–25, Jan 2010.
- [2] D. Agrawal, S. Baktir, D. Karakoyunlu, P. Rohatgi, and B. Sunar. Trojan Detection using IC Fingerprinting. In 2007 IEEE Symposium on Security and Privacy (SP ’07), pages 296–310, May 2007.
- [3] B. Cha and S. K. Gupta. Efficient Trojan Detection via Calibration of Process Variations. In 2012 IEEE 21st Asian Test Symposium, pages 355–361, Nov 2012.
- [4] C. Lamech and J. Plusquellic. Trojan detection based on delay variations measured using a high-precision, low-overhead embedded test structure. In 2012 IEEE HOST, pages 75–82, June 2012.
- [5] D. Ismari, J. Plusquellic, C. Lamech, S. Bhunia, and F. Saqib. On detecting delay anomalies introduced by hardware Trojans. In 2016 IEEE/ACM ICCAD, pages 1–7, Nov 2016.
- [6] M. Banga, M. Chandrasekar, L. Fang, and M. S. Hsiao. Guided Test Generation for Isolation and Detection of Embedded Trojans in Ics. In Proceedings of the 18th ACM GLSVLSI, pages 363–366, New York, NY, USA, 2008. ACM.
- [7] S. Dupuis, G. D. Natale, Marie-Lise Flottes, and B. Rouzeyre. Identification of Hardware Trojans triggering signals. In First Workshop on Trustworthy Manufacturing and Utilization of Secure Devices, 2013.
- [8] N. Lesperance, S. Kulkarni, and K.T. Cheng. Hardware Trojan detection using exhaustive testing of k-bit subspaces. In The 20th ASPDAC, pages 755–760, Jan 2015.
- [9] H. Salmani and M. Tehranipoor. Layout-aware switching activity localization to enhance hardware Trojan detection. IEEE TIFS, 7(1):76–87, 2012.
- [10] S. A. Islam, L. K. Sah, and S. Katkoori. Empirical Word-Level Analysis of Arithmetic Module Architectures for Hardware Trojan Susceptibility. In 2018 AsianHOST, pages 109–114, Dec 2018.
- [11] P. E. Landman and J. M. Rabaey. Architectural power analysis: The dual bit type method. IEEE TVLSI, 3(2):173–187, June 1995.
- [12] K. Xiao, D. Forte, Y. Jin, R. Karri, S. Bhunia, and M. Tehranipoor. Hardware Trojans: Lessons Learned After One Decade of Research. ACM TODAES, 22(1):6:1–6:23, May 2016.
- [13] R. S. Chakraborty, F. Wolff, S. Paul, C. Papachristou, and S. Bhunia. MERO: A Statistical Approach for Hardware Trojan Detection. In CHES 2009, pages 396–410, Berlin, Heidelberg, 2009. Springer Berlin Heidelberg.
- [14] S. Saha, R. S. Chakraborty, S. S. Nuthakki, Anshul, and D. Mukhopadhyay. Improved Test Pattern Generation for Hardware Trojan Detection using Genetic Algorithm and Boolean Satisfiability. Cryptology ePrint Archive, Report 2015/1252, 2015.
- [15] J. Cruz, Y. Huang, P. Mishra, and S. Bhunia. An automated configurable Trojan insertion framework for dynamic trust benchmarks. In 2018 DATE, pages 1598–1603, March 2018.
- [16] Y. Huang, S. Bhunia, and P. Mishra. MERS: Statistical Test Generation for Side-Channel Analysis Based Trojan Detection. In Proceedings of the 2016 ACM CCS, CCS ’16, pages 130–141, New York, NY, USA, 2016. ACM.
- [17] H. Li and Q. Liu. Hardware Trojan detection acceleration based on word-level statistical properties management. In 2014 FPT, pages 153–160, Dec 2014.
- [18] M. G. Xakellis and F. N. Najm. Statistical Estimation of the Switching Activity in Digital Circuitry. In 31st DAC, pages 728–733, June 1994.
- [19] R. Marculescu, D. Marculescu, and M. Pedram. Probabilistic modeling of dependencies during switching activity analysis. IEEE TCAD, 17(2):73–83, Feb 1998.
- [20] S. Jha and S. K. Jha. Randomization Based Probabilistic Approach to Detect Trojan Circuits. In 2008 11th IEEE High Assurance Systems Engineering Symposium, pages 117–124, Dec 2008.
- [21] B. Zhou, W. Zhang, S. Thambipillai, and J. K. J. Teo. A low cost acceleration method for hardware trojan detection based on fan-out cone analysis. In 2014 CODES+ISSS, pages 1–10, Oct 2014.
- [22] B. Çakir and S. Malik. Hardware Trojan Detection for Gate-level ICs Using Signal Correlation Based Clustering. In Proceedings of the 2015 DATE, DATE ’15, pages 471–476, San Jose, CA, USA, 2015. EDA Consortium.
- [23] W. Zhao, H. Shen, H. Li, and X. Li. Hardware Trojan Detection Based on Signal Correlation. In 2018 IEEE ATS, pages 80–85, Oct 2018.
- [24] Subhasish Mitra, H-S Philip Wong, and Simon Wong. Stopping hardware trojans in their tracks. IEEE Spectrum, 20:2015, 2015.
- [25] S. Ramprasad, N. R. Shanbha, and I. N. Hajj. Analytical estimation of signal transition activity from word-level statistics. IEEE TCAD, 16(7):718–733, July 1997.
- [26] S. Bobba, I. N. Hajj, and N. R. Shanbhag. Analytical expressions for average bit statistics of signal lines in DSP architectures. In ISCAS ’98, volume 6, pages 33–36 vol.6, May 1998.
- [27] J. H. Satyanarayana and K. K. Parhi. Theoretical analysis of word-level switching activity in the presence of glitching and correlation. In Proceedings Ninth GLSVLSI, pages 46–49, March 1999.
- [28] S. Nikolaidis, E. Karaolis, and E. D. Kyriakis-Bitzaros. Estimation of signal transition activity in fir filters implemented by a mac architecture. IEEE TCAD, 19(1):164–169, Jan 2000.
- [29] J. A. Clarke, G. A. Constantinides, P. Y. K. Cheung, and A. M. Smith. Glitch-aware output switching activity from word-level statistics. In 2008 IEEE International Symposium on Circuits and Systems, pages 1792–1795, May 2008.