ISM: molecules – galaxies: ISM – radio lines: galaxies
HCN 3-2 survey towards a sample of local galaxies
Abstract
We present observations of HCN 3-2 emissions towards 37 local galaxies using 10-m Submillimeter Telescope (SMT). HCN 3-2 emission is detected in 23 galaxies. The correlation of infrared luminosity () and the luminosity of HCN 3-2 line emission measured in our sample is fitted with a slope of 1.11 and correlation coefficient of 0.91, which follows the linear correlation found in other dense gas tracers in the literatures. Although molecular gas above a certain volume density threshold (i.e., 104 cm-3) statistically gave similar relation with infrared luminosity, the large scatter of HCN 3-2/HCN1-0 ratios for galaxies with different indicates that dense gas masses estimated from the line luminosities of only one transition of dense gas tracers should be treated with caution for individual galaxies.
1 Introduction
Observational evidence of dense gas tracers has suggested that star formation is closely related to the dense cores of molecular clouds, in the Milky Way and in the extragalactic domain (Kennicutt & Evans, 2012; Lada et al., 2012). The star formation law, the relation between star formation rate (SFR) and gas mass, is a fundamental tool to study star formation processes and to understand galaxy formation and evolution. The Kennicutt-Schmidt (K-S) law (Kennicutt, 1998) formulate the global surface densities of SFR traced by Hα is closely tied up with the total gas surface densities, traced by CO and HI 21 cm line, with an index of N = 1.40.15.
CO and (hereafter 1-0 and 2-1) can trace the bulk of molecular gas content of low to medium density, while transitions from high dipole-moment molecules only trace dense molecular gas. A tight linear relation has been found between the infrared luminosity () which traces the SFR, and HCN luminosity () which traces mass of dense molecular gas, in galaxies by (Gao & Solomon, 2004a). This relation was extended to the Milky Way dense cores (Wu et al., 2005; Shimajiri et al., 2017) and high- galaxies (Gao et al., 2007).
However, the linear correlation of - was still debated. The theoretical studies of the star formation predict that decreasing slopes against increasing critical densities () (Krumholz & Thompson, 2007; Narayanan et al., 2008). Some observations of HCN 3-2 show that the slope of - is significantly below unity (Bussmann et al., 2008; Juneau et al., 2009), while a slightly super-linear IR-HCN 1-0 luminosity relation is found in Graciá-Carpio et al. (2008), García-Burillo et al. (2012) andSaito et al. (2018)toward the local luminous and ultra-luminous infrared galaxies (LIRGs and ULIRGs). Note that the infrared luminosity in Bussmann et al. (2008) is the total infrared luminosity of an entire galaxy, while HCN 3-2 emissions are only from central part of the nearby galaxies. On the other hand, the sample of Graciá-Carpio et al. (2008) and García-Burillo et al. (2012) are just for LIRGs, ULIRGs and high- galaxies, with very limited infrared luminosity range.
Dense gas tracers with higher critical densities: CS 5-4 in Wang et al. (2011); HCN 4-3, CS 7-6 in Zhang et al. (2014) and HCN 4-3 and HCO+ 4-3 in Tan et al. (2018), were all found to follow the linear slope. Liner slope was also found for = 6-5 transition of CO (Liu et al., 2015; Kamenetzky et al., 2016). Thus, re-checking the relation of and are necessary for understanding dense tracers and star formation in galaxies.
In this paper, we describe the observations and data reduction in Section 2, and the main results are presented in Section 3. In Section 4, we present the analysis and discussion. The final conclusions are summarized in Section 5.
2 Observations and data reduction
A sample of 37 local galaxies from the far-IR survey of Infrared Astronomical Satellite (IRAS) (Sanders et al., 2003) are selected. We carry out the new observations for HCN 3-2. There are 33 sources, with 60 m flux densities greater than 20 Jy. And the other 4 sources with 60 m flux less than 20 Jy are selected from Gao & Solomon (2004b) with the strong HCN 1-0 emission.
2.1 HCN 3-2 observations with the SMT 10-m telescope
The observations of HCN 3-2 toward 37 local galaxies, were carried out with the 10 m SMT telescope on Mt. Graham, AZ, between December 2015 and February 2016. Then, six sources (M 82, NGC 3504, NGC 3079, NGC 4418, NGC 6240, and NGC 6946) with strong HCN 3-2 emission were selected to observe H13CN 3-2, which were shown in another paper (Li et al. 2020). The beam size of SMT is about 28′′ at 265.886 GHz for HCN 3-2. Lower sideband (LSB) of the 1.3 mm ALMA Band 6 receiver with dual-polarization sideband-separating mixers was used for this observation. The backends employed were Forbes Filter Bank system with a 1 MHz frequency spacing and 1024 channels for each polarization. The channel width corresponds to a velocity separation of 1.2 km s-1 at the observing frequencies. The beam-switching mode with a subreflecter throw of 2 was used for all observations. Telescope pointing and focus based on Jupiter and Mars were checked every two hours. Typical system temperatures were less than 240 K for all observations. The antenna temperature was converted to main beam temperature using =/, where is the corrected beam efficiency. The integration time of HCN 3-2 was about 30 minutes for each source.
2.2 Data reduction
The basic parameters of the samples are listed in Table 1. The CLASS package, which is a part of the GILDAS111http://www.iram.fr/IRAMFR/GILDAS software, was used for data reduction. Firstly, we checked each spectrum and qualified spectra by their baseline flatness, standing wave, system temperature, etc. Then, we averaged all reliable spectra into one spectrum for each source. First-order polynomial baseline was fitted and subtracted from the averaged spectrum for each source. The averaged spectra are smoothed to velocity resolutions of 20 - 40 km s-1. The velocity-integrated intensities of these line are derived from the Gaussian fit to the spectra, or integrated over a defined window if the line profiles significantly deviate from a Gaussian profile.
| Source | RA | DEC | F60μm | cz | Distance | Beam size | log LIR | IHCN | log LHCN | |
| (J2000) | (J2000) | (Jy) | (km s-1) | (Mpc) | (kpc) | (kpc) | (L) | (K km s-1) | (K km s-1) | |
| NGC2146a | 06:18:37.7 | 78:21:25 | 146.69 | 893 | 16.47 | 28.7 | 2.2 | 10.5 0.1 | 0.51 0.12 | 6.5 0.1 |
| NGC2798 | 09:17:22.8 | 41:59:59 | 20.60 | 1726 | 27.84 | 21.1 | 3.8 | 10.8 0.1 | 0.55 | 6.93 |
| NGC2903a | 09:32:10.5 | 21:30:05 | 60.54 | 566 | 8.26 | 30.3 | 1.1 | 9.2 0.2 | 0.66 0.10 | 6.0 0.1 |
| NGC3031 | 09:55:33.6 | 69:03:56 | 44.73 | -34 | 3.63 | 28.4 | 0.5 | 8.2 0.02 | 0.30 | 4.90 |
| NGC3034a | 09:55:53.1 | 69:40:41 | 1480.42 | 203 | 3.63 | 11.8 | 0.5 | 10.0 0.03 | 2.11 0.15 | 6.3 0.02 |
| NGC3079a | 10:01:57.9 | 55:40:51 | 50.67 | 1116 | 18.19 | 41.8 | 2.5 | 10.7 0.1 | 1.18 0.27 | 6.9 0.1 |
| NGC3310 | 10:38:46.2 | 53:30:08 | 34.56 | 1060 | 19.81 | 17.9 | 2.7 | 10.1 0.1 | 0.39 | 6.49 |
| NGC3351 | 10:43:58.1 | 11:42:10 | 19.66 | 778 | 9.99 | 8.9 | 1.4 | 9.8 0.1 | 0.97 0.21 | 6.3 0.1 |
| NGC3504 | 11:03:11.1 | 27:58:22 | 21.43 | 1525 | 27.07 | 21.3 | 3.7 | 10.5 0.1 | 0.94 0.16 | 7.2 0.1 |
| NGC3521 | 11:05:49.2 | -00:02:15 | 49.19 | 801 | 6.84 | 21.9 | 0.9 | 9.1 0.1 | 0.53 0.15 | 5.7 0.1 |
| NGC3627 | 11:20:14.9 | 12:59:30 | 66.31 | 727 | 10.04 | 26.6 | 1.4 | 9.8 0.1 | 0.70 0.20 | 6.2 0.1 |
| NGC3628a | 11:20:17.0 | 13:35:23 | 54.8 | 843 | 10.04 | 43.2 | 1.4 | 10.2 0.1 | 0.32 0.06 | 5.8 0.1 |
| NGC4088 | 12:05:35.1 | 50:32:24 | 26.77 | 757 | 13.37 | 22.6 | 1.8 | 9.0 0.4 | 0.32 0.10 | 6.1 0.1 |
| NGC4102 | 12:06:23.6 | 52:42:36 | 46.85 | 846 | 16.89 | 13.3 | 2.3 | 10.3 0.1 | 0.78 0.22 | 6.3 0.1 |
| NGC4194 | 12:14:08.7 | 54:31:40 | 23.20 | 2051 | 40.33 | 21.1 | 5.5 | 11.1 0.1 | 0.68 | 7.35 |
| NGC4254 | 12:18:51.0 | 14:24:50 | 7.46 | 2407 | 15.29 | 24.0 | 2.1 | 9.8 0.1 | 0.74 0.18 | 6.5 0.1 |
| NGC4303 | 12:21:55.4 | 04:28:24 | 37.27 | 1566 | 15.29 | 28.9 | 2.1 | 9.6 0.03 | 0.29 | 6.15 |
| NGC4321 | 12:22:53.9 | 15:49:22 | 26.00 | 1571 | 15.20 | 32.7 | 2.1 | 10.1 0.1 | 0.46 | 6.34 |
| NGC4414a | 12:26:26.9 | 31:13:24 | 29.55 | 716 | 17.68 | 18.5 | 2.4 | 9.3 0.1 | 0.65 | 6.62 |
| NGC4418 | 12:26:54.7 | -00:52:42 | 43.89 | 2179 | 31.90 | 14.8 | 4.3 | 11.0 0.1 | 0.86 0.21 | 7.3 0.1 |
| NGC4490 | 12:30:34.9 | 41:38:47 | 46.92 | 565 | 10.48 | 19.2 | 1.4 | 8.7 0.5 | 0.30 0.06 | 5.8 0.1 |
| NGC4501 | 12:31:57.6 | 14:25:20 | 19.68 | 2281 | 15.29 | 30.7 | 2.1 | 9.6 0.1 | 1.5 | 6.85 |
| NGC4527 | 12:34:09.9 | 02:39:04 | 31.40 | 1736 | 15.29 | 27.6 | 2.1 | 10.1 0.11 | 0.44 | 6.32 |
| NGC4536 | 12:34:28.5 | 02:11:08 | 30.26 | 1808 | 14.92 | 33.0 | 2.0 | 10.3 0.1 | 0.92 0.13 | 6.6 0.1 |
| NGC4568/7 | 12:36:33.7 | 11:14:32 | 20.81 | 2255 | 15.3 | 18.9 | 2.1 | 10.16 0.1 | 0.52 | 6.40 |
| NGC4631 | 12:42:07.1 | 32:32:33 | 85.40 | 606 | 7.73 | 34.9 | 1.0 | 9.7 0.6 | 0.37 | 5.70 |
| NGC4736 | 12:50:52.9 | 41:07:15 | 71.54 | 308 | 4.83 | 15.7 | 0.7 | 9.3 0.1 | 0.78 0.22 | 5.6 0.1 |
| NGC4826 | 12:56:42.6 | 21:41:05 | 36.70 | 408 | 3.09 | 9.0 | 0.4 | 9.1 0.1 | 0.50 | 5.00 |
| NGC5055 | 13:15:49.5 | 42:01:39 | 40 | 484 | 7.96 | 29.2 | 1.1 | 9.6 0.1 | 0.58 | 5.90 |
| NGC5194 | 13:29:53.5 | 47:11:42 | 97.42 | 463 | 8.63 | 28.1 | 1.2 | 9.5 0.1 | 0.7 0.23 | 6.0 0.1 |
| NGC5253 | 13:39:55.2 | -31:38:21 | 29.84 | 407 | 3.15 | 4.6 | 0.4 | 8.8 0.1 | 0.41 | 4.90 |
| NGC5457 | 14:03:09.0 | 54:21:24 | 88.04 | 241 | 6.70 | 56.1 | 0.9 | 8.7 0.1 | 0.45 0.18 | 5.6 0.2 |
| NGC5713 | 14:40:10.9 | -00:17:22 | 22.10 | 1899 | 26.74 | 21.8 | 3.6 | 10.6 0.1 | 0.75 0.24 | 7.0 0.1 |
| NGC5775 | 14:53:58.0 | 03:32:32 | 23.59 | 1681 | 26.34 | 32.2 | 2.6 | 9.6 0.5 | 0.33 0.09 | 6.7 0.1 |
| CGCG049-057 | 15:13:12.7 | 07:13:30 | 21.89 | 3897 | 59.06 | 6.9 | 8.0 | 11.5 0.1 | 0.96 0.21 | 7.8 0.1 |
| NGC6240a | 16:52:58.9 | 02:24:03 | 22.94 | 7200 | 103.86 | 63.4 | 14.1 | 11.8 0.1 | 1.7 0.29 | 8.6 0.1 |
| NGC6946 | 20:34:52.6 | 60:09:12 | 129.78 | 40 | 5.32 | 17.8 | 0.7 | 9.3 0.02 | 1.35 0.31 | 5.9 0.1 |
| Mrk231b | 12:56:14.2 | 56:52:25 | 30.8 | 12139 | 171.84 | - | - | 12.4 0.1 | 38.2 0.4e | 8.6 0.01 |
| Mrk273c | 13:44:42.1 | 55:53:13 | 22.51 | 11326 | 154.71 | - | - | 12.1 0.1 | 29.7 0.6e | 8.6 0.01 |
| SDP.9d | 09:07:40.0 | -00:41:59.8 | 6654.93 | - | - | 13.8 0.01 | 0.66 0.11e | 9.7 0.1 | ||
| SDP.11d | 09:10:43.1 | -00:03:22.8 | 7546.48 | - | - | 13.8 0.01 | 0.54 0.08e | 9.7 0.1 |
Notes. The fluxes are from the Gaussian fitting. a these seven sources overlap with the sample in Bussmann et al. (2008). Mrk 231, Mrk 273, SDP.9 and SDP.11 are from the literatures: b(Aalto et al., 2015), c(Aladro et al., 2018), d(Oteo et al., 2017). e the flux of HCN is presented with unit of Jy km s-1. The 60 m flux densities and distance of these galaxies are from Sanders et al. (2003). Optical diameter (D25) is from NED 222The NASA/IPAC Extragalactic Database (NED).
![[Uncaptioned image]](/html/2003.13009/assets/x1.png)
![[Uncaptioned image]](/html/2003.13009/assets/x2.png)
![[Uncaptioned image]](/html/2003.13009/assets/x3.png)
![[Uncaptioned image]](/html/2003.13009/assets/x4.png)
![[Uncaptioned image]](/html/2003.13009/assets/x5.png)
![[Uncaptioned image]](/html/2003.13009/assets/x6.png)
![[Uncaptioned image]](/html/2003.13009/assets/x7.png)
![[Uncaptioned image]](/html/2003.13009/assets/x8.png)
![[Uncaptioned image]](/html/2003.13009/assets/x9.png)
![[Uncaptioned image]](/html/2003.13009/assets/x10.png)
![[Uncaptioned image]](/html/2003.13009/assets/x11.png)
![[Uncaptioned image]](/html/2003.13009/assets/x12.png)
![[Uncaptioned image]](/html/2003.13009/assets/x13.png)
![[Uncaptioned image]](/html/2003.13009/assets/x14.png)
![[Uncaptioned image]](/html/2003.13009/assets/x15.png)
![[Uncaptioned image]](/html/2003.13009/assets/x16.png)
![[Uncaptioned image]](/html/2003.13009/assets/x17.png)
![[Uncaptioned image]](/html/2003.13009/assets/x18.png)
![[Uncaptioned image]](/html/2003.13009/assets/x19.png)
![[Uncaptioned image]](/html/2003.13009/assets/x20.png)
![[Uncaptioned image]](/html/2003.13009/assets/x21.png)
2.3 Infrared Data
To match the molecular emission, we measure the IR luminosity within the observing region of HCN 3-2, corresponding to the beam-size of 28′′. We download the calibrated IR image data obtained using the Spitzer MIPS and Herschel PACS instruments from the NASA/IPAC Infrared Science Archive (IRSA). The data have been processed to level 2 for MIPS 24 m and level 2.5 or 3 for PACS 70 m, 100 m, and 160 m bands. For NGC 2903, NGC 4088, NGC 4490 and NGC 4414, we only adopt Spitzer MIPS 24 m image, because no Herschel data can be found. While the IR image data of all other sources are from Herschel PACS image. According to the method in Tan et al. (2018), we calculate the infrared flux densities from 24 m to 160 m.
2.4 Infrared Luminosities and HCN 3-2 line Luminosity
Using these IR data, we calculate the infrared luminosity of the region within the SMT beam size in each galaxy. Based on the method in Galametz et al. (2013), we estimate the total infrared luminosities using Spitzer MIPS and Herschel PACS luminosities. The total IR luminosity within the beam-size is:
| (1) |
where is the calibration coefficients for various combinations of Spitzer and Herschel bands, is the resolved luminosity in a given band i in units of . The errors include errors of photometry ( 5%), the flux calibration error ( 5%) and the error of tracing TIR with a combined IR band ( 25%) (Galametz et al., 2013). We computed the HCN line luminosity using equation (2) in Gao & Solomon (2004a) for all galaxies.
| (2) |
3 Results
3.1 The detection of HCN 3-2
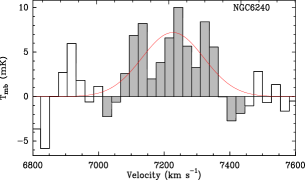
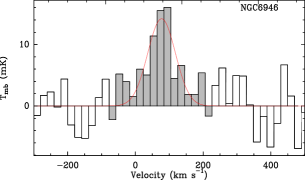
HCN 3-2 emission was detected in 23 galaxies from our sample of 37 local galaxies. Most of sources were detected at 5 level, except for NGC 5194, NGC 5457, NGC 3521, NGC 4088, NGC 5713, NGC 5775, and NGC 2146, which are at about 34 level. The distance, infrared luminosities of the objects and velocity integrate intensities of HCN 3-2 are presented in Table 1. The velocity integrated intensities are consistent with the results of Bussmann et al. (2008) for seven sources overlapped with their sample, including NGC 2146, NGC 2903, NGC 3034, NGC 3079, NGC 3628, NGC 4414, and NGC 6240. The HCN 3-2 spectrum of detected galaxies are presented in Figure 1. The central velocity of HCN 3-2 is in agreement with that of the CO line in those detected galaxies (Radford et al., 1991; Mauersberger et al., 1999; Meier et al., 2001; Israel, 2009; Mao et al., 2010; Costagliola et al., 2011; Usero et al., 2015). Therefore, we use the CO line width to estimate the upper limits of velocity-integrated flux for the sources of non-detection in the HCN 3-2.
For both Mrk 231 and Mrk 273, HCN 3-2 is not detected, while the 3 upper limits are similar to the detection reported by Aalto et al. (2015) toward Mrk 231 and Aladro et al. (2018) toward Mrk 273. Therefore, the fluxes of HCN 3-2 in Mrk 231 Aalto et al. (2015) and Mrk 273 Aladro et al. (2018) are also used for the correlation of and . In addition, two high- starbursts galaxies from Oteo et al. (2017) are also included, which makes the sample with HCN 3-2 detection to be 41 galaxies.
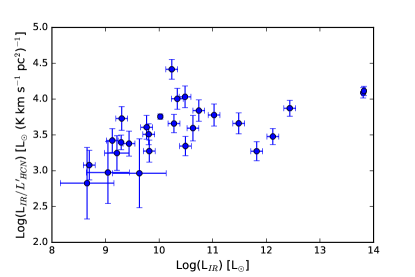
3.2 The correlation of LIR and L
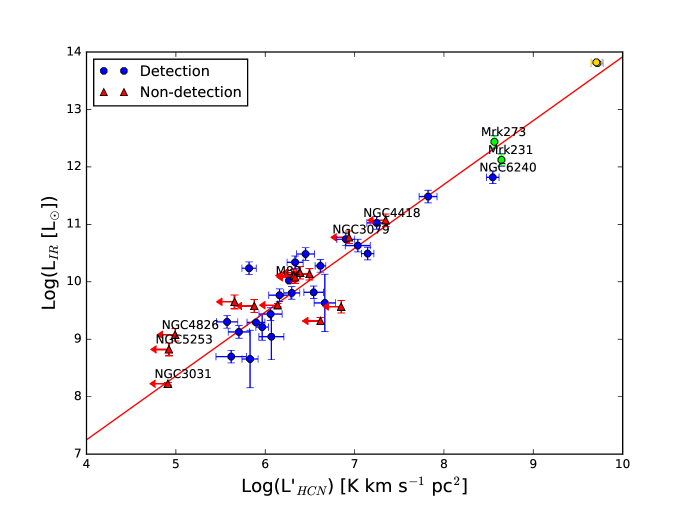
Figure 2 shows the relationship between the total infrared luminosity and HCN 3-2 luminosity using our new data and the data from the literatures. The infrared luminosity of the total galaxy has been corrected to the region within the SMT beam, as a proxy of SFR. In contrast with the result of a slope of 0.74 reported by Bussmann et al. (2008), our results show that the LIR and L relation still follow the linear correlation. The sub-linear correlation between HCN 3-2 and IR in Bussmann et al. (2008) should be caused by that the infrared luminosities for nearby galaxies are not corrected to match the beam size of HCN 3-2 observation. The best-fit of result is: Log(LIR)=1.11(0.06)Log(LHCN)+2.80(0.42) and with a correlation coefficient of 0.91. The upper limits of HCN 3-2 for the non-detected galaxies are not adopted in the fitting. The of sample galaxies span 5 orders of magnitude from about 10 to 10, including various types of galaxies.
3.3 The line ratios versus LIR
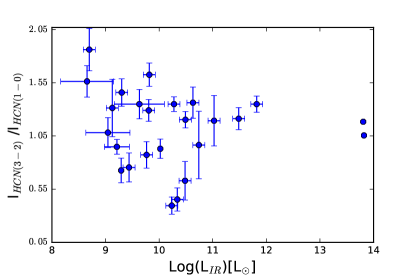
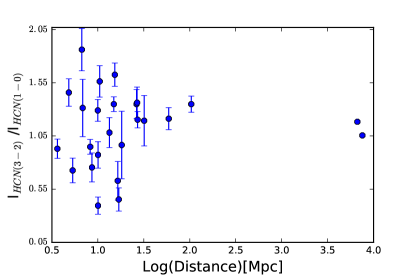
The diagram of HCN 3-2/1-0 line ratio versus LIR is presented in Figure 3, which showed large scatter in different galaxies. Such scatter indicates that excitation conditions of dense molecular gas vary in different galaxies. There is no correlation between HCN 3-2/1-0 ratio and luminosity distance. This suggests that excitation conditions of dense molecular gas is independent of galaxy luminosity distance. Although both - and - show linear relation, different excitation conditions of dense gas would cause large uncertainty in estimating dense gas mass for individual galaxy if only a single transition line of dense gas tracers is used.
4 Discussion
4.1 The relation between luminosity of dense gas tracers and infrared luminosity
The correlation of the dense gas content and the SFR in the local Universe was studied started from Solomon et al. (1992) and Gao & Solomon (2004a), which find HCN emission and IR luminosity is closely related. Although some observations of HCN 1-0&3-2, CS 3-2 (Baan et al., 2008; Bussmann et al., 2008; Graciá-Carpio et al., 2008) have shown a sub-linear relation in the local luminous and ultraluminous infrared galaxies (LIRGs and ULIRGs), which is consistent with the theoretical models (Krumholz & Thompson, 2007; Narayanan et al., 2008). However these work did not properly account for the different sizes between the submilimeter dish aperture and the IR emission. Once the size is properly corrected, the linear correlation between luminosities of dense gas tracers and is confirmed (Wang et al., 2011; Zhang et al., 2014; Greve et al., 2014; Liu et al., 2015; Kamenetzky et al., 2016; Shimajiri et al., 2017; Yang et al., 2017; Tan et al., 2018). Even the high- galaxies also follow such linear slope (Oteo et al., 2017).
The best fit of our data is a slope of 1.11 with a correlation coefficient of 0.91. Note that, the infrared luminosities of entire galaxies have been corrected to the central 28′′ regions in these galaxies, taking into account dense gas line fluxes are detected from the region of the beam size of the SMT 10-m telescope, according to the method using by Tan et al. (2018), which adopts the prescription of Galametz et al. (2013). Thus, there is no real exception of liner relation between luminosity of dense gas tracers and infrared luminosity in galaxies.
The upper limits of HCN 3-2 for the non-detected galaxies are not adopted in the fitting. Note that, NGC 5253 and NGC 4826 lie above the relation of and . For dwarf starburst galaxy NGC 5253, with an extreme youth of starburst (van den Bergh, 1980; Beck et al., 1996; Calzetti et al., 1997; Pellerin & Robert, 2007), a high specific star formation rate (Calzetti et al., 2015) and a high star formation efficiencies were found in the central starburst of NGC 5253 (Miura et al., 2018). The extreme environments and some mechanism, like mechanical heating, non-star-forming ISM component might result in NGC 5253 to deviate from the relation.
As we know, star formation in galaxies predominantly takes place in dense regions. Lines of high dipole moment molecules, such as HCN, HCO+, HNC and CS, can be good tracers for such dense molecular gas. However, it can be affected by various physical process. Such as, the abundance of HCN can be enhanced in XDR surrounding an AGN (Costagliola et al., 2011; Privon et al., 2017), while Izumi et al. (2016) reported that the mechanical heating from a jet and shock could drive HCN enhancement around the vicinity of AGNs. The uncertainties in the relation of LIR and L mainly result from the conversion from dense molecular gas luminosity to the dense gas mass and from the infrared luminosity to the SFR (Shimajiri et al., 2017). Due to the dense gas tracers are normally optically thick, there is a large uncertainty in estimating the dense gas mass from a single transition line of a high dipole moment molecule, which is similar to the issue of the CO-to-H2 conversion factors (Narayanan et al., 2012; Papadopoulos, 2007).
4.2 Excitation of HCN molecules
With the new HCN 1-0 data towards a sample of 41 nearby galaxies using the IRAM-30-m telescope (Wang et al. in preparation), we compare the ratio of HCN (3-2) and HCN (1-0) in different populating galaxies in the left panel of Figure 3, since these were designed in this way using different telescopes yet having similar telescope beam sizes of these two observations. No systematic trend is found between HCN 3-2/HCN 1-0 and LIR. In terms of excitation properties of dense gas, the low ratios of HCN 3-2 /HCN 1-0 imply that the HCN J=3-2 transition might be subthermal for M 82, NGC 3628 and NGC 4254. In addition, HCN 3-2/HCN 1-0 versus luminosity distance also show a large scatter (see Figure 3), which suggests that the excitation conditions of dense molecular gas is independent of luminosity distance.
Although most of observations have evidenced that both HCN 3-2 and 1-0 (n(H2)104 cm-3) are linear related to the star formation of galaxies, the different excitation condition in different transitions could impact the estimation of dense gas mass for the individual galaxies. In the conversion from to the dense gas mass, we have better consider all transitions of HCN emission to reduce the uncertainties.
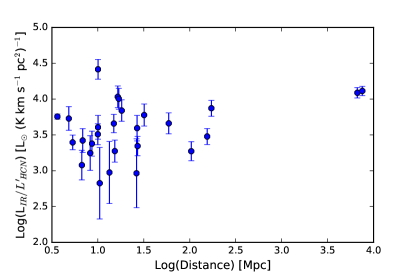
4.3 Star formation efficiency of dense molecular gas
The relation between / and can be interpreted as relation between the efficiency of star formation in the dense molecular gas (SFE) and SFR. We preform this relation toward the detected galaxies and two high- galaxies in the left panel of Figure 4. The ratio measured in different population of galaxies show little variations, which is consistent with the measure of the SFE of the dense gas traced by the HCN (1-0) in galaxies (Gao & Solomon, 2004b) and giant molecular clouds (GMCs) (Wu et al., 2005; Chen et al., 2017) and HCN (4-3) in galaxies (Tan et al., 2018). The comparison of / with luminosity distance reveals that SFE vary little (see the right panel of Figure 4 ), which implies that SFE do not correlate with luminosity distance. The physical conditions of molecular gas in dense phase in a wide range of different galaxies might lead to the scatter in Figure 4 (Jackson et al., 1995). With the results from the literatures, various different transitions of HCN all indicate that SFE is almost constant independently of .
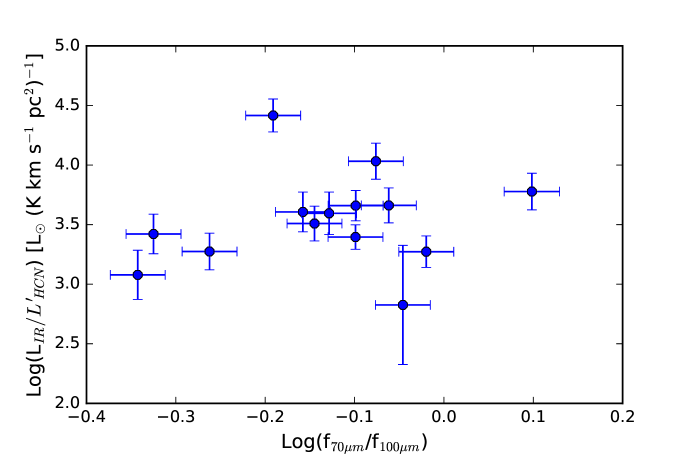
The warm-dust temperature can be traced by the . Therefore, we compare the ratio of / with for those galaxies with both PACS 70 m and 100 m data in Figure 5 instead of . No significant correlation between the LIR/LHCN and the warm-dust temperature as traced by is found in our sample, although Tan et al. (2018) reported that there is a statistically significant correlation in the nearby star forming galaxies, and LIR/LHCN is only weakly related with for the whole galaxies reported by (Gao & Solomon, 2004b).
5 Summary
The observations of HCN 3-2 towards the nearby infrared galaxies with SMT 10-m telescope are presented. Combined our data and the literature data of two high-z galaxies, we investigate the relation of the infrared luminosity () and the HCN luminosity () in different population galaxies. We obtained the following results:
1. HCN 3-2 emission was detected in 23 out of 37 infrared bright galaxies. Most of sources were detected at 5 level, except for NGC 5194, NGC5457, NGC3521, NGC 4088, NGC 5713, NGC 5775, and NGC 2146, which is at about 34 level. The central velocity is consistent with the results of CO in those detected galaxies.
2.In contrast with the result of a slope of 0.74 reported by Bussmann et al. (2008), the correlation of infrared emission (LIR) and the luminosity of HCN (3-2) (L) line emission measured in our sample is fitted with a slope of 1.11 and correlation coefficient of 0.91 after considering careful aperture corrections, which follows the linear correlation for other dense gas tracers in literature established for galaxies within the scatter.
3. It is apparent that no systematic trend is found between the ratio of HCN(3-2)/HCN(1-0) and . The the large scatter in the relation between the ratio of HCN(3-2)/HCN(1-0) versus indicates that dense gas masses estimated from the line luminosities of HCN = 1-0 and = 3-2 should be treated with caution for individual galaxies. In the conversion from L to the dense gas mass, we have better consider all transitions of HCN emission to reduce the uncertainties.
6 Acknowledgements
We are grateful to the staff of the SMT-10 m telescope and IRAM-30 m telescope for their kind help and support during out observation. This work is supported by the National Key RD Program of China (No. 2017YFA0402704), the Natural Science Foundation of China under grants of 11590783. This research has made use of the NASA/IPAC Extragalactic Database (NED), which is operated by the Jet Propulsion Laboratory, California Institute of Technology, under contract with the National Aeronautics and Space Administration. This work also benefited from the International Space Science Institute (ISSI/ISSI-BJ) in Bern and Beijing, thanks to the funding of the team “Chemical abundances in the ISM: the litmus test of stellar IMF variations in galaxies across cosmic time” (Principal Investigator D.R. and Z-Y.Z.). YG’s research is supported by National Key Research and Development Program of China (grant No. 2017YFA0402704), National Natural Science Foundation of China (grant Nos. 11861131007, 11420101002), Chinese Academy of Sciences Key Research Program of Frontier Sciences (grant No. QYZDJ-SSW-SLH008) and NSFC (grant No. U1731237).
References
- Aalto et al. (2015) Aalto, S., Garcia-Burillo, S., Muller, S., et al. 2015, A&A, 574, A85
- Aladro et al. (2018) Aladro, R., König, S., Aalto, S., et al. 2018, A&A, 617, A20
- Baan et al. (2008) Baan, W. A., Henkel, C., Loenen, A. F., Baudry, A., & Wiklind, T. 2008, A&A, 477, 747
- Beck et al. (1996) Beck, S. C., Turner, J. L., Ho, P. T. P., Lacy, J. H., & Kelly, D. M. 1996, ApJ, 457, 610
- Bussmann et al. (2008) Bussmann, R. S., Narayanan, D., Shirley, Y. L., et al. 2008, ApJ, 681, L73
- Calzetti et al. (2015) Calzetti, D., Lee, J. C., Sabbi, E., et al. 2015, AJ, 149, 51
- Calzetti et al. (1997) Calzetti, D., Meurer, G. R., Bohlin, R. C., et al. 1997, AJ, 114, 1834
- Chen et al. (2017) Chen, H., Braine, J., Gao, Y., Koda, J., & Gu, Q. 2017, ApJ, 836, 101
- Costagliola et al. (2011) Costagliola, F., Aalto, S., Rodriguez, M. I., et al. 2011, A&A, 528, A30
- Galametz et al. (2013) Galametz, M., Kennicutt, R. C., Calzetti, D., et al. 2013, MNRAS, 431, 1956
- Gao et al. (2007) Gao, Y., Carilli, C. L., Solomon, P. M., & Vand en Bout, P. A. 2007, ApJ, 660, L93
- Gao & Solomon (2004a) Gao, Y. & Solomon, P. M. 2004a, ApJS, 152, 63
- Gao & Solomon (2004b) Gao, Y. & Solomon, P. M. 2004b, ApJ, 606, 271
- García-Burillo et al. (2012) García-Burillo, S., Usero, A., Alonso-Herrero, A., et al. 2012, A&A, 539, A8
- Graciá-Carpio et al. (2008) Graciá-Carpio, J., García-Burillo, S., Planesas, P., Fuente, A., & Usero, A. 2008, A&A, 479, 703
- Greve et al. (2014) Greve, T. R., Leonidaki, I., Xilouris, E. M., et al. 2014, ApJ, 794, 142
- Israel (2009) Israel, F. P. 2009, A&A, 493, 525
- Izumi et al. (2016) Izumi, T., Kohno, K., Aalto, S., et al. 2016, ApJ, 818, 42
- Jackson et al. (1995) Jackson, J. M., Paglione, T. A. D., Carlstrom, J. E., & Rieu, N.-Q. 1995, ApJ, 438, 695
- Juneau et al. (2009) Juneau, S., Narayanan, D. T., Moustakas, J., et al. 2009, ApJ, 707, 1217
- Kamenetzky et al. (2016) Kamenetzky, J., Rangwala, N., Glenn, J., Maloney, P. R., & Conley, A. 2016, ApJ, 829, 93
- Kennicutt (1998) Kennicutt, Robert C., J. 1998, ApJ, 498, 541
- Kennicutt & Evans (2012) Kennicutt, R. C. & Evans, N. J. 2012, ARA&A, 50, 531
- Krumholz & Thompson (2007) Krumholz, M. R. & Thompson, T. A. 2007, ApJ, 669, 289
- Lada et al. (2012) Lada, C. J., Forbrich, J., Lombardi, M., & Alves, J. F. 2012, ApJ, 745, 190
- Liu et al. (2015) Liu, D., Gao, Y., Isaak, K., et al. 2015, ApJ, 810, L14
- Mao et al. (2010) Mao, R.-Q., Schulz, A., Henkel, C., et al. 2010, ApJ, 724, 1336
- Mauersberger et al. (1999) Mauersberger, R., Henkel, C., Walsh, W., & Schulz, A. 1999, A&A, 341, 256
- Meier et al. (2001) Meier, D. S., Turner, J. L., Crosthwaite, L. P., & Beck, S. C. 2001, AJ, 121, 740
- Miura et al. (2018) Miura, R. E., Espada, D., Hirota, A., et al. 2018, ApJ, 864, 120
- Narayanan et al. (2008) Narayanan, D., Cox, T. J., Shirley, Y., et al. 2008, ApJ, 684, 996
- Narayanan et al. (2012) Narayanan, D., Krumholz, M. R., Ostriker, E. C., & Hernquist, L. 2012, MNRAS, 421, 3127
- Oteo et al. (2017) Oteo, I., Zhang, Z. Y., Yang, C., et al. 2017, ApJ, 850, 170
- Papadopoulos (2007) Papadopoulos, P. P. 2007, ApJ, 656, 792
- Pellerin & Robert (2007) Pellerin, A. & Robert, C. 2007, MNRAS, 381, 228
- Privon et al. (2017) Privon, G. C., Aalto, S., Falstad, N., et al. 2017, ApJ, 835, 213
- Radford et al. (1991) Radford, S. J. E., Solomon, P. M., & Downes, D. 1991, ApJ, 368, L15
- Saito et al. (2018) Saito, T., Iono, D., Espada, D., et al. 2018, ApJ, 863, 129
- Sanders et al. (2003) Sanders, D. B., Mazzarella, J. M., Kim, D.-C., Surace, J. A., & Soifer, B. T. 2003, AJ, 126, 1607
- Shimajiri et al. (2017) Shimajiri, Y., André, P., Braine, J., et al. 2017, A&A, 604, A74
- Solomon et al. (1992) Solomon, P. M., Downes, D., & Radford, S. J. E. 1992, ApJ, 387, L55
- Tan et al. (2018) Tan, Q.-H., Gao, Y., Zhang, Z.-Y., et al. 2018, ApJ, 860, 165
- Usero et al. (2015) Usero, A., Leroy, A. K., Walter, F., et al. 2015, AJ, 150, 115
- van den Bergh (1980) van den Bergh, S. 1980, PASP, 92, 122
- Wang et al. (2011) Wang, J., Zhang, Z., & Shi, Y. 2011, MNRAS, 416, L21
- Wu et al. (2005) Wu, J., Evans, Neal J., I., Gao, Y., et al. 2005, ApJ, 635, L173
- Yang et al. (2017) Yang, C., Omont, A., Beelen, A., et al. 2017, A&A, 608, A144
- Zhang et al. (2014) Zhang, Z.-Y., Gao, Y., Henkel, C., et al. 2014, ApJ, 784, L31