The lowest frequency Fast Radio Bursts: Sardinia Radio Telescope detection of the periodic FRB 180916 at 328 MHz111Released on March, 27th, 2020
Abstract
We report on the lowest-frequency detection to date of three bursts from FRB 180916.J0158+65, observed at 328 MHz with the Sardinia Radio Telescope (SRT). The SRT observed the periodic repeater FRB 180916.J0158+65 for five days from Feb. 20, 2020 to Feb. 24, 2020 during a time interval of active radio bursting, and detected the three bursts during the first hour of observations; no more bursts were detected during the remaining hours. Simultaneous SRT observations at 1548 MHz did not detect any bursts. Burst fluences are in the range 13 to 37 Jy ms. No relevant scattering is observed for these bursts.
We also present the results of the multi-wavelength campaign we performed on FRB 180916.J0158+65, during the days of the active window. Simultaneously with the SRT observations, observations with different time spans were performed with the Northern Cross at 408 MHz, with XMM-Newton, NICER, INTEGRAL, AGILE and with the TNG and two optical telescopes in Asiago, which are equipped with fast photometers. XMM-Newton obtained data simultaneously with the three bursts detected by the SRT, and determined a luminosity upper limit in the 0.3–10 keV energy range of erg s-1 for the burst emission. AGILE obtained data simultaneously with the first burst and determined a fluence upper limit in the MeV range for millisecond timescales of .
Our results show that absorption from the circum-burst medium does not significantly affect the emission from FRB 180916.J0158+65, thus limiting the possible presence of a superluminous supernova around the source, and indicate that a cutoff for the bursting mechanism, if present, must be at lower frequencies. Our multi-wavelength campaign sensibly constrains the broad-band emission from FRB 180916.J0158+65, and provides the best limits so far for the electromagnetic response to the radio bursting of this remarkable source of fast radio bursts.
1 Introduction
Fast Radio Bursts (FRBs) are fast, millisecond-duration, extremely bright (Jy) bursts that have so far only been observed at radio wavelengths. Their extragalactic nature has been confirmed by the first Repeating Fast Radio Burst (RFRB), FRB 121102, located at a redshift of (Spitler et al., 2014, 2016; Tendulkar et al., 2017; Chatterjee et al., 2017; Marcote et al., 2017). However, in the last year, observations performed in the frequency band between 400 and 800 MHz by the Canadian Hydrogen Intensity Mapping Experiment (CHIME, CHIME/FRB Collaboration et al. 2018), led to a significant growth in the known population of “Repeaters” (alternate name for RFRBs) (CHIME/FRB Collaboration et al., 2019a, b; Fonseca et al., 2020).
Among the 20 repeating FRB sources published until now, FRB 180916.J0158+65 (hereafter FRB 180916) (CHIME/FRB Collaboration et al., 2019b) was discovered by CHIME through the detection of 10 bursts, with a flux density ranging from to Jy. A subsequent targeted VLBI campaign, favored by the active nature of the source and its low extra-galactic dispersion measure of pc cm-3, led to the identification of the host galaxy at a redshift (Marcote et al., 2020). The localization of FRB 180916, the second ever for a RFRB, immediately showed a dichotomy with the case of FRB 121102: indeed, FRB 180916 was found in a star-forming region within a nearby massive spiral galaxy, at odds with FRB 121102, which is hosted in a dwarf galaxy (Chatterjee et al., 2017; Marcote et al., 2017). The subsequent continuous monitoring of FRB 180916 by CHIME led to the first identification of a periodicity in the active phases of a RFRB (CHIME/FRB Collaboration et al. 2020, hereafter CF20) (now possibly also followed by the detection of a periodicity from the original repeater, Rajwade et al. 2020b). In particular, FRB 180916 displays a periodicity of days in its phases of activity, with an active window phase concentrated within days around the midpoint of the window. Although it is still rather uncertain, the radio burst rate during the active window in the CHIME frequency band is per hour. The reported periodicity seems far too long to be ascribed to a neutron star’s rotational frequency, unless FRB progenitors are older, ultra-long period magnetars (Beniamini et al., 2020). This triggered a wealth of alternative hypotheses, such as orbital effects (Lyutikov et al., 2020; Ioka & Zhang, 2020) or various kinds of precessional effects (Yang & Zou, 2020; Levin et al., 2020; Zanazzi & Lai, 2020; Gu et al., 2020), including the precession of a jet produced by intermediate black hole accretion (Katz, 2020), or other secular semi-periodic cyclic phenomena, e.g. the source traveling across an asteroid belt (Dai & Zhong, 2020). Most of these models revisited concepts developed for the modeling of the original RFRB (for a review see Platts et al. 2019), tuned to a days periodicity.
From an observational point of view, the availability of predictable “windows for radio observations”, in combination with the rare proximity of the source, makes FRB 180916 the best target for additional studies in the radio band, as well as for multi-wavelength follow-ups. We have exploited one of these windows (the one centered on 21 February 2020) in order to search, with the Sardinia Radio Telescope (SRT; Bolli et al. 2015; Prandoni et al. 2017), for the signature of bursts at frequencies below 400 MHz, where no FRB nor RFRB have so far been detected (Rajwade et al. 2020a; Houben et al. 2019). In parallel, we set up observations at higher radio frequencies, as well as in the optical, X-ray and -ray bands.
In §2 we describe the multi-wavelength campaign while in §3 we present the results, focused on the detection of three bursts at 328 MHz with the SRT, and on the upper limits (ULs) from the simultaneous observations at other wavelengths; in §4 we discuss the properties of the bursts and some implications resulting from this initial campaign.
2 Observations
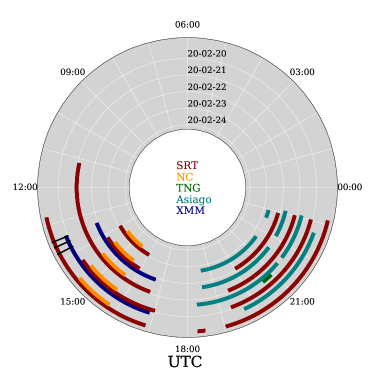
We carried out a multi-wavelength campaign to look at FRB 180916 during its active cycle starting on 2020-02-19, centered on 2020-02-21 at 16:12 UT, and ending on 2020-02-24. The campaign was set up in order to maximize the overlap of the simultaneous observations between the radio observatories and the multi-wavelength instruments. Details of the observational campaign can be found in Fig. 1.
2.1 Radio observations
2.1.1 The Sardinia Radio Telescope
The 64-m SRT observed FRB 180916 for a total of 30 h over a time span of five days. Observations were performed using the L/P dual-band coaxial receiver (Valente et al., 2010), with the two observing bands centered at 1548 MHz (L-band) and 328 MHz (P-band), respectively. Observations at L-band were performed with the ATNF Digital Filterbank Mark III backend (DFB222www.jb.man.ac.uk/pulsar/observing/DFB.pdf), with a bandwidth of 500 MHz, 1-MHz-wide channels and a sampling time s. Observations in the P band were performed in baseband mode using the ROACH1 backend (Bassa et al., 2016), which acquired data over a 64-MHz bandwidth.
The modified radiometer formula for pulsars (Lorimer & Kramer, 2004) applied to the SRT observations at L and P bands results into a minimum detectable flux density of 600 mJy and 2.2 Jy for a 1 ms burst, in the two bands, respectively. For P band we consider a limit. Given the presence of radio frequency interference (RFI) in the L band, the actual useful bandwidth was reduced to 350 MHz. Wide-band RFI, which in some cases saturated the backend, was also present; to take its effects into account, we set a threshold limit of for L-band searches. The telescope gain in the two bands is, K Jy-1 and K Jy-1, respectively. The system temperatures, accounting for the antenna temperature and the sky temperature, as extrapolated from 408 MHz all-sky map (Reich & Reich, 1988), are 30 K and 60 K, respectively.
2.1.2 The Northern Cross radio telescope
Observations with the Northern Cross (NC) radio telescope were carried out for seven days starting on 2020-02-19 and ending on 2020-02-25, for a total observing time of about 7.5 h (1.1 h per day). The system used to observe FRBs with the NC is described in Locatelli et al. (2020) and will be briefly summarized here. Six cylinders of the North-South arm were used for our observations. Each cylinder is composed of four receivers. Signals from the 24 receivers were calibrated by observing Cas A in interferometric mode, and then combined together in a single digital beam that followed the source as it transited across the field of view (FoV). Beam-formed voltages were stored to disk with a 138.24 s time resolution over a 16 MHz bandwidth centered at 408 MHz, with a 12.2 kHz frequency resolution. The increased frequency resolution, compared to the 781 kHz used in Locatelli et al. (2020), was achieved by Fourier transforming each frequency channel in a time window of 64 points and led to negligible intrachannel smearing.
2.2 X-ray/Gamma-ray observations
2.2.1 XMM-Newton
We obtained two XMM-Newton observations allocated as Director Discretionary Time (OBs 0854590701 and 0854590801). The observations were performed on 2020-02-20 (from 13:27 to 16:52) and on 2020-02-22 (from 13:26 to 16:43). These on-source UT times refer to the EPIC-pn instrument, which observed the target in Full Frame and thin filter, with a time resolution of 73.37 ms. The on-source times for the other instruments (MOS cameras in Full Mode, thin filter; RGS in Default Spectroscopy Mode; OM in Fast Mode, U filter) vary only slightly. Data reduction was carried out with the SAS Data Analysis software version 17.0.0.
2.2.2 NICER
NICER observed FRB 180916 with several short observations over 6 days, to cover the predicted activity period of the target, obtained as Director Discretionary Time. A total of more than 113 ks were collected on source, with a sub-s time resolution in the 0.2-12 keV energy range.
2.2.3 INTEGRAL
INTEGRAL observed FRB 180916 via a Target of Opportunity in search for a possible steady or impulsive hard X-ray/soft -ray counterpart to its radio emission. The INTEGRAL observations were interrupted by two spacecraft perigee passages, and were carried out from 2020-02-20 14:53:58 to 2020-02-21 05:12 UT, from 2020-02-21 15:38 to 2020-02-23 20:42 UT, and from 2020-02-24 06:39 to 2020-02-24 17:20:31 UT, for a total on-source time of 261 ks (3 days).
All INTEGRAL data were processed using the standard INTEGRAL Offline Scientific Analysis (OSA) software, version 11.0.
2.2.4 AGILE
AGILE observed FRB 180916 with two detectors: the -ray imaging detector (GRID), which is sensitive in the range 30 MeV – 30 GeV with a 2.5 sr FoV, and the Mini-Calorimeter (MCAL), which is sensitive in the 0.4–100 MeV band with non-imaging acceptance (Tavani et al., 2009; Tavani, 2019). AGILE is currently operating in spinning mode, with the instrument axis rotating every minutes around the satellite-Sun direction. For each satellite revolution, a large fraction of the sky (%) is exposed, depending on the Earth occultation pattern and trigger disabling over the South Atlantic anomaly (SAA, about % of the 95-min orbit). Over timescales of hours, 80% of the entire sky can be exposed by the GRID -ray imager and by the MCAL.
2.3 Optical observations
2.3.1 SiFAP2/TNG
FRB 180916 was observed in the optical band with SiFAP2 (Ghedina et al., 2018) at the INAF’s 3.58-m Telescopio Nazionale Galileo (TNG). Based on the Silicon Photo Multiplier (SiPM) technology, SiFAP2 is composed of two Multi Pixel Photon Counter (MPPC) sensors working in the optical band ranging from 320 to 900 nm (Meddi et al., 2012; Ambrosino et al., 2016, 2017). Each sensor has a time tagging capability of 8 ns and can integrate the number of incoming photons in adjustable time windows ranging from 100 ms down to 1 ms. A commercial Global Positioning System (GPS) unit provides the absolute time with an accuracy that is better than 60 s (Papitto et al., 2019) on the UTC. At the TNG focal plane, the FoV of each sensor is about 7 7 arcsec2, ensuring that the sources are completely collected even in bad seeing conditions (3 arcsec). The two MPPC detectors acquired simultaneously the target (FRB 180916) and the nearby sky background located at an angular distance of 4 arcmin away from the target itself. The SiFAP2 observing run was carried out from 2020-02-21 20:35:02 to 2020-02-21 20:54:31 UT, for a total exposure time of roughly 1.2 ks. The acquisition was stopped because of bad weather conditions, ensuring only a short window (less than 20 min) of simultaneous observation with Aqueye+ (see §2.6.2) and the SRT.
2.3.2 Aqueye+ and IFI+Iqueye at Asiago
FRB 180916 was also observed with Aqueye+, which is mounted at the Copernicus telescope, and IFI+Iqueye, which is mounted at the Galileo telescope in Asiago, Italy. Aqueye+ and Iqueye333https://web.oapd.inaf.it/zampieri/aqueye-iqueye/ are fast photon counters with a field of view of 6–12 arcsec and the capability of time tagging the detected photons with sub-ns time accuracy (Barbieri et al., 2009; Naletto et al., 2009, 2013; Zampieri et al., 2015). Iqueye is fiber-fed through a dedicated instrument (Iqueye Fiber Interface; Zampieri et al. 2019). We also performed simultaneous observations of the field in the sloan band with a conventional CCD camera mounted on the 67/92 Schmidt telescope. Several (unfiltered) acquisitions were performed with Aqueye+ and IFI+Iqueye between 2020-02-20 and 23 (see Fig. 1), for a total on-source time of 11.5 h for Aqueye+ and 13.5 h for IFI+Iqueye. The sky background was simultaneously and continuously monitored with the on-sky detector of Aqueye+ (approximately 10 arcmin away from the target and with a FoV comparable to that of the on-source detectors). The average count rate measured with the on-source detectors was 2900–4300 count/s for Aqueye+ and 1800–3200 count/s for IFI+Iqueye. The data reduction was performed with dedicated software. The whole acquisition and reduction chain ensure an absolute accuracy of 0.5 ns relative to UTC (Naletto et al., 2009).
3 Data Analysis and Results
3.1 Radio
3.1.1 SRT
L-band data were recorded at 2-bits per sample by the DFB as psrfits (Hotan et al., 2004) files; these were later converted to 8-bit filterbank files using SIGPROC (Lorimer, 2011). P-band data were acquired as dada baseband files and subsequently converted to 8-bit filterbank format using digifil (van Straten & Bailes, 2011). The 64-MHz bandwidth was divided into 256, 250-kHz-wide channels and the resulting s time resolution was then averaged down to s; the data were coherently dedispersed at the nominal pc cm-3 (CF20). The P-band channelized filterbank files were processed through the Python-based pipeline named SPANDAK444https://github.com/gajjarv/PulsarSearch, which is similar to the one used in Gajjar et al. (2018a). Data were first processed through rfifind from the PRESTO package555https://www.cv.nrao.edu/~sransom/presto/ for high-level RFI purging. The pipeline uses Heimdall (Barsdell et al., 2012) as the main kernel to quickly search across a DM range from 300 to 400 pc cm-3. Since Heimdall is unaware of the fact that the data is coherently de-dispersed at the nominal DM of the source, we used a threshold of 0.01% for the maximum sensitivity loss for each given DM, so that the DM step would be 0.03 pc cm-3, corresponding to a maximum DM smearing of 0.5 ms across the observing band. For the same reason, we used the option -no_scrunching to avoid time rebinning at the FRB’s DM. The de-dispersed time-series were searched for pulses using a matched-filtering technique with a maximum window size of 32.8 ms. Each candidate found by Heimdall was scrutinized against all other candidates for each given observation to validate and identify only the genuine ones. The pipeline produced around 7000 candidates at different DMs. All candidates with DM between 340 and 360 pc cm-3 were visually inspected; we identified three clear bursts from the observations at 328 MHz on 2020-02-20, which will be discussed below. As a cross-check, we also analyzed the P-band data using PRESTO over 121 DM values covering the range 345.82 – 351.82 pc cm-3. A slightly different approach was used for RFI excision, where only the frequency channels affected by strong RFI were removed through the -ignorechan option of the PRESTO’s prepsubband routine. The option -noclip was also used during de-dispersion to avoid strong bursts being flagged as RFI. The python code single_pulse_search.py was used with a signal-to-noise (S/N) threshold of 6, a maximum width of 38.4 ms, and the option -b to avoid checking for bad blocks (potentially saving strong pulses from being discarded). The only good single pulses found were the same three as the ones detected by the SPANDAK pipeline. The remaining candidates were all monochromatic bursts of RFI.
L-band observations were analyzed using the same pipeline as the P-band observations and, given the large amount of RFI, using the single pulse search from PRESTO on a small DM range around the nominal value. In particular, the data were first cleaned from RFI using rfifind, then de-dispersed with prepsubband using 12 DM values from 346.32 to 351.82. The resulting time series were analyzed with single_pulse_search.py using a S/N threshold of 10 and a maximum width of 37.5 ms. All of the resulting candidates were visually inspected and recognized as RFI.
In summary, the SRT detected three radio bursts from FRB 180916 in the P band on 2020-02-20. It is interesting to note that this is the first firm detection of a FRB below 400 MHz. Detection of nine bursts at 111 MHz has been reported by Fedorova & Rodin (2019). However, the observational setup of their system (a coarse frequency resolution of 78 kHz over a tiny observing bandwidth of 2.5 MHz, and a sampling time not faster than 12.5 ms) required the use of a template matching approach in order to see the bursts. Although the authors do their best to support the validity of this methodology, its use is very limited so far in the context of FRB searches, and the statistics of the false-positive is not completely assessed. Moreover, the claimed detection is very hard to reconcile with the stringent limits imposed by all other non-detections at similar frequencies, derived by using well consolidated procedures (Coenen et al., 2014; Tingay et al., 2015; Karastergiou et al., 2015; Sokolowski et al., 2018; Chawla et al., 2020). Properties of these bursts are summarized in Table 1. No simultaneous bursts (taking into account the DM-delay between the two bands) were detected blindly in the L-band data, down to a limiting sensitivity of mJy, where is the pulse width in ms. By analyzing the relevant data segments, the limit can be moved down to mJy, with a threshold.
| Time | Time | Width | S/N | Peak flux | Fluence | DM |
|---|---|---|---|---|---|---|
| (UT) | (MJD) | (ms) | (-) | (Jy) | (Jy ms) | (pc cm-3) |
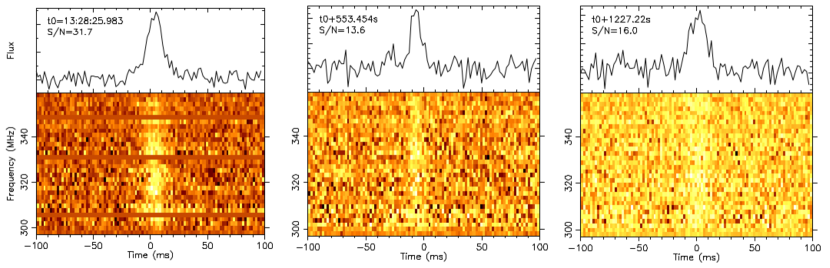
| 13:28:25.983(8) | 58899.56141184 | 13(4) | 31.7 | 2.8(9) | 37(16) | 349.8(1) |
| 13:37:39.437(7) | 58899.56781756 | 9(4) | 13.6 | 1.5(7) | 13(8) | 349.4(1) |
| 13:48:53.20(1) | 58899.57561573 | 14(4) | 16.0 | 1.4(4) | 19(8) | 350.1(1) |
3.1.2 DM optimization and Burst structures
FRBs are known to show complex burst structures with multiple burst components. Many of the repeating and non-repeating FRBs have been shown to exhibit a drifting emission pattern where emission gradually moves from higher to lower frequencies across the leading component to consecutive trailing components. Gajjar et al. (2018a) showed that these burst structures can superimpose for different trial DMs, which could lead to incorrect DM estimations. As shown in Fig. 2, all of our detected bursts show a single component. However, it is possible that our observations were not sensitive enough to resolve these underlying structures. One of the ways to reveal such structures is to estimate “structure-maximizing DM” – DM where all sub-burst structures spanning different frequencies arrive at the same time. This structure-maximizing DM can then be compared with the S/N-maximizing DM (DM where S/N of integrated burst profile peaks). If there are underlying structures, they are likely to superimpose to give higher S/N-maximizing DM compared to the structure-maximizing DM (see Figure 1 in Gajjar et al. 2018a).
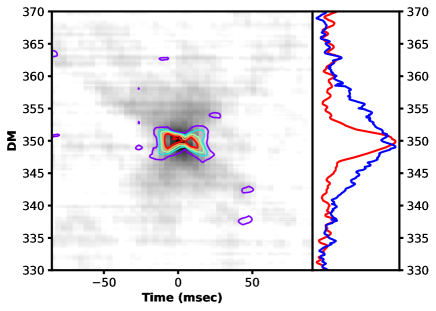
Two different techniques have been proposed to estimate the structure-maximizing DM. CHIME/FRB Collaboration et al. (2019c) suggested a coherent summation of Fourier transformed spectra taken across channels for the burst, while Gajjar et al. (2018a) suggested maximizing the forward time-derivative of the burst profile. For weaker burst pulses, Hessels et al. (2019) suggested a second-order forward derivative, while Josephy et al. (2019) suggested a fourth-order forward derivative. Here, we carried out a comparison between S/N-maximizing DMs and structure-maximizing DMs across a range of trial DMs for our brightest detected burst (i.e. burst-1). To estimate the structure-maximizing DM, we found that the second-order derivative was able to provide a single prominent peak. Fig. 3 shows the comparison of S/N-maximizing DMs with structure-maximizing DMs for burst-1. We did not find any significant difference between these two DMs within the measurement uncertainties. Thus, we confirm the absence of any underlying sub-burst structure for our detected bursts. This could also be due to our limited observing bandwidth. For example, burst number 2 (from day 181019) from FRB 180916 appears to show two components where the frequency span of each sub-burst structure is around 100 MHz CHIME/FRB Collaboration et al. (2019d), which is larger than the bandwidth of our observations.
3.1.3 Northern Cross
Single-beam, channelized observations were analyzed following a pipeline similar to the SRT case and based on the Heimdall code. Observations, which were not simultaneous with the SRT detected bursts, achieved a Jy rms sensitivity at 408 MHz. No burst was detected in the 7.5 h of campaign.
3.2 X-ray and Gamma-ray observations
XMM-Newton
We focused on the data obtained by the EPIC-pn, since it has the largest effective area among the available instruments, and offered the best time resolution ( ms compared to s for the EPIC-MOS cameras). We only considered the first hour of the first observations, during which the SRT detected the three bursts reported here; it was the only time in which the observations were not affected by a high flaring particle background. We extracted good events, singles and doubles (PATTERN ) with an energy range between 0.3 and 10 keV. We extracted a region of 25 arcseconds around the position of FRB 180916, while different background regions were extracted on source-free parts of the same CCD, and then back-scaled to the dimension of the on-source extraction. At the position of the source, we have counted photons in 3.2 ks, which are compatible with the average of background photons. The corresponding UL on the background subtracted average count rate, evaluated for a confidence level, is s-1 (see Gehrels, 1986). We assumed a spectral model typical of magnetar steady emission (see, e.g. Rea et al., 2008), composed of a black body (with keV) and a power-law component (with ), and an absorption column of cm-1 evaluated from the Galactic H I Column Density maps in the source direction with the Heasoft NH tool. Under these assumptions, we estimated an upper limit on the unabsorbed persistent flux of erg cm-2 s-1 (0.3–10 keV). At a luminosity distance of 149 Mpc, this corresponds to erg s-1.
A search for any impulsive or nearly-impulsive excess at or close to the times of the three bursts yielded no significant detection. The closest in time X-ray photon from the source position lagged the third observed radio burst by s. We evaluated ULs of 90.3 and 6.6 s-1 on the count rate in each of the 73ms-bins coincident with radio detections, and within an interval of 1 , respectively. Assuming a spectrum typical of SGR bursts (see, e.g. Israel et al., 2008), composed of two black body components with temperatures and keV, respectively, and the absorption column reported above, an upper limit on the unabsorbed burst-like (0.3–10 keV) flux of erg cm-2 s-1 and of erg cm-2 s-1 for the first and second radio detections. These correspond to luminosity limits to the X-ray counterparts of the two bursts of erg s-1 and erg s-1.
We note that by loosening the filtering criteria, namely including the lowest energies, a cluster of photons is detected at a position that is marginally consistent with the target, at UT time 2020-02-20 13:31:56 (barycentered to the Solar System using DE-405 ephemerides), which would correspond to either a few minutes before the first SRT burst, or a few minutes after the second SRT burst. However, a careful inspection of the data reveal that the detected photons form a clear track on the detector. We conclude that they are caused by the interaction of an energetic particle with the detector.
NICER
NICER was not pointing at the target at the times SRT detected the three bursts reported here, because of viewing limitations. A search for impulsive events yielded no significant detection through the whole dataset. Further deeper searches are ongoing and the results will be presented in future publications.
INTEGRAL
All three radio bursts reported in this paper occurred between and h before the start of the INTEGRAL pointing observation, and no deep ULs can be obtained close to the time of the discovered events. Using INTEGRAL all-sky detectors, we derive a 3-sigma UL on a 75-2000 keV fluence of any burst shorter than 1-s (50-ms) of erg cm-2 ( erg cm-2) anywhere within seconds from the radio bursts. In addition, we searched for any short magnetar-like bursts in the entire INTEGRAL/ISGRI observation, and did not detect any, setting a 3-sigma UL on 28–80 keV fluence in 1 s at the level of erg cm-2, and on fluence in less than 100 ms at the level of erg cm-2.
Integrating over the entire INTEGRAL exposure time, we do not detect any steady emitting source at the position of FRB 180916. We derive a 3-sigma UL on the average flux of erg cm-2 s-1 in the 28-80 keV energy range (with IBIS/ISGRI), and erg cm-2 s-1 in the 3–10 keV range (with JEM-X).
AGILE
The AGILE/MCAL on-board data acquisition is based on a trigger logic acting on different energy ranges and timescales (ranging from s to s). A detailed discussion about MCAL triggering and UL capabilities in the context of FRB studies is reported in (Casentini et al., 2020; Ursi et al., 2019).
We searched for MCAL triggered events at or near the radio bursts. Our search was within seconds from the arrival times of Table 1. MCAL collected useful data only for burst-1. For the other two events, the AGILE satellite was in the SAA region, and no MCAL data could be obtained. No significant event was detected in temporal coincidence with burst-1. The MeV fluence UL obtained for a millisecond timescale trigger is . Table 2 shows the MCAL fluence ULs at different trigger timescales. The value at 1 s corresponds to an isotropic MeV luminosity of .
| sub-ms | 1 ms | 16 ms | 64 ms | 256 ms | 1024 ms | 8192 ms |
|---|---|---|---|---|---|---|
The analysis of -ray GRID data is based on the standard AGILE-GRID multi-source likelihood analysis (Bulgarelli et al., 2012) that takes into account nearby known -ray sources and the diffuse Galactic emission at the FRB 180916 location (, ). For this campaign, we obtained -ray flux ULs for different integrations: (1) a 100 s integration centered at the burst time of event-1; and (2) a 5-day integration covering a complete activity cycle of FRB 180916(19-24 Feb., 2020); (3) a 30-day interval that also includes the previous cycle (4-8 Feb., 2020) during which AGILE was observing simultaneously with Swift (Tavani et al., 2020a). The corresponding UL values are: for the 100 s integration above 50 MeV; for the 5-day integration above 100 MeV, and for the 30-day integration above 100 MeV. The latter value corresponds to an isotropic long-term averaged -ray luminosity .
3.3 Optical
The optical telescopes did not observe simultaneously with the detected radio bursts, which happened during the day time.
SiFAP2
To derive an upper limit for the other slots of observation in this campaign, we considered the ratio between the count rate observed from the source position and from the sky background. This smoothed out the effect of quickly varying atmospheric conditions that characterized the sky during the observations. We did not detect any impulsive signal above a sensitivity threshold of 38.6 counts per 1 ms-long bin (3 confidence level after taking into account for the number of trials). This corresponds to a magnitude of .
Aqueye+ and IFI+Iqueye
We performed a systematic search for any significant increase in the count rate on 1-ms binned light curves of the optical observations (not background subtracted). We did not detect any simultaneous on-source radio-optical burst. Considering the average rate and the number of trials, the limiting sensitivity for the detection of a 1 ms pulse at the confidence level in an observation of 1 hour duration is 19–23 counts/bin for Aqueye+ and 15–20 counts/bin for Iqueye, corresponding to an instantaneous (1 ms) magnitude (fluence 0.012–0.016 Jy ms) for Aqueye+ a (fluence 0.060-0.079 Jy ms) for Iqueye.
Standard data reduction was applied to the simultaneous Schmidt images. No event was detected in any of the images down to a limiting magnitude (fluence 7.9 Jy ms for a 5-min exposure).
4 Discussion
4.1 Temporal distribution of the bursts
SRT observed for a total of 30.3 hours. The three bursts were observed within a 20-minute interval at phase of the active period, which peaks at phase 0.5. No other bursts were detected at P-band during the remainder of the campaign and no bursts at all were detected throughout the whole campaign at L-band. Given our nominal sensitivity, we expect that we would have been able to detect at least three of the four bursts detected by Effelsberg at L-band in Marcote et al. (2020).
Assuming a Poissonian distribution of the events in the days of activity of the source, and with the hypothesis that our sensitivity did not change during the time span of the observations, except for little variation of the RFI environment, we calculated the probability that our detections all happened during the first hour of observations. If we assume the rate of burst h-1 from CF20, we obtain a probability that the SRT should observe only three bursts during the full time span of its observations, and obviously the probability is even lower for the 3 bursts to all occur within a 20 min interval. While it is true that no fluence completeness distribution can be derived for the SRT at the moment, and that the two instruments have different sensitivity limits, the aforementioned probabilities seem to discard a uniform distribution of bursts at 328 MHz along the day window; they favor a clustering of the bursting activity of FRB 180916, as also hinted at by CHIME observations. Zanazzi & Lai (2020) propose that this clustering is expected in the framework of their precessing magnetar model. This is because the viewing angle of an observer constantly changes phase with respect to the neutron star’s inclination angle due to precession, and the intensity of the bursts changes accordingly.
4.1.1 Scattering
We investigated the possible presence of a scattering tail in the observed profiles, by comparing them to simulated scattered ones. The code we used to generate the simulated profiles was designed for radio pulsar profile investigations, and requires, as a reference, an observed profile at a frequency that is high enough to be unaffected by this phenomenon. In this case, given the lack of such a reference profile, we assumed that the unscattered profile is well approximated by a Gaussian curve. We then exploited the 2D space, where is the unknown width of the unscattered Gaussian, and is the scattering time at our observing frequencies. We compared the simulated profile corresponding to each couple to the observed one, and assigned a value to each of them:
| (1) |
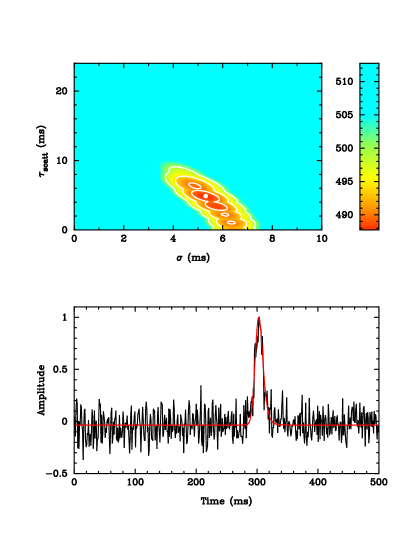
where is the simulated profile, is the observed one, and is the phase shift between the two profiles for which is minimum. The upper panel of Fig. 4 displays the resulting map for burst 1 along with the 1-, 2- and 3- contour levels. The lower panel shows the observed profile resolved in 512 bins along the displayed 0.5 seconds of data, with, superimposed, the simulated scattered profile that results from the couple of values for which the is minimum. The resulting maps for each of the 3 bursts indicate that the 2 ULs for at MHz are 9.5 ms, 10.2 ms and 10.8 ms for bursts 1, 2 and 3, respectively.
Once re-scaled to the reference frequency of 1 GHz, they imply ms, under the hypothesis (where is the radio frequency). This result fits in nicely with the DM correlation f reported by CHIME/FRB Collaboration et al. (2019e), in their Fig. 2.
It is worth noting that the inspection of the maps shows that the three SRT bursts are also compatible with being immune to (or having a very low level of) scattering, which means that the detection at frequencies that are even lower than the SRT P band might be possible. For instance, a value of ms at MHz would translate to modest scattering delays ( ms) at frequencies around MHz, which are typical of the LOFAR High band (van Haarlem et al., 2013; Stappers et al., 2011). On the other hand, for values approaching the ULs reported above, the burst energy would be diluted over s, easily causing the non-detection of similar bursts with LOFAR (Houben et al., 2019). Therefore, additional future observations of the periodic FRB 180916 at P-band (where the feasibility is now warranted) are needed to collect events that are bright enough to finally constrain the value of . This is particularly crucial for assessing the role played in FRB science – at least for nearby sources – by future low frequency telescopes, such as SKA-LOW, which will be operating in the 50–350 MHz band.
4.2 Spectral properties of the radio bursts
Several explanations were proposed to explain the lack of detection of FRBs or RFRBs at low frequencies. Ravi & Loeb (2019) suggested that free-free absorption by electrons in the intervening medium or, alternatively, induced Compton scattering can be responsible for the non-detections below 400 MHz (Chawla et al., 2017; Sokolowski et al., 2018; Rajwade et al., 2020a). Rajwade et al. (2020a), in particular, showed that induced Compton scattering alone cannot account for the lack of detections in their 332 MHz FRB survey. They suggest that free-free absorption should play a more prominent role, most likely happening in post-shock regions of super-luminal supernovae (SNe) where the electron densities can reach cm3 (Margalit & Metzger, 2018). Sokolowski et al. (2018) reached similar conclusions, although without discriminating between physical absorption models. The FRB 180916 case is a peculiar example of the opposite scenario, where the three bursts are seen at 328 MHz but are undetected at 1.4 GHz, revealing the absence of a spectral turnover.
Barring any specific modeling, the detection of three bursts at 328 MHz confirms that (R)FRB environments can be optically thin to this emission and that a cutoff for the bursting mechanism, if present, must be at even lower frequencies. Although FRBs have not yet shown simultaneous emission over a wide radio frequency band, simultaneous radio observations in two widely separate bands - as shown here - can be extremely valuable for constraining the instantaneous apparent spectral properties of the bursts. In fact, it is worth noting that the observed spectrum of FRBs is likely significantly affected by the effects of the medium the signal went across (see e.g. Cordes & Chatterjee 2019; Cordes et al. 2017) and hence might not map the intrinsic spectral properties of the source.
Our single-frequency detection does not allow us to place constraints on any specific physical mechanisms, but our detection threshold is comparable to Rajwade et al. (2020b), indicating that the environment of a super-luminal supernova (SN) seems unlikely for this source - even though it is located in a star-forming region (Marcote et al., 2020). The absence of a bright SN is consistent with the fact that Marcote et al. (2020) do not find accompanying persistent emission to FRB 180916 down to a limiting sensitivity that is 400 times lower than the detected emission of FRB 121102. In particular, the non-detection at L-band allows us to set an UL on the burst spectral index666We use the convention , where is the flux density at the frequency . for the brightest burst, assuming the nominal L-band sensitivity. A modulation due to plasma lenses (Cordes et al., 2017) remains an open possibility, although the lack of simultaneous detection at 1.4 GHz makes it not obvious; a future, dedicated analysis will be required.
4.3 Burst energetics
The total (assumed isotropic) energy emitted in the observed radio band during a radio burst can be approximated as:
| (2) |
where is the measured FRB peak flux density in Jy, is the duration of the burst in ms, is the bandwidth in GHz and with the source distance from Earth. For burst-1 from SRT, Jy, ms, and GHz, resulting in .
Where does this energy output come from? The plethora of proposed theoretical models about the emission mechanism(s) – and hence the energetics – of Repeating FRBs (RFRBs) mainly rely on the observed properties of the original source, FRB 121102. In particular, most hypotheses invoked a relatively young magnetar spinning at a millisecond period, whose radio bursting activity might be powered by its high magnetic field and resulting from either internal processes or triggered by the interaction with an extreme magneto-ionic environment (see e.g. Beloborodov 2017; Margalit & Metzger 2018).
As reported in §1, similar considerations could be applied to the case of FRB 180916, once suitably adjusted to explain its periodicity. However, there are also significant differences between the properties of the two RFRBs (e.g. the nature of the host galaxy, Tendulkar et al. 2017; Chatterjee et al. 2017; Marcote et al. 2017, 2020, the Rotation Measure, Michilli et al. 2018; Gajjar et al. 2018b, CF20), which may lead us to explore other possibilities, such as the idea (see e.g. Cordes & Wasserman 2016) of a predominant role of the spin-down power of a neutron star (NS) in shaping the energetics of FRB 180916. In fact, emission from pulsar giant pulses (considered as a manifestation of the conversion of rotational energy into coherent bright radio emission), as observed for instance from the Crab pulsar (see e.g. Mickaliger et al. 2012; Hankins & Eilek 2007), was proposed by some authors (Lyutikov et al., 2016) as a favored emission mechanism for the FRB, as compared to a magnetic-powered scenario, on the basis of both the energetics and other properties of the pulsar giant pulses (i.e. polarization, spectra) that are reminiscent of what is seen in FRBs.
The energy of burst-1 is several orders of magnitude above the typical energy of the Crab’s giant pulses (see e.g. Mickaliger et al. 2012; Hankins et al. 2003). However, it was noted (Cordes & Wasserman, 2016) that ms-duration emission can be the result of the coherent addition of ns-shot emission, similarly to the strongest examples observed in the Crab pulsar, in which unresolved 0.4 ns bursts of MJy have been detected (Hankins & Eilek 2007). Cordes & Wasserman (2016) suggested that a much longer monitoring of the Crab pulsar with respect to that available so far could show the occurrence of ultra giant pulses with energetics comparable to that of FRBs. In addition, much brighter pulses could be released by a NS that is younger and more energetic than the Crab.
This hypothesis would in turn call for the FRB 180916’s source to be enshrouded in a SN remnant. Piro (2016) studied this case and noted that the reverse shock, produced by the SN ejecta when they encounter the interstellar medium, generates free electrons that can disperse and absorb the radio signal. Hence, emission down to MHz can escape from free-free absorption only when the intervening matter is diluted enough, i.e. at least years after the SN explosion, depending on the density of the medium and, mostly, on the mass of the ejecta. Following this model (Fig. 5 of Piro 2016), and assuming the usually invoked formulae relating and to the age and the surface magnetic field of a neutron star (see e.g. Lorimer & Kramer 2004), the energy released by burst-1 could originate from the spin-down power of a NS of age larger than about yrs, spin period of a few ms, and surface magnetic field G. This picture could be validated by the observation of a progressively-decreasing dispersion measure associated with the pulses during the next few years.
Very recent developments in the field are showing that a border land may be connecting the two aforementioned energy sources for the RFRBs, which might also be simultaneously at work. In March 2020, Esposito et al. (2020) observed the just discovered (Enoto et al., 2020), and possibly also the youngest (Champion et al., 2020), Galactic magnetar, Swift-J1818.0–1607. Seven days after the occurrence of an X-ray burst – which is usually interpreted as a magnetic-powered event –, an observation with SRT showed that the radio emission from Swift-J1818.0–1607 (in turn discovered shortly after the X-ray burst Karuppusamy et al. 2020), was at that time predominantly occurring in the form of strong and sporadic radio pulses. In April 2020, the already known Galactic magnetar SGR J1935+2154 was observed by Swift (Palmer, 2020), soon followed by many X-ray instruments, to produce a forest of X-ray bursts. Four days later, Scholz & Chime/Frb Collaboration (2020) reported a single ms-duration radio burst observed by CHIME and coming from the same source with an estimated fluence of kJy ms; it was also independently detected by STARE2 (Bochenek et al., 2020) at L-band, with an estimated fluence MJy ms. Despite extensive radio follow-ups, at the date of writing, only one other burst has been reported since then: it was observed by FAST six days after the original X-ray event, with an estimated fluence of 60 mJy ms at L-band (Zhang et al., 2020a). While these radio bursts, from an energetics point of view, are all still not bright enough to match the more energetic FRBs, this is the closest example we have come so far to directly associate a class of known sources (magnetars and pulsars), as well as of emission properties (X-ray bursts and very strong radio pulses), to a phenomenology resembling that of RFRBs.
4.4 The multi-wavelength campaign and constraints to models
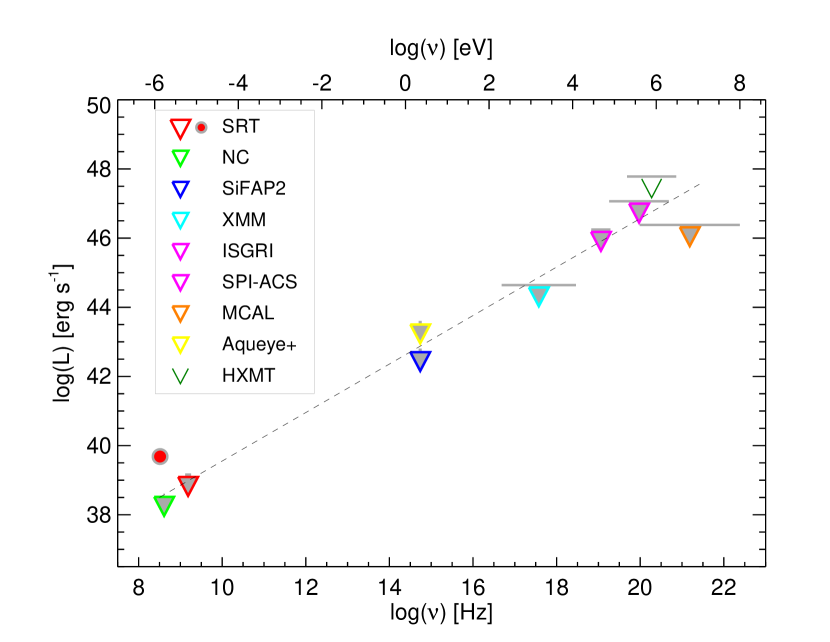
Fig. 5 shows a summary of the ms-fluence ULs obtained using the instruments involved in our campaign. XMM-Newton and AGILE were active at the time of the detected bursts and therefore their ULs, together with SRT’s L-band, constitute a punctual limit on the high energy emission from the SRT bursts. The ULs displayed for the NC and the optical telescopes are, on the other hand, an estimate of the sensitivity reached by our survey. For comparison, we show HXMT UL that was recently published in Guidorzi et al. (2020).
Simultaneous X-ray observations with XMM-Newton in the X-ray range led to upper limits on the persistent and burst luminosities, of and erg s-1, respectively (under the assumptions for the spectral shapes reported in §3.2). In the case of an isolated young pulsar scenario, this persistent limit is not constraining, given that the typical X-ray luminosity of a young rotational powered pulsar or a magnetar are erg s-1. As for the bursting luminosity, we can compare the ULs related to the available XMM, INTEGRAL, and AGILE data (see below) to check the level at which ultra energetic events can be constrained.
X-ray and hard X-ray observations with INTEGRAL (not simultaneous with the SRT radio bursts) on 0.1–1 sec timescales provide ULs to the fluence in the range , and therefore an UL on the total energy in the range .
As for AGILE, we focus on burst-1, which has the largest radio fluence among those detected by SRT. AGILE/MCAL provides an interesting UL in the MeV range simultaneously with this radio detection. The value of translates into an UL for the isotropically radiated energy into the MeV range, . This value of should be compared with the energy emitted in the radio band, . Therefore, our UL on the energy emitted in the MeV range on millisecond timescales is less than times the energy emitted at 328 MHz for this radio burst.
It is interesting to compare the various high-energy ULs reported above with the energy emitted by the soft gamma-ray repeater SGR 1806–20 (e.g. Turolla et al. 2015) during its Giant Outburst in 2004, which lasted about 200 ms (Palmer et al., 2005; Hurley et al., 2005), while burst-1 lasted ms. In that case, an isotropic energy was emitted in the MeV range. We can thus exclude, as a counterpart to burst-1 in X-rays, a Giant Burst that is at least twice as bright as SGR 1806–20. As already mentioned in §4.3, Integral, AGILE, Konus-Wind and HXMT (Mereghetti et al., 2020; Tavani et al., 2020b; Ridnaia et al., 2020; Zhang et al., 2020b) most recently detected the hard X-ray counterpart to the radio burst from SGR J1935+2154 observed by CHIME and STARE2. The preliminary estimated fluence of the high energy burst, compared to the radio one, indicates that current telescope sensitivities might still be too high to detect high energy emission even from relatively close FRBs such as FRB 180916.
During the reviewing stages of this manuscript, the results of a multi-wavelength campaign involving the Chandra X-ray telescope observing FRB 180916 simultaneously with CHIME were reported by Scholz et al. (2020). Their conclusions agree with our findings.
5 Summary
Our multi-wavelength observations of FRB 180916 provide a wealth of valuable information on this puzzling source. The SRT detection of three strong radio bursts at 328 MHz represents the first firm detection of any FRB type at such low frequencies. It also shows that no significant scattering is affecting the emission at these frequencies. On the one hand, this confirms that the scattering time and DM seem to correlate (CHIME/FRB Collaboration et al., 2019a; Cordes & Chatterjee, 2019); on the other hand, this leaves open a detection of (at least relatively nearby) FRBs at even lower frequencies with instruments such as LOFAR and SKA-LOW. The lack of a simultaneous detection at 1.5 GHz is also relevant: it confirms the narrow-band emission typically seen from Repeaters, indicating either a relatively steep spectrum of the intrinsic radio emission or a strong effect of the intervening medium.
The source is capable of emitting within a few tens of milliseconds at 328 MHz, that is an energy many orders of magnitude larger than the giant pulses from Crab-like pulsars. In addition, the upper limits resulting from our simultaneous observation in the keV–MeV range for the first radio burst detected by the SRT are still compatible with a high-energy activity that is similar to the 2004 giant outburst of SGR 1806–20. Additional upper limits obtained from our non-simultaneous observations in the optical, X-ray, hard X-ray and gamma-ray energy ranges constrain the emission of the FRB 180916 source to be less than times the Eddington luminosity for a one solar-mass compact object.
The periodicity of the bursting activity of FRB 180916 represents an unprecedented observational opportunity to characterize its properties. Given the erratic behavior - from the optical to the high-energy frequencies - that is expected in the various proposed models, the long-term radio monitoring at low and intermediate frequencies, as well as deep observations with the best available instruments across the electromagnetic spectrum, might finally allow us to determine the nature of the source and strongly constrain the mechanism of burst production.
ACKNOWLEDGMENTS
The authors thank the anonymous referee for helpful suggestions which helped improve the paper. M.P. wishes to thank Marilyn Cruces and Dongzi Li for useful discussions. A.Po., M.B. and A.R. gratefully acknowledge financial support from the research grant “iPeska” (P.I. Andrea Possenti) funded under the INAF national call PRIN-SKA/CTA with Presidential Decree 70/2016. V.G. is supported by Breakthrough Listen, which is managed by the Breakthrough Initiatives and sponsored by the Breakthrough Prize Foundation (http://www.breakthroughinitiatives.org). F.P. acknowledges financial support from ASI/INAF agreement n.2019-35-HH.0 and PRIN-INAF SKA-CTA 2016. A.Pa. and L.Z. acknowledge financial support from the Italian Space Agency (ASI) and National Institute for Astrophysics (INAF) under agreements ASI-INAF I/037/12/0 and ASI-INAF n.2017- 14-H.0 and from INAF ‘Sostegno alla ricerca scientifica main streams dell’INAF’, Presidential Decree 43/2018. N.R. is supported by the ERC Consolidator Grant “MAGNESIA” under grant agreement Nr. 817661, Catalan grant SGR2017-1383, Spanish grant PGC2018-095512-BI00, and acknowledge support from the PHAROS COST Action (CA16214). The Sardinia Radio Telescope is funded by the Department of Universities and Research (MIUR), the Italian Space Agency (ASI), and the Autonomous Region of Sardinia (RAS), and is operated as a National Facility by the National Institute for Astrophysics (INAF). We thank the SRT staff for the timely scheduling of the observations. We thank Norbert Schartel for approving XMM-Newton Directors Discretionary Time and the XMM-Newton SOC staff for scheduling the observations. The SiFAP2 team thanks the TNG Director Ennio Poretti for the time scheduled within the time reserved for technical purposes. The results presented in this paper are based on the observations made with the Italian Telescopio Nazionale Galileo (TNG) operated by the Fundación Galileo Galilei (FGG) of the Istituto Nazionale di Astrofisica (INAF) at the Observatorio del Roque de los Muchachos (La Palma, Canary Islands, Spain) and on observations collected at the Copernicus and Schmidt telescopes (Asiago, Italy) of the INAF-Osservatorio Astronomico di Padova and at the Galileo telescope (Asiago, Italy) of the University of Padova.
References
- Ambrosino et al. (2016) Ambrosino, F., Cretaro, P., Meddi, F., et al. 2016, Journal of Astronomical Instrumentation, 5, 1650005, doi: 10.1142/S2251171716500057
- Ambrosino et al. (2017) Ambrosino, F., Papitto, A., Stella, L., et al. 2017, Nature Astronomy, 1, 854, doi: 10.1038/s41550-017-0266-2
- Barbieri et al. (2009) Barbieri, C., Naletto, G., Occhipinti, T., et al. 2009, Journal of Modern Optics, 56, 261, doi: 10.1080/09500340802450565
- Barsdell et al. (2012) Barsdell, B. R., Bailes, M., Barnes, D. G., & Fluke, C. J. 2012, MNRAS, 422, 379, doi: 10.1111/j.1365-2966.2012.20622.x
- Bassa et al. (2016) Bassa, C. G., Janssen, G. H., Karuppusamy, R., et al. 2016, MNRAS, 456, 2196, doi: 10.1093/mnras/stv2755
- Beloborodov (2017) Beloborodov, A. M. 2017, ApJ, 843, L26, doi: 10.3847/2041-8213/aa78f3
- Beniamini et al. (2020) Beniamini, P., Wadiasingh, Z., & Metzger, B. D. 2020, arXiv e-prints, arXiv:2003.12509. https://arxiv.org/abs/2003.12509
- Bochenek et al. (2020) Bochenek, C., Kulkarni, S., Ravi, V., et al. 2020, The Astronomer’s Telegram, 13684, 1
- Bolli et al. (2015) Bolli, P., Orlati, A., Stringhetti, L., et al. 2015, Journal of Astronomical Instrumentation, 4, 1550008, doi: 10.1142/S2251171715500087
- Bulgarelli et al. (2012) Bulgarelli, A., Chen, A. W., Tavani, M., et al. 2012, A&A, 540, A79, doi: 10.1051/0004-6361/201118023
- Casentini et al. (2020) Casentini, C., Verrecchia, F., Tavani, M., et al. 2020, ApJ, 890, L32, doi: 10.3847/2041-8213/ab720a
- Champion et al. (2020) Champion, D., Desvignes, G., Jankowski, F., et al. 2020, The Astronomer’s Telegram, 13559, 1
- Chatterjee et al. (2017) Chatterjee, S., Law, C. J., Wharton, R. S., et al. 2017, Nature, 541, 58, doi: 10.1038/nature20797
- Chawla et al. (2017) Chawla, P., Kaspi, V. M., Josephy, A., et al. 2017, ApJ, 844, 140, doi: 10.3847/1538-4357/aa7d57
- Chawla et al. (2020) Chawla, P., Andersen, B. C., Bhardwaj, M., et al. 2020, arXiv e-prints, arXiv:2004.02862. https://arxiv.org/abs/2004.02862
- CHIME/FRB Collaboration et al. (2018) CHIME/FRB Collaboration, Amiri, M., Bandura, K., et al. 2018, ApJ, 863, 48, doi: 10.3847/1538-4357/aad188
- CHIME/FRB Collaboration et al. (2019a) —. 2019a, Nature, 566, 235, doi: 10.1038/s41586-018-0864-x
- CHIME/FRB Collaboration et al. (2019b) CHIME/FRB Collaboration, :, Andersen, B. C., et al. 2019b, arXiv e-prints, arXiv:1908.03507. https://arxiv.org/abs/1908.03507
- CHIME/FRB Collaboration et al. (2019c) CHIME/FRB Collaboration, Andersen, B. C., Bandura, K., et al. 2019c, ApJ, 885, L24, doi: 10.3847/2041-8213/ab4a80
- CHIME/FRB Collaboration et al. (2019d) CHIME/FRB Collaboration, Amiri, M., Bandura, K., et al. 2019d, Nature, 566, 235, doi: 10.1038/s41586-018-0864-x
- CHIME/FRB Collaboration et al. (2019e) —. 2019e, Nature, 566, 230, doi: 10.1038/s41586-018-0867-7
- CHIME/FRB Collaboration et al. (2020) CHIME/FRB Collaboration, Amiri, M., Andersen, B. C., et al. 2020, arXiv e-prints, arXiv:2001.10275. https://arxiv.org/abs/2001.10275
- Coenen et al. (2014) Coenen, T., van Leeuwen, J., Hessels, J. W. T., et al. 2014, A&A, 570, A60, doi: 10.1051/0004-6361/201424495
- Cordes & Chatterjee (2019) Cordes, J. M., & Chatterjee, S. 2019, ARA&A, 57, 417, doi: 10.1146/annurev-astro-091918-104501
- Cordes & Wasserman (2016) Cordes, J. M., & Wasserman, I. 2016, MNRAS, 457, 232, doi: 10.1093/mnras/stv2948
- Cordes et al. (2017) Cordes, J. M., Wasserman, I., Hessels, J. W. T., et al. 2017, ApJ, 842, 35, doi: 10.3847/1538-4357/aa74da
- Dai & Zhong (2020) Dai, Z. G., & Zhong, S. Q. 2020, arXiv e-prints, arXiv:2003.04644. https://arxiv.org/abs/2003.04644
- Enoto et al. (2020) Enoto, T., Sakamoto, T., Younes, G., et al. 2020, The Astronomer’s Telegram, 13551, 1
- Esposito et al. (2020) Esposito, P., Rea, N., Borghese, A., et al. 2020, arXiv e-prints, arXiv:2004.04083. https://arxiv.org/abs/2004.04083
- Fedorova & Rodin (2019) Fedorova, V. A., & Rodin, A. E. 2019, Astronomy Reports, 63, 877, doi: 10.1134/S1063772919110039
- Fonseca et al. (2020) Fonseca, E., Andersen, B. C., Bhardwaj, M., et al. 2020, arXiv e-prints, arXiv:2001.03595. https://arxiv.org/abs/2001.03595
- Gajjar et al. (2018a) Gajjar, V., Siemion, A. P. V., Price, D. C., et al. 2018a, ApJ, 863, 2, doi: 10.3847/1538-4357/aad005
- Gajjar et al. (2018b) —. 2018b, ApJ, 863, 2, doi: 10.3847/1538-4357/aad005
- Gehrels (1986) Gehrels, N. 1986, ApJ, 303, 336, doi: 10.1086/164079
- Ghedina et al. (2018) Ghedina, A., Leone, F., Ambrosino, F., et al. 2018, in Society of Photo-Optical Instrumentation Engineers (SPIE) Conference Series, Vol. 10702, Proceedings of the SPIE, 107025Q, doi: 10.1117/12.2316348
- Gu et al. (2020) Gu, W.-M., Yi, T., & Liu, T. 2020, arXiv e-prints, arXiv:2002.10478. https://arxiv.org/abs/2002.10478
- Guidorzi et al. (2020) Guidorzi, C., Marongiu, M., Martone, R., et al. 2020, arXiv e-prints, arXiv:2003.10889. https://arxiv.org/abs/2003.10889
- Hankins & Eilek (2007) Hankins, T. H., & Eilek, J. A. 2007, ApJ, 670, 693, doi: 10.1086/522362
- Hankins et al. (2003) Hankins, T. H., Kern, J. S., Weatherall, J. C., & Eilek, J. A. 2003, Nature, 422, 141, doi: 10.1038/nature01477
- Hessels et al. (2019) Hessels, J. W. T., Spitler, L. G., Seymour, A. D., et al. 2019, ApJ, 876, L23, doi: 10.3847/2041-8213/ab13ae
- Hotan et al. (2004) Hotan, A. W., van Straten, W., & Manchester, R. N. 2004, PASA, 21, 302, doi: 10.1071/AS04022
- Houben et al. (2019) Houben, L. J. M., Spitler, L. G., ter Veen, S., et al. 2019, A&A, 623, A42, doi: 10.1051/0004-6361/201833875
- Hurley et al. (2005) Hurley, K., Boggs, S. E., Smith, D. M., et al. 2005, Nature, 434, 1098, doi: 10.1038/nature03519
- Ioka & Zhang (2020) Ioka, K., & Zhang, B. 2020, arXiv e-prints, arXiv:2002.08297. https://arxiv.org/abs/2002.08297
- Israel et al. (2008) Israel, G. L., Romano, P., Mangano, V., et al. 2008, ApJ, 685, 1114, doi: 10.1086/590486
- Josephy et al. (2019) Josephy, A., Chawla, P., Fonseca, E., et al. 2019, ApJ, 882, L18, doi: 10.3847/2041-8213/ab2c00
- Karastergiou et al. (2015) Karastergiou, A., Chennamangalam, J., Armour, W., et al. 2015, MNRAS, 452, 1254, doi: 10.1093/mnras/stv1306
- Karuppusamy et al. (2020) Karuppusamy, R., Desvignes, G., Kramer, M., et al. 2020, The Astronomer’s Telegram, 13553, 1
- Katz (2020) Katz, J. I. 2020, MNRAS, 494, L64, doi: 10.1093/mnrasl/slaa038
- Levin et al. (2020) Levin, Y., Beloborodov, A. M., & Bransgrove, A. 2020, arXiv e-prints, arXiv:2002.04595. https://arxiv.org/abs/2002.04595
- Locatelli et al. (2020) Locatelli, N. T., Bernardi, G., Bianchi, G., et al. 2020, arXiv e-prints, arXiv:2003.04317. https://arxiv.org/abs/2003.04317
- Lorimer (2011) Lorimer, D. R. 2011, SIGPROC: Pulsar Signal Processing Programs. http://ascl.net/1107.016
- Lorimer & Kramer (2004) Lorimer, D. R., & Kramer, M. 2004, Handbook of Pulsar Astronomy (Cambridge, UK: Cambridge University Press)
- Lyutikov et al. (2020) Lyutikov, M., Barkov, M., & Giannios, D. 2020, arXiv e-prints, arXiv:2002.01920. https://arxiv.org/abs/2002.01920
- Lyutikov et al. (2016) Lyutikov, M., Burzawa, L., & Popov, S. B. 2016, MNRAS, 462, 941, doi: 10.1093/mnras/stw1669
- Marcote et al. (2017) Marcote, B., Paragi, Z., Hessels, J. W. T., et al. 2017, ApJ, 834, L8, doi: 10.3847/2041-8213/834/2/L8
- Marcote et al. (2020) Marcote, B., Nimmo, K., Hessels, J. W. T., et al. 2020, Nature, 577, 190, doi: 10.1038/s41586-019-1866-z
- Margalit & Metzger (2018) Margalit, B., & Metzger, B. D. 2018, ApJ, 868, L4, doi: 10.3847/2041-8213/aaedad
- Meddi et al. (2012) Meddi, F., Ambrosino, F., Nesci, R., et al. 2012, PASP, 124, 448, doi: 10.1086/665925
- Mereghetti et al. (2020) Mereghetti, S., Savchenko, V., Gotz, D., et al. 2020, GRB Coordinates Network, 27668, 1
- Michilli et al. (2018) Michilli, D., Seymour, A., Hessels, J. W. T., et al. 2018, Nature, 553, 182, doi: 10.1038/nature25149
- Mickaliger et al. (2012) Mickaliger, M. B., McLaughlin, M. A., Lorimer, D. R., et al. 2012, ApJ, 760, 64, doi: 10.1088/0004-637X/760/1/64
- Naletto et al. (2009) Naletto, G., Barbieri, C., Occhipinti, T., et al. 2009, A&A, 508, 531, doi: 10.1051/0004-6361/200912862
- Naletto et al. (2013) Naletto, G., Barbieri, C., Verroi, E., et al. 2013, Society of Photo-Optical Instrumentation Engineers (SPIE) Conference Series, Vol. 8875, Aqueye Plus: a very fast single photon counter for astronomical photometry to quantum limits equipped with an Optical Vortex coronagraph, 88750D, doi: 10.1117/12.2022571
- Palmer (2020) Palmer, D. M. 2020, The Astronomer’s Telegram, 13675, 1
- Palmer et al. (2005) Palmer, D. M., Barthelmy, S., Gehrels, N., et al. 2005, Nature, 434, 1107, doi: 10.1038/nature03525
- Papitto et al. (2019) Papitto, A., Ambrosino, F., Stella, L., et al. 2019, ApJ, 882, 104, doi: 10.3847/1538-4357/ab2fdf
- Piro (2016) Piro, A. L. 2016, ApJ, 824, L32, doi: 10.3847/2041-8205/824/2/L32
- Platts et al. (2019) Platts, E., Weltman, A., Walters, A., et al. 2019, Phys. Rep., 821, 1, doi: 10.1016/j.physrep.2019.06.003
- Prandoni et al. (2017) Prandoni, I., Murgia, M., Tarchi, A., et al. 2017, A&A, 608, A40, doi: 10.1051/0004-6361/201630243
- Rajwade et al. (2020a) Rajwade, K. M., Mickaliger, M. B., Stappers, B. W., et al. 2020a, MNRAS, 493, 4418, doi: 10.1093/mnras/staa616
- Rajwade et al. (2020b) —. 2020b, arXiv e-prints, arXiv:2003.03596. https://arxiv.org/abs/2003.03596
- Ravi & Loeb (2019) Ravi, V., & Loeb, A. 2019, ApJ, 874, 72, doi: 10.3847/1538-4357/ab0748
- Rea et al. (2008) Rea, N., Zane, S., Turolla, R., Lyutikov, M., & Götz, D. 2008, ApJ, 686, 1245, doi: 10.1086/591264
- Reich & Reich (1988) Reich, P., & Reich, W. 1988, A&AS, 74, 7
- Ridnaia et al. (2020) Ridnaia, A., Golenetskii, S., Aptekar, R., et al. 2020, The Astronomer’s Telegram, 13688, 1
- Scholz & Chime/Frb Collaboration (2020) Scholz, P., & Chime/Frb Collaboration. 2020, The Astronomer’s Telegram, 13681, 1
- Scholz et al. (2020) Scholz, P., Cook, A., Cruces, M., et al. 2020, arXiv e-prints, arXiv:2004.06082. https://arxiv.org/abs/2004.06082
- Sokolowski et al. (2018) Sokolowski, M., Bhat, N. D. R., Macquart, J. P., et al. 2018, ApJ, 867, L12, doi: 10.3847/2041-8213/aae58d
- Spitler et al. (2014) Spitler, L. G., Cordes, J. M., Hessels, J. W. T., et al. 2014, ApJ, 790, 101, doi: 10.1088/0004-637X/790/2/101
- Spitler et al. (2016) Spitler, L. G., Scholz, P., Hessels, J. W. T., et al. 2016, Nature, 531, 202, doi: 10.1038/nature17168
- Stappers et al. (2011) Stappers, B. W., Hessels, J. W. T., Alexov, A., et al. 2011, A&A, 530, A80, doi: 10.1051/0004-6361/201116681
- Tavani (2019) Tavani, M. 2019, Rendiconti Lincei. Scienze Fisiche e Naturali, 14, doi: 10.1007/s12210-019-00829-1
- Tavani et al. (2009) Tavani, M., Barbiellini, G., Argan, A., et al. 2009, A&A, 502, 995, doi: 10.1051/0004-6361/200810527
- Tavani et al. (2020a) Tavani, M., Verrecchia, F., Casentini, C., et al. 2020a, ApJ, 893, L42, doi: 10.3847/2041-8213/ab86b1
- Tavani et al. (2020b) Tavani, M., Ursi, A., Verrecchia, F., et al. 2020b, The Astronomer’s Telegram, 13686, 1
- Tendulkar et al. (2017) Tendulkar, S. P., Bassa, C. G., Cordes, J. M., et al. 2017, ApJ, 834, L7, doi: 10.3847/2041-8213/834/2/L7
- Tingay et al. (2015) Tingay, S. J., Trott, C. M., Wayth, R. B., et al. 2015, AJ, 150, 199, doi: 10.1088/0004-6256/150/6/199
- Turolla et al. (2015) Turolla, R., Zane, S., & Watts, A. L. 2015, Reports on Progress in Physics, 78, 116901, doi: 10.1088/0034-4885/78/11/116901
- Ursi et al. (2019) Ursi, A., Tavani, M., Verrecchia, F., et al. 2019, ApJ, 871, 27, doi: 10.3847/1538-4357/aaf28f
- Valente et al. (2010) Valente, G., Pisanu, T., Bolli, P., et al. 2010, Society of Photo-Optical Instrumentation Engineers (SPIE) Conference Series, Vol. 7741, The dual-band LP feed system for the Sardinia Radio Telescope prime focus, 774126, doi: 10.1117/12.857306
- van Haarlem et al. (2013) van Haarlem, M. P., Wise, M. W., Gunst, A. W., et al. 2013, A&A, 556, A2, doi: 10.1051/0004-6361/201220873
- van Straten & Bailes (2011) van Straten, W., & Bailes, M. 2011, PASA, 28, 1, doi: 10.1071/AS10021
- Yang & Zou (2020) Yang, H., & Zou, Y.-C. 2020, arXiv e-prints, arXiv:2002.02553. https://arxiv.org/abs/2002.02553
- Zampieri et al. (2015) Zampieri, L., Naletto, G., Barbieri, C., et al. 2015, Society of Photo-Optical Instrumentation Engineers (SPIE) Conference Series, Vol. 9504, Aqueye+: a new ultrafast single photon counter for optical high time resolution astrophysics, 95040C, doi: 10.1117/12.2179547
- Zampieri et al. (2019) —. 2019, Contributions of the Astronomical Observatory Skalnate Pleso, 49, 85. https://arxiv.org/abs/1908.03396
- Zanazzi & Lai (2020) Zanazzi, J. J., & Lai, D. 2020, arXiv e-prints, arXiv:2002.05752. https://arxiv.org/abs/2002.05752
- Zhang et al. (2020a) Zhang, C. F., Jiang, J. C., Men, Y. P., et al. 2020a, The Astronomer’s Telegram, 13699, 1
- Zhang et al. (2020b) Zhang, S. N., Tuo, Y. L., Xiong, S. L., et al. 2020b, The Astronomer’s Telegram, 13687, 1