Dichotomy of radio loud and radio quiet quasars in four dimensional eigenvector one (4DE1) parameter space 111Based on observations obtained at the CAHA Observatory, Calar Alto, Spain
Abstract
Recent work has shown that it is possible to systematize quasars (QSOs) spectral diversity in 4DE1 parameter space. The spectra contained in most of the surveys have low signal to noise ratio which fed the impression that all QSO’s are spectroscopically similar. Exploration of 4DE1 parameter space gave rise to the concept of two populations of QSOs that present important spectroscopic differences. We aim to quantify broad emission line differences between radio quiet and radio loud sources by exploiting more complete samples of QSO with spectral coverage in H, MgII and CIV emission lines. We used a high redshift sample (0.35 z 1) of strong radio emitter QSOs observations from Calar Alto Observatory in Spain.
keywords:
Active galaxies, quasars, radio loud and radio quiet quasars, four dimensional eigenvecter 1 parameter spaceS. H. Negu, & S. B. Tessema, eds.
1 Introduction
Over fifty years after their discovery, people are beginning to see progress in both defining and contextualizing the properties of QSOs, some of the brightest AGNs ([Sulenticetal.2007, Sulentic et al. 2007]). Bright type-1 AGNs show widely differing line profiles, intensity ratios and ionization levels (Marziani et al. 2018).
A much debated problem in AGN studies involves the possibility of a real physical dichotomy between radio loud (RL) and radio quiet (RQ) QSOs (Zamfir et al. 2008). Another complication is introduced by the fact that some good fraction of RQ sources share common properties with the RL QSOs as discussed in Zamfir et al. (2008). For instance, about 30 - 40 % of RQ QSOs are spectroscopically similar to RL (Sulentic et al. 2000) and with the improvement of radio interferometry techniques, it was possible to notice that both QSO types are capable of producing radio jets (Chiaberge, Marconi 2011).
The other which remains a perplexing question 50 years after the discovery of QSO is the origin of radio loudness (Ruff, 2012). From the theoretical point of view, in spite of the great advancement in the ability of collecting unbiased sets of data, most of the researchers argued, the origin of the relativistic radio jets in AGNs as an open question.
A first contextualization, RQ vs. RL (Sulentic et al. 1995, Corbin 1997) showed intriguing spectroscopic differences between the two types of QSOs with large blue shifts observed in the emission line profiles only among RQ sources.
Recent work has shown that it is possible to systematize quasar spectral diversity in a space called 4DE1 parameter space (see Marziani et al. 2018 and references therein). As stated in Zamfir et al. (2008), the value of studying the RL phenomenon within the 4DE1 context is at least two fold: (i) the approach compares RL and RQ sources in a parameter space defined by measures with no obvious dependence on the radio properties (Marziani et al. 2003b), (ii) it allows to make predictions about the probability of radio loudness for any population of QSOs with specific optical (UV) spectroscopic properties. As the RQ/RL separation in 4DE1 is not complete (Zamfir et al. 2008), many open questions are present after 50+ years of study of QSOs.
Therefore, this work studies the properties of RL and RQ QSOs by using the 4DE1 parameter space. We specifically consider a possible dichotomy between them, and the reason behind observed low fractions of RL.
2 Data
The work focus on type 1 QSOs, as they can be unambiguously identified based on the presence of a broad component in the hydrogen Balmer emission lines (mainly in H), the doublet of MgII2800, or in High Ionization Lines (HILs) like CIV1549 in the UV. The best clues to study the RQ/RL dichotomy in QSOs lies in the optical/UV spectra and many of the brightest RL QSOs with radio coverage have no published optical spectra with S/N high enough to permit a detailed study. Data from astronomical archives were supplemented with new data obtained at the Observatory of Calar Alto in Spain. Regarding the new data, a sample of 50 strongly-RL QSOs were obtained by using the TWIN spectrograph attached at the 3.5m telescope of the Calar Alto Observatory. The TWIN spectrograph has two arms that allows to obtain (1) near UV spectra for studying the region of the MgII2800 doublet, and (2) the H-FeII region for the QSOs in the redshift range (0.35 z 1).
Radio images and the fluxes at radio continuum were obtained from the VLA Faint Images of the Radio Sky at Twenty-Centimeters (FIRST) survey and from the NVSS survey for those QSOs with no available FIRST radio measurements. This information is fundamental to identify QSOs according to their morphology at radio frequencies and to determine the power of radio emission.
The Kellermann factor which is a value defined by the ratio between radio/optical flux density was used as a discriminant between RQ and RL. High S/N spectra with H, CIV1549 and MgII2800 coverage were considered.
3 Data analysis and preliminary results
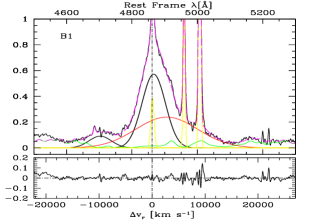
Analyzing the broad lines by doing multicomponent non-linear fitting of broad emission lines in particular of H, FeII, MgII and the UV lines of CIV and HeII allows us to quantify the properties and kinematics of the broad line region, to detect very broad components (observed only in population B of QSOs within the 4DE1 scheme) as well as to calculate fundamental quantities such as the mass of the super massive black hole (SMBH) and the Eddington ratio . In order to get spectra suitable for scientific use, we used a standard spectroscopic data reduction by using IRAF astronomical package which produces a spectrum as shown in Figure 1 left for one of our source, S51856+73 at z = 0.46 which incorporates most of the emission lines.
The optical (H-FeII) and UV (MgII) analysis mainly focus on the spectral fitting of emission lines using the SPECFIT routine in the IRAF package. The result of the SPECFIT for H emission line for S51856+73 is shown in Figure 1 right.
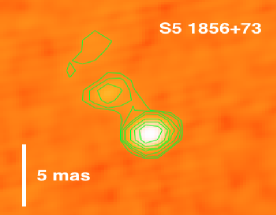
In radio, we searched the VLBA radio map and the NVSS contour map as shown in Figure 2 for S51856+73 which can be taken as an indication of very different morphologies in radio. The analysis of the connection between the optical/UV and radio measurements will be presented in a forthcoming paper.


Acknowledgment
AdO acknowledges financial support from Spanish grants AYA2016-76682-C3-1-P and SEV-2017-0709. We also acknowledge ESSTI and Jimma University for their support.
References
- [Chiaberge, Marconi(2011)] Chiaberge, M., Marconi, A. 2011, MNRAS, 416, 917
- [Corbin(1997)] Corbin, M. R., 1997, ApJS, 113, 245
- [Marziani et al.(2018)] Marziani, P., et al., 2018, Frontiers in A&SS, 5, 6
- [Marziani et al.(2003)] Marziani, P., et al., 2003, ApJS, 145, 199
- [Ruff, A. J. (2012)] Ruff, A. J., 2012, PhDT, 314T
- [Sulentic et al.(1995)] Sulentic, J. W., et al., 1995, ApJL, 445, L85
- [Sulentic et al.(2000)] Sulentic, J. W., et al., 2000, ApJL, 536, L5
- [Sulentic et al.(2007)] Sulentic, J. W., et al., 2007, ApJL, 666, 757
- [Taylor et al.(1996)] Taylor, G. B., et al., 1996, ApJS, 107, 37
- [Zamfir et al.(2008)] Zamfir, S., Sulentic, J. W., Marziani, P. 2008, MNRAS, 387, 856