A vignetting advantage for thin-film filter arrays in hyperspectral cameras
Abstract
Vignetting in camera lenses is generally seen as something to avoid. For spectral cameras with thin-film interference filters, however, we argue that vignetting can be an advantage. When illuminated by focused light, the bandwidth of interference filters increases with the chief-ray angle, causing position-dependent smoothing of the spectra. We show that vignetting can be used to reduce smoothing and preserve important spectral features. Furthermore, we demonstrate that by adding additional vignetting to a lens, measurements can be made more consistent across the scene. This makes vignetting a useful parameter during spectral camera design.
1 Introduction
Spectral cameras simultaneously measure spectral and spatial information. The integration of thin-film interference filters on commercially available image sensors enabled very compact and lightweight spectral imaging technology [1].
A concern with the integrated thin-film filters is that their transmittance spectrum depends on the angle of incidence. The larger the incidence angle, the more the central wavelength shifts [2]. Therefore, when a filter is illuminated by an aperture, the contributions of all the incidence angles in the light beam need to be added together. This increases the bandwidth (Full Width at Half Maximum) of the filters and therefore has a position-dependent smoothing effect on the measured spectrum. This could be problematic for classification or in applications where localized features of the spectrum are used to quantify material properties (e.g. vegetation indices [3]).
For conventional lenses, the larger the object field angle, the larger the image side chief-ray angle, creating additional shift and smoothing. To avoid this, telecentric lenses could be used. These lenses, however, strongly limit the available options for camera design and are typically more expensive. It would therefore be very useful to be able to use commercially available non-telecentric lenses.
In our previous work we showed that changes in central wavelength can be easily corrected in software [4, 5]. Smoothing of the spectra, however, cannot be simply reversed in software. In this work we show the smoothing can be controlled by selecting or designing lenses with optical and mechanical vignetting [5].
The key insight is that vignetting cuts off part of the light beam (Fig. 1). This can help to control the distribution of incidence angles and thus control the smoothing. In this article we thus argue that having a lens with vignetting can be advantageous. This new insight enables many more lenses to be seriously considered for use in spectral cameras. We also suggest that it might be worthwhile to design a lens with deliberate vignetting in mind.
We expect our work to be relevant for any system where angle-sensitive filters are illuminated by a lens. Examples include linear variable filters [6, 7, 8], Fabry-Pérot filters, thin-film filters [1], liquid crystal tunable filters [9].
In Section 2, we introduce the basic theory to model vignetting. In Section 3, we show how vignetting can be an advantage in lens selection and how adding additional vignetting can improve spectral resolution.


2 Vignetted-aperture theory
Vignetting is the variation of intensity that remains in the image even when the scene is spatially uniform. The decrease in intensity is caused by the light beam being physically cut off in the lens. This happens because of the limited size of a diaphragm, lens or lens hood. There are other forms of vignetting which are discussed in [5] but will not be considered here.
This cutting off of the light beam changes the distribution of incidence angles and therefore also the shape of the transmittance spectrum. In [5], we showed that the distribution of angles can be modeled using circle-circle intersections (Fig. 1(b)). Here, part of the exit pupil is cut off by another circle. While this model works, no physical interpretation was offered that allows to find the model parameters from a given lens design. Therefore, an important contribution of this letter is that, given the lens design, we provide a physically meaningful approach to model the effect of vignetting.
To make the model physically meaningful, we consider the projection of each lens component into the image space of the lens. Evidently, each such image will have a certain radius and position. The exit pupil is the image of the component that most limits the solid angle of the focused light at zero chief ray angle. The second most limiting aperture we call the vignetting pupil (Fig. 1). By construction, each pupil represents a limitation on the rays that can pass through a lens; Thus, only light rays seemingly coming from both the exit pupil and the vignetting pupil can occur. Thus, for increasing chief-ray angles, vignetting happens because the vignetting pupil starts to limit the available light rays (Fig. 1(b)).
3 Vignetting as an advantage
3.1 Removing vignetting
In this section we demonstrate that removing the vignetting of an existing lens can have an important position-dependent smoothing effect. We make use of the Edmund Optics C Series 16 mm lens at . This lens has significant vignetting at this f-number and this was described and modeled in [5]. Here, we will use the same methods to simulate the effect of vignetting.
We simulated the measurement of the transmittance of a Thorlabs FGB67S Colored Glass Bandpass filter. The transmittance is obtained using a flat-fielding approach such that each element is calculated as
| (1) |
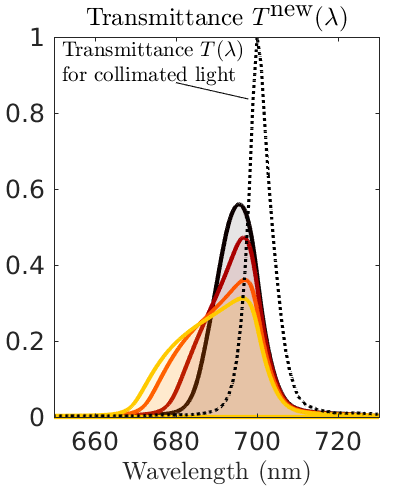
Here is the source spectrum, the transmittance of the colored glass and is the transmittance of a filter on the pixel array with index . The calculation of the correct filter response is briefly discussed in Appendix C. The measured transmittance is then compared for different chief ray angles (i.e. positions in the scene) and is corrected for the shift in central wavelength (See Appendix C).
When we simulate this, but with vignetting removed, the resolution of the measured spectrum severely deteriorates (Fig. 2(a)). A lens should therefore not be discarded just because it has some vignetting. Vignetting should rather be seen as a design parameter that can be taken into account when selecting or designing a lens for a thin-film spectral camera.
Fig. 2(a) also shows the simulated response for collimated since this effect will be more severe for any converging beam. It is used as a reference since this is the minimal smoothing than can be obtained using vignetting.


3.2 Engineered vignetting
In this section we demonstrate that vignetting can be added to an existing lens to control the spectral smoothing at different positions. This experiment is meant as a proof-of-concept that vignetting can be kept in mind when designing lenses for spectral imaging.
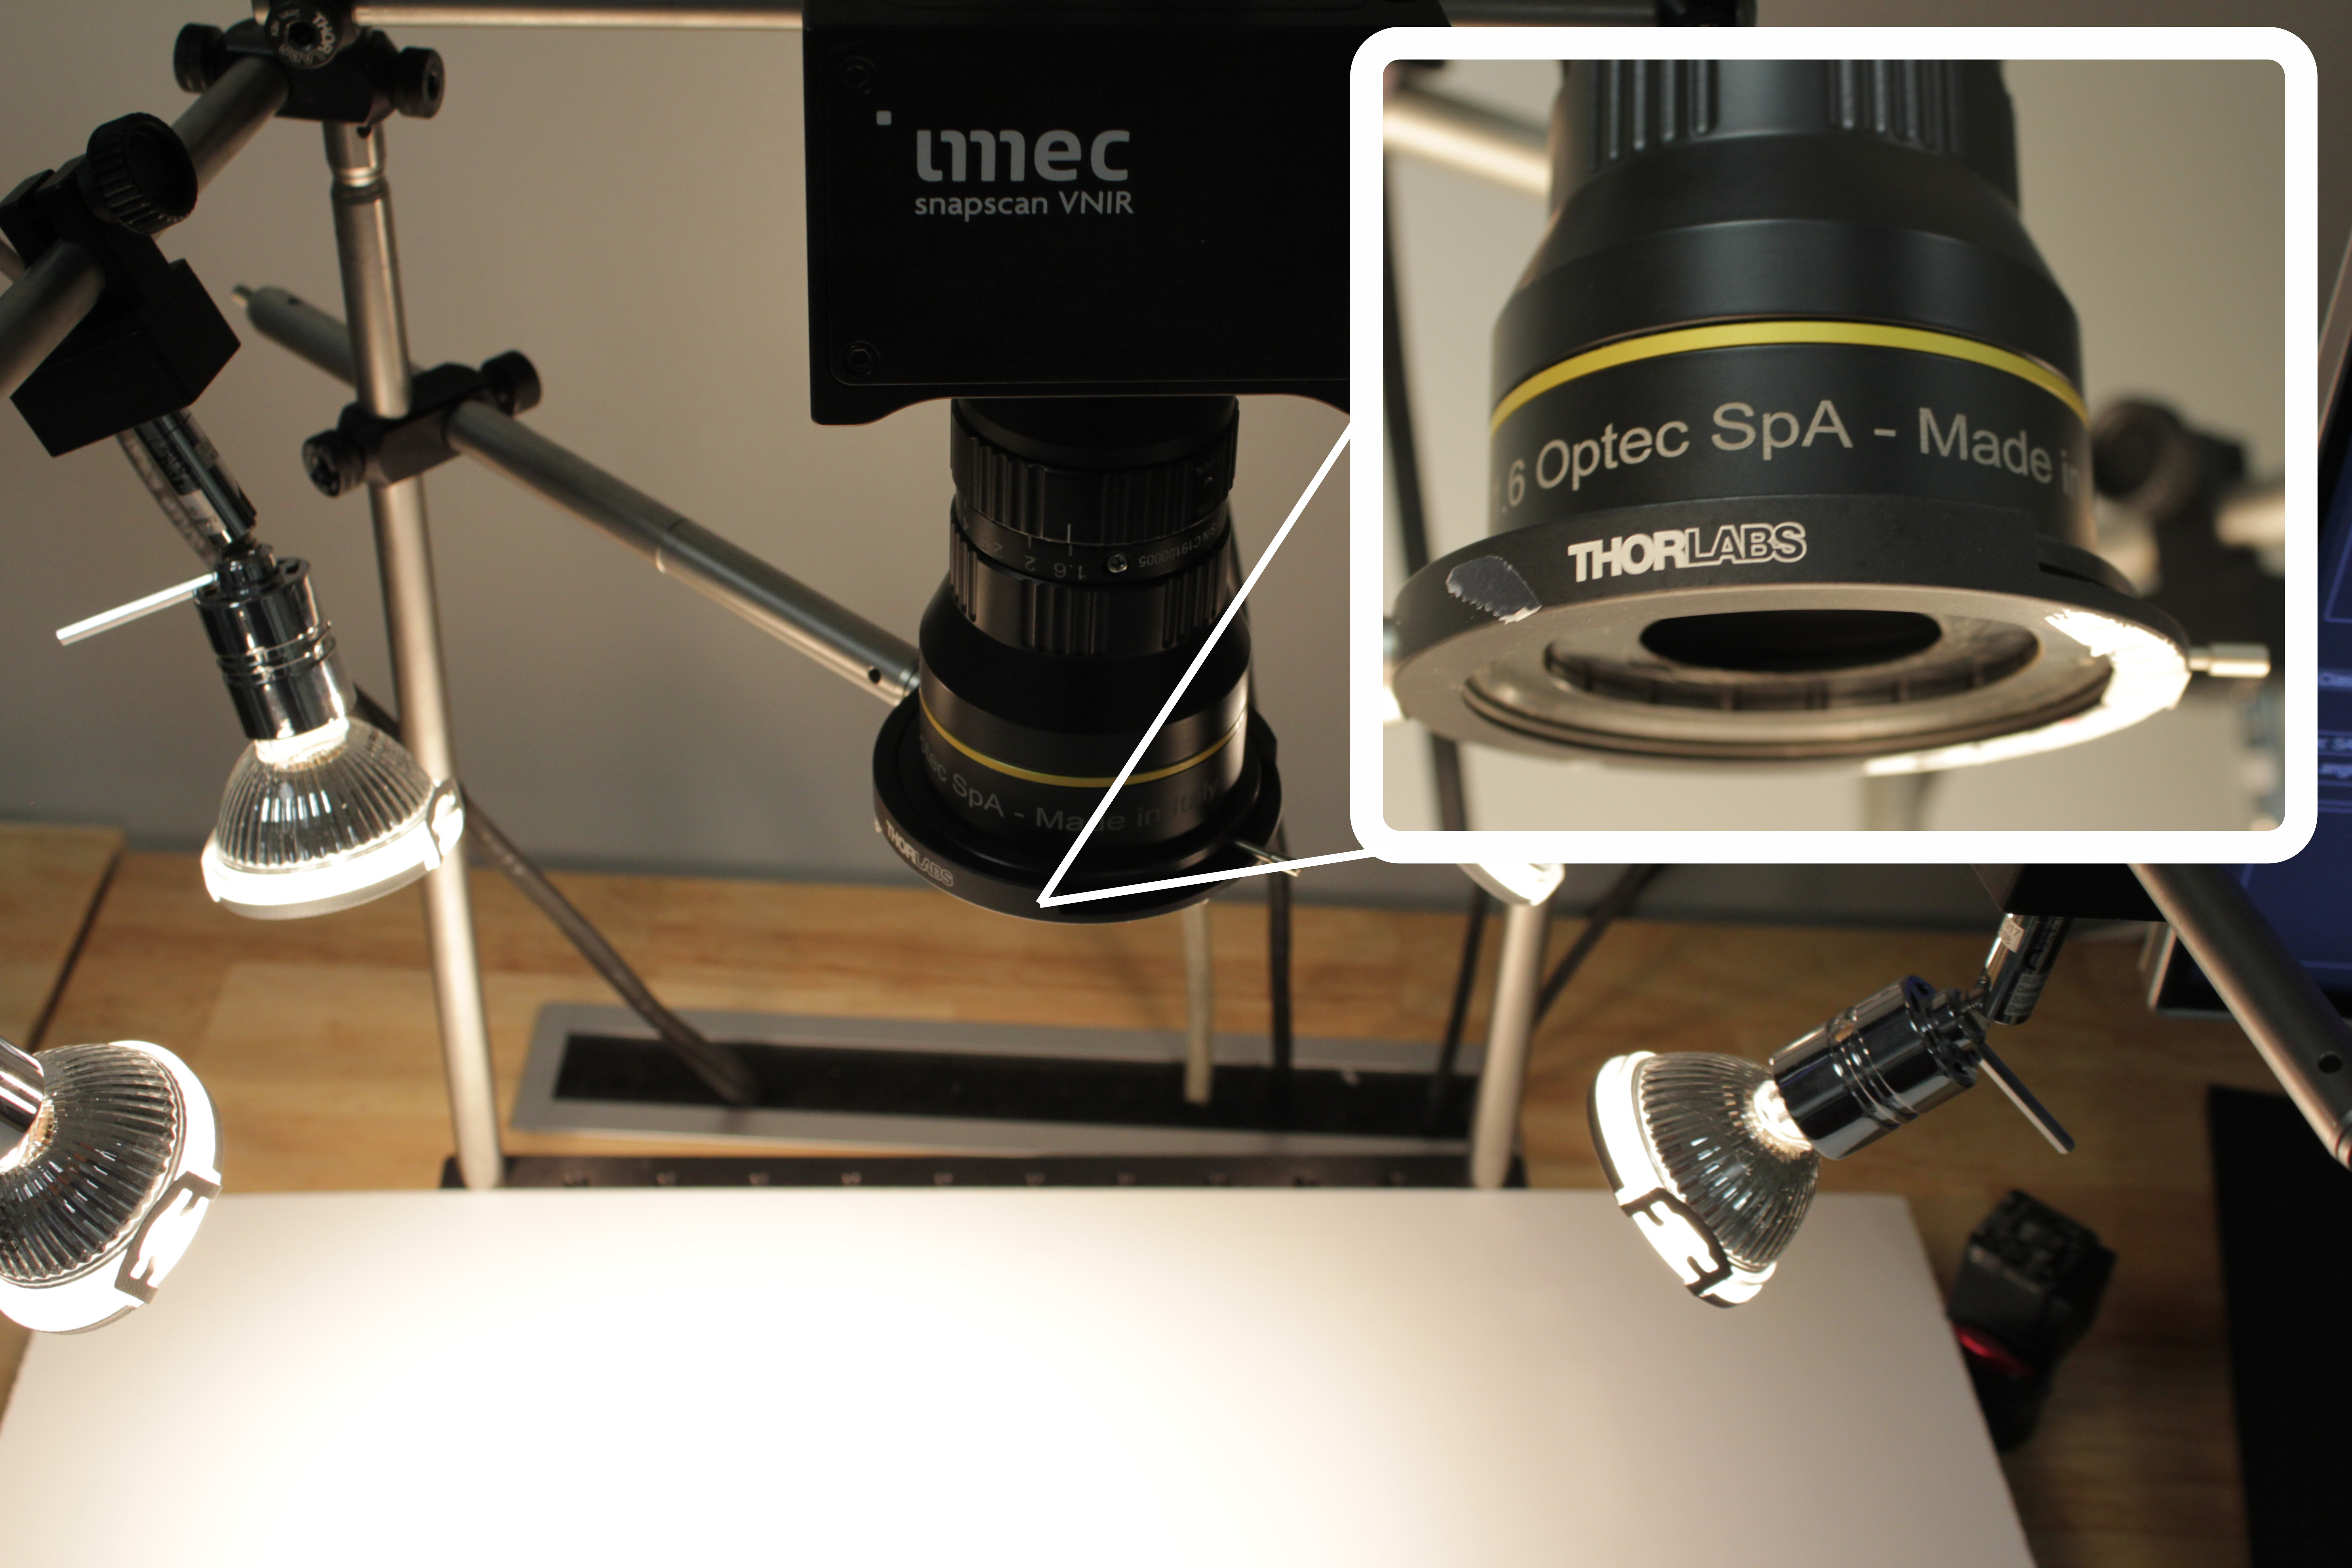
Without loss of generality, we found no lens with the same f-number, focal length, no vignetting and a comparable exit pupil distance as the Edmund Optics lens from the previous section. Nevertheless, we found a high quality lens (Optec OB-V-SWIR 16mm C1326) that has no vignetting, thus making it suitable for this experiment. The exit pupil distance is 39.37 mm (instead of 21 mm). This implies smaller chief ray angles, and therefore already less smoothing.
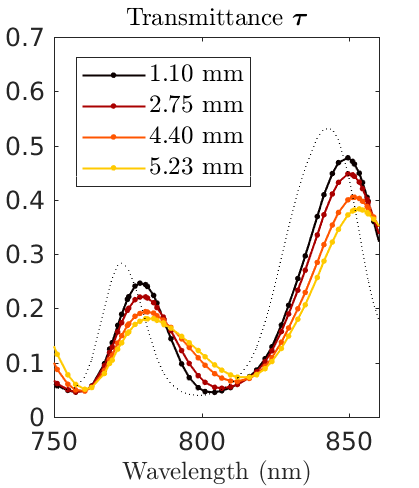
In this experiment we measure the transmittance spectrum of the Thorlabs FGB67S Colored Glass Bandpass filter using imec’s Snapscan VNIR camera [10]. Analogous to the simulation, the measured spectra are compared for several positions in the scene. The experiment is then repeated with a 30 mm wide circular aperture placed in front of the lens (Fig. 3).
By adding the chosen aperture, the shape of the spectrum becomes more consistent for different positions in the scene (Fig. 4). The effect is smaller than the simulation of Fig. 2 due to the longer exit pupil distance which implies smaller chief-ray angles.


To compare the effect of different apertures, the variation of the Full Width at Half Maximum (FWHM) of the filters can be simulated (Fig. 5). This is done by calculating the filter transmittance and its FWHM for each position in the scene (Appendix C). The optimal choice of the aperture dimensions can then be made according to some chosen criterion. Sometimes one might want to minimize the FWHM as much as possible. In other cases, one might prefer a more constant FWHM for the given field of view. For example, because the FWHM at mm is slightly smaller than the FWHM at 1.1 mm (Fig. 5), the smoothing at 5.23 mm is reversed slightly more. This explain why the this measurement has a slightly higher peak value in Fig. 4(b). The smallest FWHM that can be achieved is the FWHM of the filter measured with collimated light.

3.3 Trade-off with signal-to-noise ratio
We have shown that vignetting can be an advantage for spectral imaging. The trade-off is that light is being cut-off which decreases the signal-to-noise (SNR) ratio and increases the spatial non-uniformity of the light in the image.
The decrease in SNR can be modeled by calculating the area of the vignetted exit pupil using circle-circle intersections (Fig. 1(b)). The area changes discontinuously when the vignetting pupil abruptly starts cutting. The predicted vignetting slightly misses the onset point of vignetting (Fig. 6). This difference can be explained by a 1 to 2 mm measurement error on the aperture dimensions, which is realistic for the given setup. More accurate calibration can be obtained using the method from [5].
The exact trade-off will depend on the application requirements, the system and the available illumination in the setup.

4 Conclusion
We have shown that vignetting is an important design parameter for spectral cameras with (thin-film) interference filters. When selecting the camera/lens combination to match application requirements, one should consider how vignetting can help influence the smoothing of spectrum. A trade-off must then be made with the loss in signal-to-noise ratio. The optimal design parameters can be explored using simulation.
It is also possible to engineer vignetting by either adding an aperture to an existing lens or design a lens from scratch. The vignetting may be engineered to minimize smoothing but also to make the measured spectra of identical samples more consistent across the scene.
5 Acknowledgements
We would like to thank Massimiliano Musazzi and Optec spa for their kind assistance in providing the lens and the necessary design parameters. We also thank Prof. Claude Amra and Ruben Van De Vijver for the helpful discussions.
6 Disclosures
The authors declare no conflict of interest.
Appendix
In these appendices we discuss how to calculate the effect of adding an additional aperture in front of an existing lens. The steps will be to calculate the position of its image (the vignetting pupil) and use that to calculate the model parameters of the circle-circle intersection model so that the theory from [5] can be applied for simulation and shift correction.
Appendix A Calculating the dimensions of the vignetting pupil
Let us place an aperture of radius on the object side of the lens. Its position is measured from the front focal plane. If the front focal plane is positioned within the lens, will always be negative by construction. The positions of focal planes can usually be found in a datasheet or lens design file [11].
We calculate the position and radius of the image of this aperture using the Newtonian equations [12]. As is measured from the rear focal plane it follows that
| (2) |
where is the effective focal length.
The radius of the vignetting pupil is then found to be
| (3) |
Let us define as the the position of the rear focal plane as measured from the image plane. The position of the vignetting pupil, as measured from the image plane then becomes (Fig. 7).
In the experiment shown in Fig. 3, the following values were calculated using the lens design files provided by the manufacturer and the dimensions of the aperture: , , , and thus .

Appendix B Transforming to the circle-intersection model
The circle-intersection model from [5] describes how vignetting occurs by the exit pupil being partially cut off by another circle (Fig. 1(b)). Two model parameters are required: The radius of the circle that cuts off part of the exit pupil, and a sensitivity parameter which is defined such that the position of the circle behaves as
| (4) |
The chief ray angle is defined as with being the distance to the exit pupil (Fig. 7).
As discussed earlier, the circle-intersection model is related to the vignetting pupil by a projection (Fig. 1(b) and 7). Therefore, using elementary geometry, the radius of the projected circle can be found to be
| (5) |
and its position
| (6) |
such that . The absolute value takes into account that can, in principle, be negative.
For the experiment in Fig. 3, we calculated that mm and mm.
Appendix C Simulating the circle-intersection model
This section briefly summarizes the key aspects on how the circle-intersection model can be applied. For a detailed analysis, we refer to [5].
Let be the transmittance of a filter illuminated with collimated light at normal incidence. When such a filter is irradiated by focused light, its effective transmittance will be a shifted and smoothed version of (Fig. 8(a)).


In [4, 5], this is modeled by a convolution operation on such that
| (7) |
The kernel encodes the change in central wavelength and bandwidth for a given distribution of incidence angles. A closed-form formula for can be found in [5], but will not be further discussed here. It suffices to know that for a lens with vignetting, this kernel is completely defined by four parameters: the radius and position of the exit pupil, and the radius and horizontal position of the vignetting circle that intersects the exit pupil (Fig. 7).
The spectra are displayed by plotting each response at its correspending central wavelength. These central wavelengths were determined for collimated light at normal incidence. Because the actual central wavelengths are shifted, the measured spectra will also be shifted (Fig. 8(b)). These shifts can be corrected by updating the wavelength at which each filter response is plotted such that
| (8) |
where the shift is calculated as the mean value of the kernel. This approach is used in [4, 5] and further justified in the discussion of [13].
References
- [1] N. Tack, A. Lambrechts, P. Soussan, and L. Haspeslagh, “A compact, high-speed, and low-cost hyperspectral imager,” \JournalTitleProc. SPIE 8266, Silicon Photonics VII 32, 82660Q (2012).
- [2] H. A. Macleod, Thin-Film Optical Filters, Fifth Edition (CRC press, 2017).
- [3] C. Wu, Z. Niu, Q. Tang, and W. Huang, “Estimating chlorophyll content from hyperspectral vegetation indices: Modeling and validation,” \JournalTitleAgricultural and Forest Meteorology 148, 1230–1241 (2008).
- [4] T. Goossens, B. Geelen, J. Pichette, A. Lambrechts, and C. Van Hoof, “Finite aperture correction for spectral cameras with integrated thin-film Fabry-Perot filters,” \JournalTitleAppl. Opt. 57, 7539–7549 (2018).
- [5] T. Goossens, B. Geelen, A. Lambrechts, and C. Van Hoof, “Vignetted-aperture correction for spectral cameras with integrated thin-film Fabry–Perot filters,” \JournalTitleApplied Optics 58, 1789 (2019).
- [6] T. Mu, F. Han, D. Bao, C. Zhang, and R. Liang, “Compact snapshot optically replicating and remapping imaging spectrometer (ORRIS) using a focal plane continuous variable filter,” \JournalTitleOptics Letters 44, 1281 (2019).
- [7] I. G. E. Renhorn, D. Bergström, J. Hedborg, D. Letalick, and S. Möller, “High spatial resolution hyperspectral camera based on a linear variable filter,” \JournalTitleOptical Engineering 55, 114105 (2016).
- [8] I. G. E. Renhorn and L. Axelsson, “High spatial resolution hyperspectral camera based on exponentially variable filter,” \JournalTitleOptical Engineering 58, 103106 (2019).
- [9] C. Stoltzfus, R. Barbour, D. Atherton, and Z. Barber, “Micro-sized tunable liquid crystal optical filters,” \JournalTitleOptics Letters 42, 2090 (2017).
- [10] J. Pichette, W. Charle, and A. Lambrechts, “Fast and compact internal scanning CMOS-based hyperspectral camera: the Snapscan,” \JournalTitleProc. SPIE 10110, 1011014 (2017).
- [11] Optec S.p.a, “Apochromatic Lens OB V-SWIR 16/1.6,”, http://ir.optec.eu/pdf/C1326.pdf.
- [12] J. E. Greivenkamp, Field Guide to Geometrical Optics (SPIE press, 2009).
- [13] T. Goossens and C. Van Hoof, “Thin-film interference filters illuminated by tilted apertures,” \JournalTitleApplied Optics 59, A112 (2020).