Observations of Ray-Like Structures in Large-Scale Coronal Dimmings Produced by Limb CMEs
keywords:
Corona; Coronal Mass Ejections; Solar Wind1 Introduction
S-Introduction
Coronal mass ejections (CMEs) are large-scale manifestations of solar activity, often followed by transient dark regions known as coronal dimmings. Dimmings (“coronal depletions”) were originally identified by Hansen et al. (1974) in white light with the Mauna Loa ground-based coronagraph and by Rust and Hildner (1976) in the soft X-ray Skylab images. These temporal depletions appear as dark areas similar to coronal holes and thus they are sometimes referred to as “transient coronal holes” (Rust, 1983). Sterling and Hudson (1997) investigated a dimming on the solar disc associated with a halo CME, observed by the Soft X-ray Telescope (SXT) onboard Yohkoh. Thompson et al. (1998) considered dimmings as markers of the eruption regions at the solar disc observed by the Extreme-Ultraviolet Imaging Telescope (EIT) onboard the SOlar and Heliospheric Observatory (SOHO) in the 195 Å spectral band. They suggested that the decrease in brightness in the dimming occurs due to a decrease in plasma density as contrasted to the decrease due to change in temperature. This conclusion was later confirmed by Zarro et al. (1999) in observations of a coronal dimming associated with a halo CME by SOHO/EIT simultaneously with Yohkoh/SXT. The appearance of extreme-ultraviolet (EUV) and soft X-ray (SXR) coronal dimmings were interpreted within the framework of a flux rope eruption, partially controlled by the CME. In a spectroscopic study with the Coronal Diagnostic Spectrometer (CDS) on board SOHO, Harrison and Lyons (2000) have found activation of an adjacent prominence and 2 MK “hot spots” under the ascending CME, which may be associated with the CME footpoints. Using the method of differential imaging to observe dimmings in the EUV lines, Chertok and Grechnev (2003) found coincidence of long-lived darkenings on the solar disc in different EUV bands of SOHO/EIT corresponding to coronal temperatures and in the 304 Å transition-region band. However, they found distinctions between images of dimmings in different emission lines, which suggest that the coronal plasma inside the dimmings is variable in temperature. Aschwanden (2005) summarized the results of the dimming investigation in the SOHO era: they are detected a relative deficit of coronal mass or emission measure compared with pre-CME conditions, interpreted as a vacuum-like rarefaction or “evacuation” of the coronal plasma after the launch of a CME. The appearance of coronal dimmings is most dramatically seen on the solar disk, but they are also detectable above the solar limb in favorable cases, when an eruptive active region is located near the limb. Dimmings are regarded as a relevant constituent of the CME evolution and as a probable source of solar wind.
Harrison et al. (2003) were the first to describe the plasma diagnostic characteristics of a set of EUV dimming events on the solar limb associated with CME onsets. They found that the dimming events developed synchronously with the projected CME onset and spatially coincided with the CME origin locations of the associated CMEs. Zhukov and Auchère (2004) investigated several examples of EIT waves, EUV coronal dimming regions and strengthened their link to CMEs. They performed a differential emission measure (DEM) analysis and found that the mass of about 1015 g erupts from the dimming region. It appeared that around 50 % of total CME mass was initially contained in the low corona outside of the “transient coronal holes”.
Bein et al. (2013) and Temmer et al. (2017a) studied a mass evolution in the outer corona for a set of CMEs. They found a distinct mass increase in propagating CMEs produced by mass flow from the corona behind them. Mandrini et al. (2007) analyzed magnetic structure of the dimming regions and proposed the scenario of dimming formation as a combination of core and secondary dimmings originated from reconnection of the surrounding coronal magnetic loops. Vanninathan et al. (2018) applied DEM diagnostics to study the plasma characteristics of coronal-dimming events. They found that secondary dimmings are less deep and have less duration in comparison with the core dimmings. In a recent work, Veronig et al. (2019) studied a coronal dimming caused by a fast halo CME using the Extreme-ultra-violet Imaging Spectrometer (EIS) spectroscopy onboard Hinode and the Atmospheric Imaging Assembly (AIA) onboard the Solar Dynamics Observatory (SDO) DEM analysis. They investigated temporal dynamics of the relative density changes in the core dimming regions and concluded that the CME mass increase in the coronagraphic field of view results from plasma flows from the lower corona derived from the EIS data.
White-light and EUV coronagraphic observations of the solar corona often reveal long-lived, enhanced ray-like structures associated with streamers or pseudo-streamers associated with heliospheric current sheets (see, e.g., Wang et al., 2000; Wang, Sheeley, and Rich, 2007; Slemzin et al., 2008, and references therein). Wang, Sheeley, and Rich (2007) estimated the flow speed from pseudo-streamers to be about 200 km s-1 at heliocentric distances of supporting the prediction (based on their low flux tube divergence rates) that pseudo-streamers are sources of fast solar wind. Crooker, McPherron, and Owens (2014) found that solar-wind flows from pseudo-streamers had similar characteristics to the streamer flows (low speed and proton temperature, high density and composition ratio), however, these characteristics in pseudo-streamers were slightly less pronounced.
Munro and Sime (1985) reported Skylab observations of transient brightenings at the base of pre-existing streamers and ray-like features, which they identified as a special class of coronal transients (CMEs). Ray-like coronal features formed in the aftermath of CMEs were studied by Webb et al. (2003), Bemporad et al. (2006), Vršnak et al. (2009), Ciaravella and Raymond (2008); Ciaravella et al. (2013) as signatures of large-scale current sheets created by magnetic reconnection. Ciaravella et al. (2013) distinguished hot, coronal, and cool rays that appeared in the aftermath of CMEs and found that about 18 % of the white-light rays show very hot gas consistent with the current sheet interpretation, while about 23 % contained cold gas that they attributed to cool prominence material draining back from the CME core. Physical conditions of the CME plasma after eruption, its heating, energy balance, and mass evolution were studied using the Ultra-Violet Coronagraph Spectrometer (UVCS) onboard SOHO and Hinode/EIS spectroscopic data by Bemporad et al. (2007) and Lee et al. (2009). Landi et al. (2010, 2013) explored a hot plasma associated with the CME of 9 April 2008 using the Hinode/EIS and XRT data at a distance .
However, due to the gap between the observational data obtained with coronagraphs at distances exceeding 2 and the data of most EUV telescopes obtained below 1.3 , the phenomena in the corona accompanying CMEs have not been studied in the full range. The launch of the PRoject for OnBoard Autonomy 2 (PROBA2) spacecraft with the Sun Watcher using Active Pixel System Detector and Image Processing (SWAP) wide-field EUV telescope in 2009 made possible systematic studies in the EUV 174 Å band coronal sources of the structures observed at larger distances by white-light coronagraphs. The main advantages of SWAP are a wide field of view (up to 1.7 from the center of the Sun and up to 2.2 in the off-point positions) and very low stray-light permitting EUV observations of the corona at the distances inaccessible for the most of EUV telescopes. Goryaev et al. (2014) studied properties of a streamer in the beginning of Solar Cycle 24 combining the data of PROBA2/SWAP, Hinode/EIS, and Mauna Loa Mk4 instruments. They found that the plasma density in the streamer as a function of height corresponded to scale height temperature higher than the excitation temperature, which suggests the presence of plasma outflow along the streamer. SWAP observations of the active events at the limb disclose large-scale restructuring of the corona; in particular, appearance of dimmings and bright coronal rays accompanying the CME event. Such measurements are important to explore primary solar-wind sources significant for the space-weather applications.
The aim of the current work is to study bright ray-like structures observed by SWAP in the dimming regions and to analyze their properties in the corona and their links to solar wind using the capabilities of the SWAP and SDO/AIA telescopes and special methods of data analysis. We investigated morphology, temporal evolution, and plasma properties of several deep coronal off-disk dimmings observed by SWAP in 2010 – 2017. To study the plasma characteristics of the coronal dimmings, we used DEM analysis based on the multi-wavelength SDO/AIA EUV data. The correspondence of these dimmings to specific solar-wind features was studied using data of the PLAsma and SupraThermal Ion Composition (PLASTIC) instrument onboard the Solar TErrestrial RElations Observatory (STEREO) Ahead (STEREO-A) and Behind (STEREO-B) spacecrafts. The article is organized as follow. Observations of the coronal structures under study by SWAP and other instruments, as well as data processing, are described in Section 2. In Section 3, we describe the DEM analysis of the plasma parameters. Discussion of the results is given in Section 4. Finally, Section 5 presents the summary and conclusions. Electronic Supplementary Material (movies) illustrates development of the ray-like structures in the dimmings in all four events.
2 Observations and Data Processing
Table \irefT-1 lists some of the observational information on the four events with the deepest dimmings taken from the Solar Demon database (Kraaikamp and Verbeeck, 2015; online database solardemon.oma.be/).
| Event | Date | Min. | Start | Peak | End | AR | Position | Flare |
| int.\tabnoteValues of the integrated decrease of intensity over the dimming area during the observation period from the AIA 211 Å images. | time | time | time | Angle\tabnotePosition angles are indicated clockwise from the North pole (see Figure 1a). | ||||
| 1 | 18 Aug. 2010 | -1116 | 05:02 | 06:00 | 07:02 | 4359 | 70 | C7 |
| 2 | 08 Mar. 2011 | -1104 | 03:42 | 03:48 | 04:46 | 4485 | 250 | M2 |
| 3 | 27 Jan. 2012 | -1795 | 18:06 | 18:56 | 20:08 | 5333 | 60 | X3 |
| 4 | 10 Sep. 2017 | -945 | 15:51 | 16:17 | 17:29 | 9042 | 100 | X3 |
The SWAP EUV telescope launched onboard the PROBA2 microsatellite on 2 November 2009 is capable of imaging the solar disk and inner corona in a single spectral band, 174 Å, over a 5454 arcmin field of view with 3.17 arcsec resolution and a cadence of about two minutes (see Seaton et al., 2013 for details of the design and parameters of SWAP). The response function of SWAP covers the temperature range approximately from 0.5 to 2 MK (Raftery et al., 2013), which embraces four of the most intense spectral lines of Fe ions: Fe ix 171.08, Fe x 174.53, Fe x 177.24, and Fe xi 180.41. The telescope has a two-mirror optical design including special baffles to suppress stray light over the field of view up to the heliocentric distance 1.7 to the level of 10-3 of the disc intensity without correction and to with the point spread function (PSF) correction (Goryaev et al., 2014).

The procedure of processing the SWAP images consisted in converting SWAP level 0 FITS files into level 1 using the standard p2sw_prep Solarsoft procedure, which includes correction for dark current, detector bias, flat-field variations, and bad pixels with the option to apply a PSF deconvolution to the data for removing stray light (see Halain et al., 2013). The effectiveness of this procedure was also estimated by Goryaev et al. (2014), where the level of stray-light after correction constituted less than 20 % of the coronal emission up to the heliocentric distances of 1.7 .
To emphasize the ray-like coronal structures in the dimming regions, the SWAP images of the off-limb corona were then transformed to polar coordinates using an interpolation procedure with taking into account the difference of the pixel dimensions in both representations. The format of these polar images was of 720400 pixels with resolution of 0.5 degrees in latitude and in height. To observe variations of the dimming structure brightness at large heights where the intensity of light was seriously decreased, we analyzed the relative difference images (present image minus reference image divided by the reference image excluding pixels with zero signal):
| (1) |
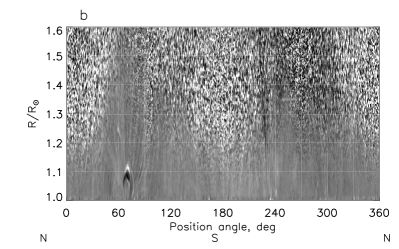
Figure \irefF-1 shows an example of the SWAP relative difference image of the solar corona and its representation in polar coordinates for the event of 18 August 2010 before eruption. Such a representation allows to enhance extended radial coronal structures stretched outward from the solar surface.

The dimming regions were determined from these images by the condition . Figure \irefF-2 presents the selected SWAP images of the dimming regions for the events listed in Table \irefT-1. Development of the dimmings and appearance of the ray-like features in the events under study are illustrated in Electronic Supplementary Material with the movies in the polar and relative difference polar presentations. In all cases, in the recovery periods (later than the peak of the dimming areas) the dimmings contained distinct structural elements. Below heliocentric distances of about , there are post-eruptive loops, whereas at greater heights quasi-radial ray-like structures are seen being brighter than the initial (before eruption) parts of the corona at the same place. Some of such rays appear in the traces of the expanding flux rope legs, and others appear some distance away from them. The rectangular boxes at the distance in some of the SWAP images in Figure \irefF-2 indicate the brightest places in the rays selected for the plasma diagnostics. The sizes of these regions are of 5.5∘ in latitude and 0.031 in height. Figure \irefF-3 shows temporal profiles of the relative intensity in the selected regions of the dimmings at the SWAP difference images.

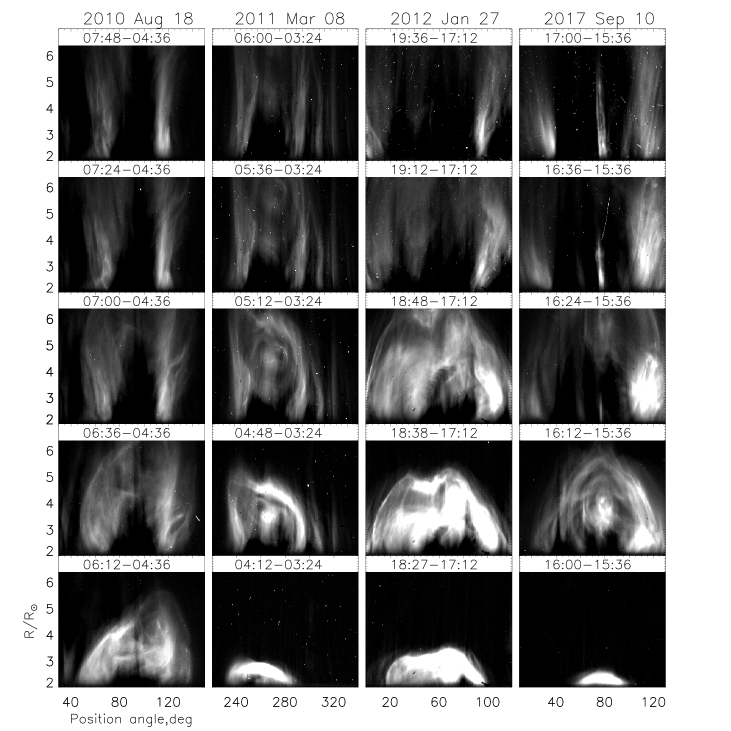
Figure \irefF-4 demonstrates propagation of the studied CMEs at the distances 2.2 – 6 seen by the Large Angle Spectroscopic Coronagraph (LASCO) C2 onboard SOHO (fixed-difference images in polar representation). These structures are evidently appeared as the lower parts (legs) of the flux ropes and some of them may be associated with extensions of the bright EUV features seen in the SWAP images in Figure \irefF-2.
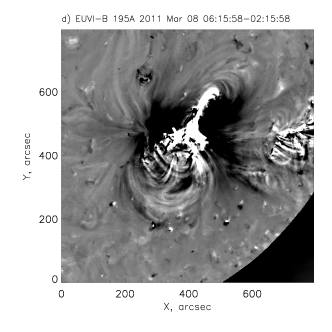
Figure \irefF-5 presents difference images of the dimmings on the disc derived from the Extreme-Ultra-Violet Imager (EUVI) data onboard STEREO-A (event on 18 August 2010) and STEREO-B (event on 8 March 2011). In the vicinity of active regions one can see the bright fan rays, which probably represent origins of the ray-like features seen by SWAP. These fan rays in the 195 Å look dimmer than in the 171 Å band (or completely absent as in the second event on 8 March 2011), which suggests that their plasma has temperatures less than 2 MK.


3 DEM Analysis
The DEM diagnostics of the coronal plasma in the dimming regions selected from the SWAP difference images was carried out using the SDO/AIA data in six EUV channels: 94, 131, 171, 193, 211, and 335 Å. To reconstruct the DEM temperature distributions, we used the fast code of Plowman, Kankelborg, and Martens (2013). The AIA level 1 images were first corrected for PSF using the Solarsoft aia_deconvolve_richardsonlucy routine followed by processing the level 1 images to the level 1.5 using the aia_prep code. The processed images were then binned from the original 40964096 frames to frames of 10241024 pixels to increase the signal-to-noise ratio (S/N) and to accelerate further treatment, and then they were used to retrieve the DEM temperature maps with the Plowman et al. code. For a better comparison with the SWAP data, the DEM maps were also transformed into polar coordinates with correction of values according to the geometric conjugation of the polar pixel area with the disc ones. For visual presentation, the derived DEM temperature distributions were divided into three temperature components transformed into three color channels of the true-color picture: the cool plasma with ( MK) is transformed into the blue component, the middle temperature plasma with ( MK) into the green one, and the hot plasma with ( MK) into the red one. The brightness in these channels is proportional to the emission measure in the corresponding temperature bands.

As it is seen from Figure \irefF-6, such a color picture demonstrates clearly the distribution of the temperature components above the limb over the whole corona. The dominant green color enhanced in the equatorial regions shows the main unstructured component of the quiet corona. The red color ( MK) is concentrated in the hot loops above active regions in a mixture with other components. The blue color dominates in the polar regions where the temperatures constitute MK in the absence of other hotter components. The uncertainty of these DEM distributions derived by means of the Plowman et al. method is about 30 – 35 % in the emission measure (EM) values (that is proportional to ). This value is summarized from 20 % calibration accuracy of different spectral bands, 10 – 15 % errors of the DEM reconstruction (revealed by comparison of the initial intensities with the recalculated ones using the obtained DEM) and 20 % uncertainty for the atomic data from the CHIANTI database (Del Zanna and Mason, 2018). The peak temperature for each point of the DEM map was determined with the accuracy of , which corresponds to the typical uncertainty of the Plowman et al. method. However, these estimations are related to the isothermal homogeneous plasma. Really, the coronal plasma is multi-temperature and structured, when different components overlap along the line-of-sight, so these values represent only the minimal error estimations.


Figure \irefF-7 shows the colored maps of the relative difference EM values [] for the dimming regions of the events under study in three temperature ranges. Rectangles on the DEM maps indicated in Figure \irefF-7 correspond to the regions of the ray-like features in the SWAP maps shown in Figure \irefF-2. Figure \irefF-8 displays the DEM temperature distributions averaged over the selected regions in the SWAP rays before and after eruption. It is seen that the DEM values noticeably increased for the cold plasma component in the rays compared to the pre-eruptive state at the temperatures of ( MK).
Table \irefT-2 shows the EM values integrated over each of the temperature ranges and averaged over the marked regions of the rays and the values of EM-weighted temperature evaluated for the times before eruption and for the dimming maximum. As seen in Table \irefT-2, the EM values in the rays at the dimming state dropped in II interval (the medium temperature peak) by 19 – 43 %, and in III interval (hot peak) by 26 – 47 %. In contrast, EM in the colder I interval was noticeably enhanced up to a factor of two in the dimming in comparison with the pre-eruption state (except the event of 8 March 2011, where the growth was only 3 %). This result agrees with the enhanced brightness of these structures in the SWAP difference images shown in Figures \irefF-2 and \irefF-3.
| Date | Time | EM [cm-5] | |||||||
|---|---|---|---|---|---|---|---|---|---|
| I | II | III | I | II | III | ||||
| 18 Aug. 2010 | 04:30 | 5.1 | 28. | 6.4 | 5.76 | 6.30 | 6.86 | ||
| 06:30 | 7.1 | 16. | 2.5 | 5.89 | 6.27 | 6.84 | |||
| 08 Mar. 2011 | 03:30 | 7.6 | 57. | 6.9 | 5.79 | 6.26 | 6.97 | ||
| 05:00 | 7.8 | 42. | 3.7 | 5.87 | 6.29 | 6.80 | |||
| 27 Jan. 2012 | 17:04 | 5.0 | 22. | 3.5 | 5.77 | 6.27 | 6.92 | ||
| 18:27 | 10. | 18. | 8.0 | 5.79 | 6.28 | 6.93 | |||
| 10 Sep. 2017 | 15:28 | 3.8 | 15. | 3.5 | 5.77 | 6.30 | 6.94 | ||
| 18:29 | 5.7 | 8.8 | 2.6 | 5.82 | 6.26 | 7.03 | |||
It should be noted that these three temperature components reflect inhomogeneity of the plasma along the line-of-sight, which we can presumably attribute to specific structures. We suggest that the middle temperature component mostly corresponds to the ambient corona outside the dimming body. Before eruption, at the reference time it contained also plasma in the dimming volume, which disappeared during the CME formation. As is seen in Figure \irefF-7, the hot component in the dimmings shows a fast decrease with height and disappears at 1.2 ; thus it most probably corresponds to the surrounding hot loops invisible in the SWAP images and does not relate to the features under study. The cold EM component evidently grows in the dimmings at the distances above 1.05 – 1.1 being especially enhanced in the ray-like features seen in the SWAP images. It means that these cold features contain plasma with the temperature corresponding to the SWAP temperature response range, which for quiet Sun extends over MK.
4 Discussion
4.1 Contribution of the Cold Ray-Like Features to the Solar Wind
To investigate a probable link of the ray-like features with the solar wind, we analyzed parameters of the solar-wind transient registered by the PLASTIC instrument onboard STEREO-A (see Figure \irefF-9) in connection with the first CME event in Table \irefT-1, which appeared in the LASCO field of view on 18 August 2010 at 05:48:05 UT. According to the Drag-Based Model calculations (see site oh.geof.unizg.hr/DBM/dbm.php) based on the CME data from the LASCO database (see site cdaw.gsfc.nasa.gov/CME_list/) the associated transient should arrive at the STEREO-A location on 20 August 2010 at 12:46 UT with the speed of 470 km s-1.

The solar-wind disturbance associated with the CME appearance was detected on 20 August 2010 at 16:00 UT by a sharp increase of the proton speed (from 336 to 479 km s-1), density, and magnetic-field magnitude. The magnetic-field disturbance, seen as a sharp increase of the strength and variation of the magnetic field components (in the Radial Tangential Normal (RTN) coordinate system), lasted up to 22 August (02:00 UT), which may be identified as a passing of the CME front followed by a magnetic cloud. The rise of the proton temperature and the rise of the derived -parameter to unity also confirm the end of the CME at that moment. Only the proton speed remained at the enhanced level of 500 km s-1 and decreased to the level of slow solar wind (340 km s-1) on 24 August (12:00 UT). We suppose that in the period between the end of the magnetic cloud and decrease of the proton speed to the slow solar-wind level (the CME tail) the solar wind contained plasma from the stream seen in the dimming by SWAP as cold ray on 18 August between 05:00 and 08:00 UT.
We assume that the plasma seen in the cold ray was propagating in the heliosphere behind the CME body along open magnetic-field lines with a constant speed equal to the solar-wind speed at the beginning of the CME tail (a drag decelerates only the CME front). To the distance of 20 (as it is ordinarily considered in the CME propagation models), the stream of cold plasma moved during 15 hours with a constant acceleration and the mean speed of 250 km s-1; then the stream propagated in the heliosphere during 75 hours to the STEREO-A spacecraft with the speed of 500 km s-1. Thus, the stream would arrive on 21 August at about 23:00 UT, which is very close to the beginning of the CME tail (22 August, 04:00 UT), according to the measurements.
The arrival of the cold stream is seen by the -parameter increase to unity and by enhancement of the mean charge of Fe-ions to and the increase of the total Fe-ion flux. This Fe mean charge corresponds to the plasma temperature of 1 MK measured in the cold rays at the heights of 1.25 . In analogy with the fast and slow solar-wind models (see, e.g., Landi et al., 2012), the mean charge of the stream practically does not change up to the freezing-in distances and remains unchanged later in the heliosphere. The transient solar wind stream arising in the dimming and appearing in the CME tail has signatures of the slow solar wind, except for the enhanced speed. This result explains the observations of some CMEs by Temmer et al. (2017b), who found prolonged (up to six days after arrival of a CME) excess of the solar-wind speed above the background.
4.2 Comparison of Cold Ray-Like Features Seen by SWAP with the Rays Observed in White Light/UV by LASCO and UVCS
Webb et al. (2003), Bemporad et al. (2006), Vršnak et al. (2009), and Ciaravella and Raymond (2008) pointed out that the hot rays with temperatures of 3 – 8 MK appearing in the outer corona in the aftermath of CMEs represent heliospheric current sheets connecting the post-eruptive arcades in the eruption site to the CME front. Ciaravella et al. (2013) defined three types of the rays appearing during the CME events by their emission in the spectral lines of different temperatures: the hot rays seen in Fe xviii ion lines, the coronal rays detected in those of Si xii and O vi, and the cool rays that show emission only in the lines of O vi and/or .

They identified the coronal rays with MK as corresponding to the ambient plasma, and the cool rays with MK as associated with the prominence material falling down on the Sun. To define the signatures of these rays in the lower corona, we made a scan of the plasma properties derived from the DEM distributions over the dimming areas at the distance of 1.25 (see Figure \irefF-10). At the upper panel there are latitudinal profiles of EM at the distance of obtained from the DEM maps integrated over the full temperature interval (0.3 – 30 MK): the solid lines correspond to the initial (before eruption) states, while the dotted ones correspond to the dimming states. The times of these states are given in Table \irefT-2. At the lower panel there are the relative difference EM distributions (EM1 - EM0)/EM0 (EM0 and EM1 are the initial and post-eruptive EM values respectively). These distributions are given for the cold (the blue lines) and hot (the red lines) components of the plasma in accordance with the temperature ranges I and III in Table \irefT-2.
| Event | Time , | , | , |
|---|---|---|---|
| [UT] | [MK] | [MK] | |
| 18 Aug. 2010 | 06:30 | 0.820.26\tabnoteThe errors include the standard deviation of averaging the temperatures (0.07 – 0.08 MK) and uncertainty of the DEM method at the temperatures MK (0.26 MK). | 8.42.2 |
| 08 Mar. 2011 | 05:00 | 0.740.26 | 8.61.9 |
| 27 Jan. 2012 | 18:27 | 0.630.27 | 9.81.0 |
| 10 Sep. 2017 | 18:29 | 0.650.26 | 13.11.5 |
These data show that the regions of the cold rays seen by SWAP are located mostly in the dimming areas, but in the two last cases they are also seen outside. The hottest structures are located mostly aside of dimmings and are not seen in the SWAP spectral passband because of their high temperature conditions. Table \irefT-3 contains the temperatures of the cold and hot rays obtained from the DEM distributions by the EM-weighting and then averaged over position angle. The cold-plasma components in all cases have practically the same temperatures and agree with the measured mean Fe-ion charge. In contrast, the temperatures of the hot components are more variable and obviously do not reproduce the corresponding ion component of solar wind with , as follows from the ionization balance equations (Rodkin et al., 2017; Grechnev et al., 2019). Taking into account their location outside dimmings, we can conclude that in our cases the hot components did not contribute to the solar wind but probably were related to the hot post-eruptive loops. Table \irefT-4 summarizes properties of the cold ray-like features obtained from the SWAP data in the events under study compared to the properties of the rays identified by Ciaravella et al. (2013) from an analysis of the UVCS spectrograms and LASCO data.
| Ray-like feature | Cold rays | Hot rays | Coronal rays | Cool rays |
|---|---|---|---|---|
| type | (SWAP) | (Fe xviii) | (Si xii, O vi) | (LASCO & UVCS) |
| Observational region | Dimming | Corona | Corona | Corona |
| Delay of appearance | 1 hr | 1 – 4 hrs | 1 – 30 hrs | 0.5 – 17 hrs |
| after start of a CME | ||||
| Duration | 40 min – 16 hrs | 2 – 38 hrs | 5 hrs – 3 days | 3 – 24 hrs |
| Temperature | 1.5 MK | 3 – 8 MK | 1.5 – 3 MK | 1.5 MK |
It follows that the ray-like features observed by SWAP are similar to those classified by Ciaravella et al. (2013) as cool rays. However, there are several differences. The ray-like features in the SWAP images appeared in less than one hour after the CME onset and existed during the dimming life span, whereas LASCO typically observed the coronal and cool rays one hour later the CME onsets during many hours up to several days not related to the dimming existence. We suppose that SWAP observed origins of the cool ray-like features at their early phase of formation in the dimming regions.
4.3 Nature of the Cool Ray-Like Features
In Figure \irefF-11 we represent the time evolution of the value (see Eq. (\irefEq-1)) for the region marked in Figure \irefF-7 on the event of 18 August 2010 as compared to the same from the Solar Demon data. Figure \irefF-11 shows that temporal variation of the intensity for the event of 18 August 2010 is well correlated with the total decrease of the EUV emission in the dimming taken from the Solar Demon data. The Pearson correlation coefficient between these functions is about 0.9. It suggests that the cold rays observed by SWAP contain matter released from the dimming volume, probably by reconnection between the quasi-open magnetic-field lines of the expanding flux rope and cool magnetic loops surrounding the active region. Several maxima at the ray light curve may be presumably caused by the moving blobs.

The supposition of Ciaravella et al. (2013) that cool rays are formed from the cool matter of a prominence body falling down on the Sun from a CME seems less plausible for two reasons: first, as it follows from Tripathi et al. (2007) the down-falling parts of prominences do not take the form of rays. Second, in this case appearance and brightness of the rays would not be correlated with the dimming formation.
Figure \irefF-12 presents the results of analysis of the plasma density and temperature distributions along the cold ray derived from the DEM map on 18 August 2010 in comparison with those distributions for a streamer observed on 20 October 2010 (Goryaev et al., 2014). Because in the streamer case the medium-temperature component of the ambient plasma was not subtracted, in the case of the cold ray we integrated EM over the extended temperature range 0.3 – 3.7 MK.

It appears that the density and temperature height distributions in the cold ray observed by SWAP at the distances are close to that observed in the streamer studied at similar solar activity. A slight enhancement at the distance below 1.1 can be explained by overlapping with the lower post-eruptive loops. This result suggests that in both cases formation of the plasma streams contributing to solar wind is physically similar.
5 Summary and Conclusions
We studied four coronal dimmings associated with limb CMEs that occurred in the period 2010 – 2017 using PROBA2/SWAP and SDO/AIA data. Below we summarize our main results and conclusions:
i) Bright ray-like structures revealed in the dimming regions by SWAP at the distances up to 1.6 are very likely bounded by the expanding flux ropes, probably representing their trunks or lateral flows of plasma formed as a result of reconnection of neighboring magnetic loops with “open” magnetic-field lines of the flux rope.
ii) In the low corona, these structures presumably originated as fan rays associated with open magnetic structures. Such structures often appear in the origins of pseudo-streamers or in the adjacent regions between active regions and coronal holes.
iii) The cold rays contain plasma with a temperature below 1 MK. It was found that the radial distributions of the electron density and temperature in the cold rays are similar to that determined by Goryaev et al. (2014) in the unipolar pseudo-streamer with signatures of the plasma outflows. Temporal variations of coronal-ray brightness may be caused by the blob structure of the moving plasma.
iv) Due to its low temperature, the plasma in the rays is enriched by the Fe8+–Fe10+ ions. For the event on 18 August 2010, enhancements of densities of these ions were observed in the STEREO/PLASTIC solar-wind data.
v) To summarize, the ray-like structures observed by SWAP presumably represent transient sources of plasma flows with the signatures of slow solar wind (except for increased speed), propagating in the tails of CMEs. Observations of the eruption in the aftermath of the CME in the corona with the wide-field SWAP telescope in the 174 Å band allow identification of origins of these rays, which is important for forecasting of solar wind.
Acknowledgments
This study was supported by the Russian Science Foundation (RSF) under grant 17-12-01567. We appreciate the NASA/SDO and the AIA science team; the NASA’s STEREO/ PLASTIC science and instrument teams; the teams operating LASCO on SOHO. SWAP is a project of the Centre Spatial de Liège and the Royal Observatory of Belgium funded by the Belgian Federal Science Policy Office (BELSPO). The STEREO/SECCHI data are produced by an international consortium of the Naval Research Laboratory (USA), Lockheed Martin Solar and Astrophysics Lab (USA), NASA Goddard Space Flight Center (USA), Rutherford Appleton Laboratory (UK), University of Birmingham (UK), Max-Planck-Institut für Sonnenforschung (Germany), Centre Spatiale de Liège (Belgium), Institut d’Optique Théorique et Appliquée (France), and Institut d’Astrophysique Spatiale (France).
Disclosure of Potential Conflict of Interest The authors declare that they have no conflict of interest.
References
- Aschwanden (2005) Aschwanden, M.J.: 2005, Physics of the Solar Corona. An Introduction with Problems and Solutions (2nd edition). Publisher: Springer-Verlag Berlin Heidelberg. ADS.
- Bein et al. (2013) Bein, B.M., Temmer, M., Vourlidas, A., Veronig, A.M., Utz, D.: 2013, The Height Evolution of the “True” Coronal Mass Ejection Mass derived from STEREO COR1 and COR2 Observations. ApJ 768, 31. DOI. ADS.
- Bemporad et al. (2006) Bemporad, A., Poletto, G., Suess, S.T., Ko, Y.-K., Schwadron, N.A., Elliott, H.A., Raymond, J.C.: 2006, Current Sheet Evolution in the Aftermath of a CME Event. ApJ 638, 1110. DOI. ADS.
- Bemporad et al. (2007) Bemporad, A., Raymond, J., Poletto, G., Romoli, M.: 2007, A Comprehensive Study of the Initiation and Early Evolution of a Coronal Mass Ejection from Ultraviolet and White-Light Data. ApJ 655, 576. DOI. ADS.
- Chertok and Grechnev (2003) Chertok, I.M., Grechnev, V.V.: 2003, Large-scale Dimmings Produced by Solar Coronal Mass Ejections According to SOHO/EIT Data in Four EUV Lines. Astron. Rep. 47, 934. DOI. ADS.
- Ciaravella and Raymond (2008) Ciaravella, A., Raymond, J.C.: 2008, The Current Sheet Associated with the 2003 November 4 Coronal Mass Ejection: Density, Temperature, Thickness, and Line Width. ApJ 686, 1372. DOI. ADS.
- Ciaravella et al. (2013) Ciaravella, A., Webb, D.F., Giordano, S., Raymond, J.C.: 2013, Bright Ray-like Features in the Aftermath of Coronal Mass Ejections: White Light versus Ultraviolet Spectra. ApJ 766, 65. DOI. ADS.
- Crooker, McPherron, and Owens (2014) Crooker, N.U., McPherron, R.L., Owens, M.J.: 2014, Comparison of interplanetary signatures of streamers and pseudostreamers. J. Geophys. Res. (Space Phys.) 119, 4157. DOI. ADS.
- Del Zanna and Mason (2018) Del Zanna, G., Mason, H.E.: 2018, Solar UV and X-ray spectral diagnostics. Liv. Rev. Solar Phys. 15, 5. DOI. ADS.
- Goryaev et al. (2014) Goryaev, F., Slemzin, V., Vainshtein, L., Williams, D.R.: 2014, Study of Extreme-ultraviolet Emission and Properties of a Coronal Streamer from PROBA2/SWAP, Hinode/EIS and Mauna Loa Mk4 Observations. ApJ 781, 100. DOI. ADS.
- Grechnev et al. (2019) Grechnev, V.V., Kochanov, A.A., Uralov, A.M., Slemzin, V.A., Rodkin, D.G., Goryaev, F.F., Kiselev, V.I., Myshyakov, I.I.: 2019, Development of a Fast CME and Properties of a Related Interplanetary Transient. Sol. Phys. 294, 139. DOI. ADS.
- Halain et al. (2013) Halain, J.-P., Berghmans, D., Seaton, D.B., Nicula, B., De Groof, A., Mierla, M., Mazzoli, A., Defise, J.-M., Rochus, P.: 2013, The SWAP EUV Imaging Telescope. Part II: In-flight Performance and Calibration. Sol. Phys. 286, 67. DOI. ADS.
- Hansen et al. (1974) Hansen, R.T., Garcia, C.J., Hansen, S.F., Yasukawa, E.: 1974, Abrupt Depletions of the Inner Corona. PASP 86(512), 500. DOI. ADS.
- Harrison and Lyons (2000) Harrison, R.A., Lyons, M.: 2000, A spectroscopic study of coronal dimming associated with a coronal mass ejection. A&A 358, 1097. ADS.
- Harrison et al. (2003) Harrison, R.A., Bryans, P., Simnett, G.M., Lyons, M.: 2003, Coronal dimming and the coronal mass ejection onset. A&A 400, 1071. DOI. ADS.
- Kraaikamp and Verbeeck (2015) Kraaikamp, E., Verbeeck, C.: 2015, Solar Demon - an approach to detecting flares, dimmings, and EUV waves on SDO/AIA images. J. Space Weather Space Clim. 5, A18. DOI. ADS.
- Landi et al. (2010) Landi, E., Raymond, J.C., Miralles, M.P., Hara, H.: 2010, Physical Conditions in a Coronal Mass Ejection from Hinode, Stereo, and SOHO Observations. ApJ 711, 75. DOI. ADS.
- Landi et al. (2012) Landi, E., Gruesbeck, J.R., Lepri, S.T., Zurbuchen, T.H.: 2012, New Solar Wind Diagnostic Using Both in Situ and Spectroscopic Measurements. ApJ 750, 159. DOI. ADS.
- Landi et al. (2013) Landi, E., Miralles, M.P., Raymond, J.C., Hara, H.: 2013, Hot Plasma Associated with a Coronal Mass Ejection. ApJ 778, 29. DOI. ADS.
- Lee et al. (2009) Lee, J.-Y., Raymond, J.C., Ko, Y.-K., Kim, K.-S.: 2009, Three-Dimensional Structure and Energy Balance of a Coronal Mass Ejection. ApJ 692(2), 1271. DOI. ADS.
- Mandrini et al. (2007) Mandrini, C.H., Nakwacki, M.S., Attrill, G., van Driel-Gesztelyi, L., Démoulin, P., Dasso, S., Elliott, H.: 2007, Are CME-Related Dimmings Always a Simple Signature of Interplanetary Magnetic Cloud Footpoints? Sol. Phys. 244, 25. DOI. ADS.
- Munro and Sime (1985) Munro, R.H., Sime, D.G.: 1985, White-light coronal transients observed from Skylab May 1973 to February 1974: A classification by apparent morphology. Sol. Phys. 97, 191. DOI. ADS.
- Plowman, Kankelborg, and Martens (2013) Plowman, J., Kankelborg, C., Martens, P.: 2013, Fast Differential Emission Measure Inversion of Solar Coronal Data. ApJ 771, 2. DOI. ADS.
- Raftery et al. (2013) Raftery, C.L., Bloomfield, D.S., Gallagher, P.T., Seaton, D.B., Berghmans, D., De Groof, A.: 2013, Temperature Response of the 171 Å Passband of the SWAP Imager on PROBA2, with a Comparison to TRACE, SOHO, STEREO, and SDO. Sol. Phys. 286, 111. DOI. ADS.
- Rodkin et al. (2017) Rodkin, D., Goryaev, F., Pagano, P., Gibb, G., Slemzin, V., Shugay, Y., Veselovsky, I., Mackay, D.H.: 2017, Origin and Ion Charge State Evolution of Solar Wind Transients during 4 - 7 August 2011. Sol. Phys. 292, 90. DOI. ADS.
- Rust (1983) Rust, D.M.: 1983, Coronal Disturbances and Their Terrestrial Effects. Space Sci. Rev. 34, 21. DOI. ADS.
- Rust and Hildner (1976) Rust, D.M., Hildner, E.: 1976, Expansion of an X-ray coronal arch into the outer corona. Sol. Phys. 48, 381. DOI. ADS.
- Seaton et al. (2013) Seaton, D.B., Berghmans, D., Nicula, B., Halain, J.-P., De Groof, A., Thibert, T., Bloomfield, D.S., Raftery, C.L., Gallagher, P.T., Auchère, F., Defise, J.-M., D’Huys, E., Lecat, J.-H., Mazy, E., Rochus, P., Rossi, L., Schühle, U., Slemzin, V., Yalim, M.S., Zender, J.: 2013, The SWAP EUV Imaging Telescope Part I: Instrument Overview and Pre-Flight Testing. Sol. Phys. 286, 43. DOI. ADS.
- Slemzin et al. (2008) Slemzin, V., Bougaenko, O., Ignatiev, A., Kuzin, S., Mitrofanov, A., Pertsov, A., Zhitnik, I.: 2008, Off-limb EUV observations of the solar corona and transients with the CORONAS-F/SPIRIT telescope-coronagraph. Ann. Geophys. 26, 3007. DOI. ADS.
- Sterling and Hudson (1997) Sterling, A.C., Hudson, H.S.: 1997, Yohkoh SXT Observations of X-Ray “Dimming” Associated with a Halo Coronal Mass Ejection. ApJ 491, L55. DOI. ADS.
- Temmer et al. (2017a) Temmer, M., Thalmann, J.K., Dissauer, K., Veronig, A.M., Tschernitz, J., Hinterreiter, J., Rodriguez, L.: 2017a, On Flare-CME Characteristics from Sun to Earth Combining Remote-Sensing Image Data with In Situ Measurements Supported by Modeling. Sol. Phys. 292, 93. DOI. ADS.
- Temmer et al. (2017b) Temmer, M., Reiss, M.A., Nikolic, L., Hofmeister, S.J., Veronig, A.M.: 2017b, Preconditioning of Interplanetary Space Due to Transient CME Disturbances. ApJ 835, 141. DOI. ADS.
- Thompson et al. (1998) Thompson, B.J., Plunkett, S.P., Gurman, J.B., Newmark, J.S., St. Cyr, O.C., Michels, D.J.: 1998, SOHO/EIT observations of an Earth-directed coronal mass ejection on May 12, 1997. Geophys. Res. Lett. 25, 2465. DOI. ADS.
- Tripathi et al. (2007) Tripathi, D., Solanki, S.K., Mason, H.E., Webb, D.F.: 2007, A bright coronal downflow seen in multi-wavelength observations: evidence of a bifurcating flux-rope? A&A 472, 633. DOI. ADS.
- Vanninathan et al. (2018) Vanninathan, K., Veronig, A.M., Dissauer, K., Temmer, M.: 2018, Plasma Diagnostics of Coronal Dimming Events. ApJ 857, 62. DOI. ADS.
- Veronig et al. (2019) Veronig, A.M., Gömöry, P., Dissauer, K., Temmer, M., Vanninathan, K.: 2019, Spectroscopy and Differential Emission Measure Diagnostics of a Coronal Dimming Associated with a Fast Halo CME. ApJ 879, 85. DOI. ADS.
- Vršnak et al. (2009) Vršnak, B., Poletto, G., Vujić, E., Vourlidas, A., Ko, Y.-K., Raymond, J.C., Ciaravella, A., Žic, T., Webb, D.F., Bemporad, A., Landini, F., Schettino, G., Jacobs, C., Suess, S.T.: 2009, Morphology and density structure of post-CME current sheets. A&A 499, 905. DOI. ADS.
- Wang, Sheeley, and Rich (2007) Wang, Y.-M., Sheeley, J. N. R., Rich, N.B.: 2007, Coronal Pseudostreamers. ApJ 658, 1340. DOI. ADS.
- Wang et al. (2000) Wang, Y.-M., Sheeley, N.R., Socker, D.G., Howard, R.A., Rich, N.B.: 2000, The dynamical nature of coronal streamers. J. Geophys. Res. 105, 25133. DOI. ADS.
- Webb et al. (2003) Webb, D.F., Burkepile, J., Forbes, T.G., Riley, P.: 2003, Observational evidence of new current sheets trailing coronal mass ejections. J. Geophys. Res. (Space Phys.) 108, 1440. DOI. ADS.
- Zarro et al. (1999) Zarro, D.M., Sterling, A.C., Thompson, B.J., Hudson, H.S., Nitta, N.: 1999, SOHO EIT Observations of Extreme-Ultraviolet “Dimming” Associated with a Halo Coronal Mass Ejection. ApJ 520, L139. DOI. ADS.
- Zhukov and Auchère (2004) Zhukov, A.N., Auchère, F.: 2004, On the nature of EIT waves, EUV dimmings and their link to CMEs. A&A 427, 705. DOI. ADS.