Impact of the Number of Votes on the Reliability and Validity of Subjective Speech Quality Assessment in the Crowdsourcing Approach
Abstract
The subjective quality of transmitted speech is traditionally assessed in a controlled laboratory environment according to ITU-T Rec. P.800. In turn, with crowdsourcing, crowdworkers participate in a subjective online experiment using their own listening device, and in their own working environment. Despite such less controllable conditions, the increased use of crowdsourcing micro-task platforms for quality assessment tasks has pushed a high demand for standardized methods, resulting in ITU-T Rec. P.808. This work investigates the impact of the number of judgments on the reliability and the validity of quality ratings collected through crowdsourcing-based speech quality assessments, as an input to ITU-T Rec. P.808 . Three crowdsourcing experiments on different platforms were conducted to evaluate the overall quality of three different speech datasets, using the Absolute Category Rating procedure. For each dataset, the Mean Opinion Scores (MOS) are calculated using differing numbers of crowdsourcing judgements. Then the results are compared to MOS values collected in a standard laboratory experiment, to assess the validity of crowdsourcing approach as a function of number of votes. In addition, the reliability of the average scores is analyzed by checking inter-rater reliability, gain in certainty, and the confidence of the MOS. The results provide a suggestion on the required number of votes per condition, and allow to model its impact on validity and reliability.
Index Terms:
crowdsourcing, speech, quality assessment, reliability, validityI Introduction
The quality of speech transmitted through communication networks is commonly seen as a result of a perception and judgment process [1]. During the assessment, a listener perceives an acoustic event, and analyzes it according to a number of criteria. These criteria are partially defined externally (e.g. by the test task), and partially by the internal reference which is built through prior exposure to this and other acoustic events. Frequently, the task of the assessment requires some quantitative scaling of the entity, e.g. a number related to the overall quality, intelligibility, coloration, or alike, usually a rating on a category scale. As a result of individual differences in the perception process and the internal reference, the same acoustic event may result in different quantitative judgments. In addition, the acoustic event may differ because of differences in the experimental setup for each listener, or across repetitions of the same experiment.
The uncertainty of the quality judgments — and thus of the perceived quality — is inherent to every measurement process, be it based on human subjects or on technical instruments. The goodness of such measurements is commonly expressed by two main criteria: The validity, i.e. the method should be able to measure what it is intended to measure, and the reliability, i.e. the method should be able to provide stable results across repeats of the same measurement [2]. Other goodness criteria are e.g. the sensitivity (able to measure small variations in what it is intended to measure), its objectivity (reach inter-individual agreement on the measurement results), its robustness (able to provide results independent from variables that are extraneous to the construct being measured), as well as its efficiency (provide good results with limited efforts invested) [2].
When it comes to speech quality assessments, most recommended methods make use of subjective listening experiments carried out under controlled listening conditions. These conditions include the selection of test participants, the acoustic characteristics of the test environment, the processing of the speech stimuli triggering the acoustic event, the listening devices used for presenting these events, the test task and test design, the rating scale(s) and procedures. These recommendations are summarized by the Telecommunication Standardization Sector of the International Telecommunication Union (ITU-T) in Rec. P.800 [3]. The majority of speech quality assessments in the literature follow this recommendation.
The laboratory (lab) tests are criticized because of their artificial test situation: Whereas average users of telecommunication services listen to speech in acoustically spoiled conditions, with rather sub-optimal listening devices, the lab test situation is meant to increase the sensitivity and robustness of the measurement process. As a consequence, the ecological validity of the measurement suffers, as the assessment situation does not reflect “normal” service usage any more. In addition, conducting lab tests is expensive and time intensive.
With the rise of crowdsourcing (CS) micro-task platforms, proposals have been made to transfer listening quality assessments and other assessments of quality to the crowd [4, 5, 6, 7]. The use of online portals might attract a larger and more diverse group of listeners, thus better representing service users – this might increase validity. In addition, a larger number of usage situations, including listening devices, background noises, distractions from the listening process, etc., might increase the realism of the measurement, and thus ecological validity. In turn, the lack of control puts severe doubts on the reliability of the measurement. These and other characteristics are summarized in ITU-T Rec. P.808 [8], which has been set up with the aim of increasing the reliability and acceptability of crowdsourcing-based speech quality measurements.
Whereas there are several established methods for analyzing the reliability of speech quality measurements, their validity is more difficult to estimate. One could take the position that valid quality judgments can only be obtained from a fully representative choice of users, user devices, and usage situations. Following this argument, a crowdsourcing-based assessment would be more ecologically valid than a lab-based assessment. Unfortunately, there are no reliable reports on the diversity of users, devices and listening situations which would justify that a standard crowdsourcing-based study would reach that aim. On the other hand, lab tests are currently the most used method for speech quality assessment, thus the result of such an assessment could be seen as a type of “gold standard”.
It is the aim of the present paper to assess the impact of the number of judgments on the reliability and validity of overall quality judgments in the crowd. In doing so, we will examine the validity, with lab tests as a “gold standard”, and calculate the rank-order correlation, and an absolute difference as a criterion. Reliability will be checked in terms of inter-rater reliability, gain in certainty, and confidence of the MOS.
II Methodology
Three datasets from the dataset pool of the ITU-T Rec. P.863 [9] competition were selected, namely 401, 501 and 701. They were prepared according to ITU-T Rec. P.800. Access to them was kindly provided to us for these evaluations. The datasets include two different languages and study designs and cover a variety of degradations. For each dataset, the results of lab-based experiments were also provided by corresponding contributors. Tab. I summarizes the source materials and the design of the lab assessments.
| Dataset 401 | Dataset 501 | Dataset 701 | |
|---|---|---|---|
| Title | Psytechnics P.OLQA test 1 | SwissQual P.OLQA SWB 1 | DOLBY |
| Number of conditions | 48 | 50 | 72 |
| Files per condition | 24 | 4 | 16 |
| Votes per file, (per condition) | 8, (192) | 24, (96) | 8, (128) |
| Listeners | 32 | 24 | 32 |
| Design | 6 talkers (3m, 3f) | 4 talkers (2m, 2f) | 4 talkers (2m, 2f) |
| Language | British English | German, Swiss pronunciation | American English |
| Number of files | 1152 | 200 | 1152 |
| Listened through | Sennheiser HD25-1 | Grado SR60 | Sennheiser HD 600 |
II-A Crowdsourcing Experiments
One crowdsourcing test was conducted for each of the datasets. The tests followed the ITU-T Rec. P.808, and consisted of a qualification, a training, and a rating part. Additionally, different data cleansing methods were applied based on the instructions given in ITU-T Rec. P.808. In the following, we briefly summarise the individual tests111We made the crowdsourcing ratings openly available at https://github.com/hossfeld/crowdsourced-speech-quality.
II-A1 CS 401
CS 401 was performed on Amazon Mechanical Turk222https://www.mturk.com Accessed March 2020 using its internal template engine. Only US workers with a task approval rate above 98% and more than accepted jobs were allowed to participate. The qualification tasks consisted of a self assessment of the workers’ hearing capabilities and a modified version of digit-triplet test [10] as a hearing test. Here, the workers had to listen to five stimuli with a signal-to-noise ratio (SNR) of -11.2 dB and type in the numbers they heard. This SNR was chosen to reach high true positive rate. From participants, workers successfully passed the qualification. Then, were randomly selected for the training and rating task. In the training task, the workers could familiarize themselves with the task interface and with different stimuli representing the entire quality range. The rating task consisted of stimuli, one trapping stimulus, a stereo test and environment suitability test. We aimed at collecting votes per stimulus. Overall, we collected rating tasks, each including votes, from unique workers. In total rating tasks from workers were accepted for further analysis, after removing responses with invalid trapping questions and failed stereo or environmental screening test.
II-A2 CS 501
The CS 501 study was run on Clickworker333https://www.clickworker.com Accessed March 2020, due to its large number of German speaking workers. Clickworker’s templates did not support audio playback at the time of the data collection, thus, an external system was implemented for the tests. In this study, the qualification phase was implemented as a German listening comprehension test with three audio stimuli. During the training job, workers had to sum up numbers that were played on the left and right audio channel as a stereo test. Finally, they listened to five stimuli from the dataset that covered the complete MOS range and thus, serving as anchoring. Workers who successfully answered the math question were allowed to proceed to the rating task. The rating job included stimuli and one trapping question. In total, ratings from unique workers were collected. All workers answered the trapping questions correctly. Then, 136 ratings were identified as extreme outliers (i.e. located at a distance from the median equal or higher than ) and were removed.
II-A3 CS 701
The last study, CS 701, was performed on Microworkers444https://www.microworkers.com Accessed March 2020. Similar to Clickworker, Microworkers’ template system also does not support audio playback and an external system was implemented. In contrast to CS 401 and CS 501, the qualification task of CS 701 did not rely on audio stimuli, but was based on self-assessment of the workers’ hearing capabilities and their surrounding environment. All workers that completed the qualification task were also allowed to participate in the training and rating task, as a preselection based on the self assessment might encourage other workers to provide incorrect responses to gain access to the succeeding tasks. However, only responses from workers that did not report hearing impairments or noisy surroundings were considered. The training job gave the workers the chance to adjust the playback volume and to familiarize themselves with the task interface. Further, the workers had to complete a stereo test similar to the one in CS 501. After successfully completing the training task, each worker was allowed to submit up to rating tasks, with each rating task consisting of stimuli and one trapping stimulus injected at random. In total workers completed rating jobs. After removing workers due to self-reported hearing impairments, invalid answers to trapping stimuli and failing the stereo test, ratings from 144 workers remained for further analysis.
II-B Simulation
Collected ratings in each of the above-mentioned subjective experiments can be described as following, where reflects the number of ratings on the scale given by user for the degradation condition . The set of all users is denoted as and the MOS () of condition can be calculated as
| (1) |
with as the number of ratings from user for condition . Thereby, is the MOS value for user and condition . It should be noted that in the CS test users may rate the same condition several times (i.e. ratings from different stimuli which refer to the same degradation) or may not rate a certain condition at all.
Based on the above-mentioned subjective data, simulations were conducted by randomly sampling with replacement from the collected votes. For each degradation condition , a fixed number of votes were sampled in two steps. First, users were drawn following the empirical probability , which, given the condition , estimates a probability that the user provides a rating for condition :
| (2) |
Then, for each selected user and condition , the individual vote is sampled from the user rating distribution of user for condition :
| (3) |
The simulation was repeated times, and the mean and 95% confidence interval (CI) of each metric were calculated for further evaluation.
III Results
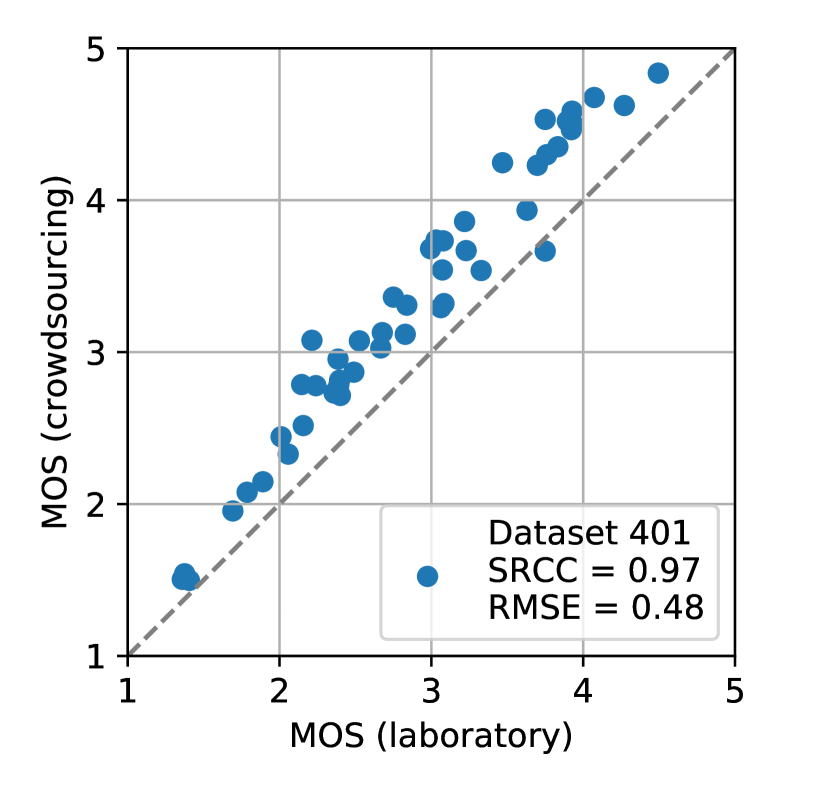
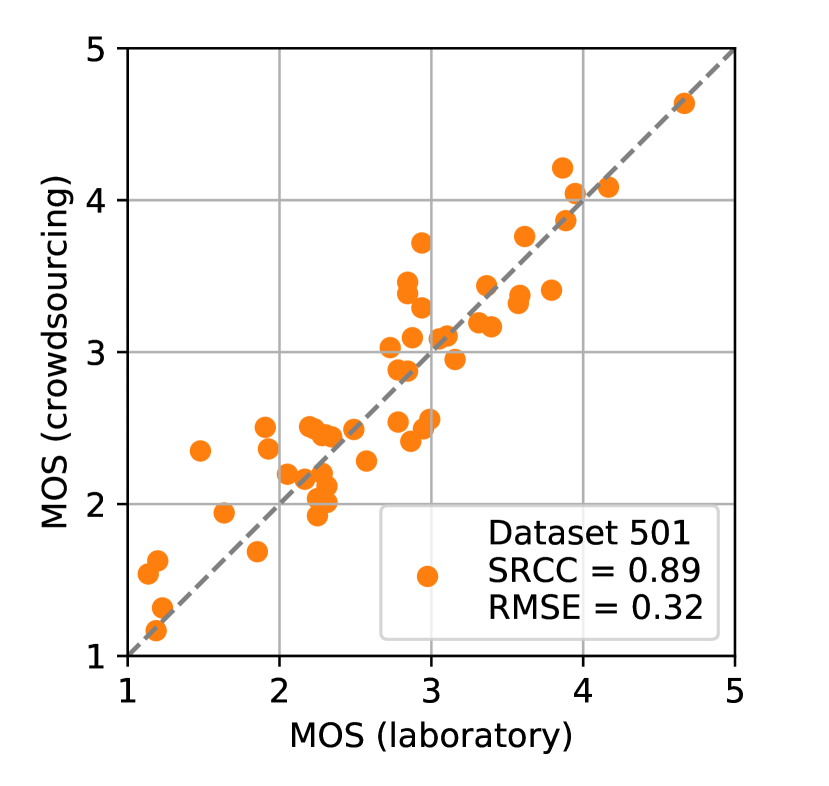
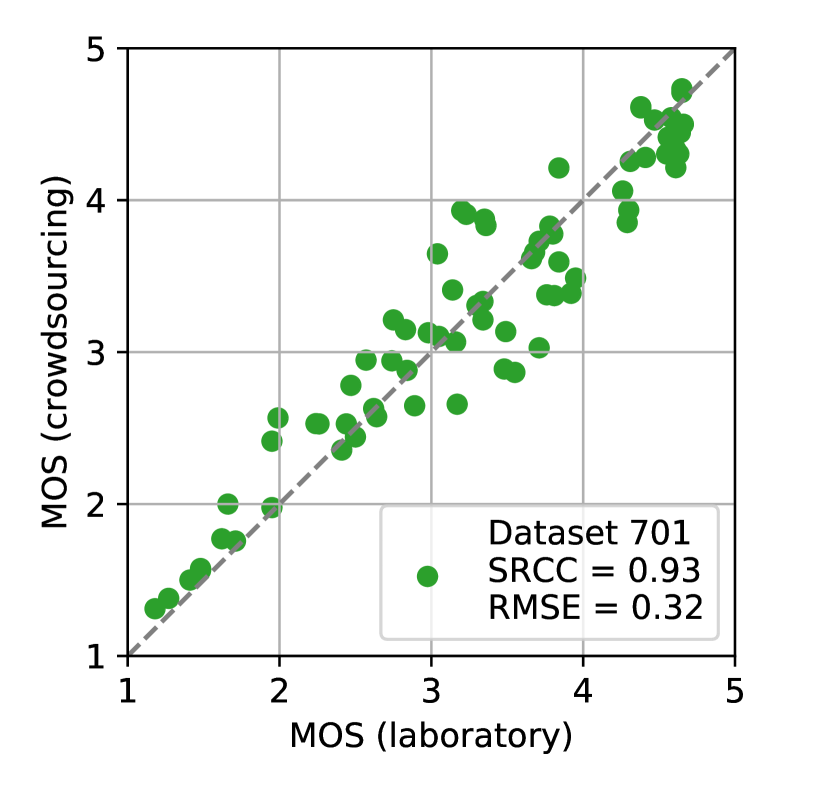
The MOS values per condition using all accepted votes obtained from the crowdsourcing tests are compared with the values provided from the corresponding lab based experiments (Tab. II) using the Root Mean Squared Error (RMSE) and the Spearman’s rank correlation coefficient (SRCC). The results show that there is a high correlation between the MOS values from the crowdsourcing tests and those from the lab tests (Fig. 1). Meanwhile it shows that there is a bias and different gradient between crowdsourcing and lab scores. Applying a first-order mapping significantly decreases the RMSE for CS401 but not for the other tests.
| Test | SRCC | RMSE | RMSE -FOMb | Avg. votes |
| p. cond. (STD) | ||||
| CS 401 | a | () | ||
| CS 501 | a | () | ||
| CS 701 | a | () | ||
| b after 1st order mapping | ||||
III-A Validity
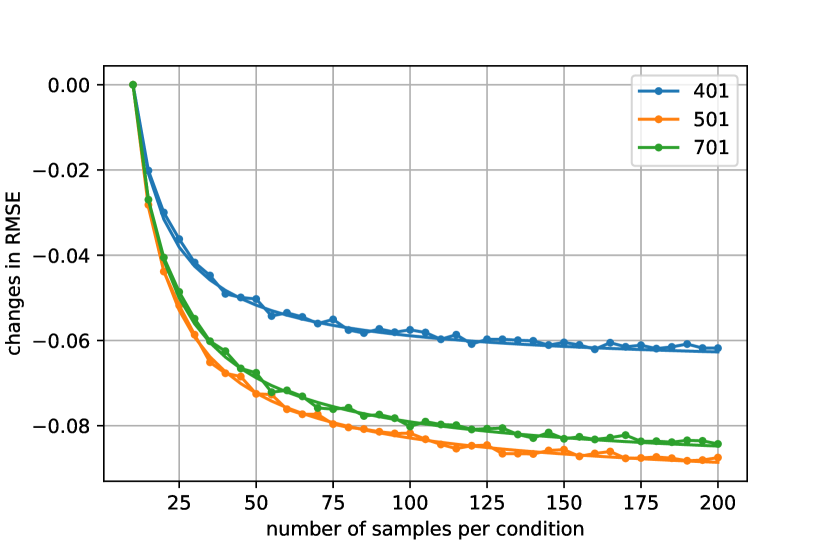
The validity of opinion scores collected through CS as a function of number of votes is examined by calculating the SRCC and RMSE between the calculated MOS values from selected votes in each simulation stage and the MOS values from lab experiments for each dataset. Each simulation stage has been repeated 250 times, and the resulting mean and CI for both metrics are used to fit power models for each dataset (Tab. III). The changes in SRCC and RMSE as functions of number of votes, as well as the fitted functions are reported in Fig. 2. Due to the large number of simulations the average width of the CI is only . Therefore, CI are omitted in the result figures. Results show that the curves already flatten out for 60–100 samples per condition.
| Model | a | b | c | |||
|---|---|---|---|---|---|---|
| SRCC 401 | -0.3837 | -1.0129 | 0.9749 | -0.3837 | -1.0129 | 0.9749 |
| SRCC 501 | -0.3039 | -0.8319 | 0.8916 | -0.3039 | -0.8319 | 0.8916 |
| SRCC 701 | -0.3443 | -0.9675 | 0.9317 | -0.3443 | -0.9675 | 0.9317 |
| RMSE 401 | 0.6467 | -0.9903 | 0.4803 | 0.8004 | -0.8306 | 0.1647 |
| RMSE 501 | 0.6717 | -0.8544 | 0.3184 | 0.6528 | -0.8588 | 0.3109 |
| RMSE 701 | 0.7667 | -0.9142 | 0.3172 | 0.8141 | -0.9074 | 0.3149 |
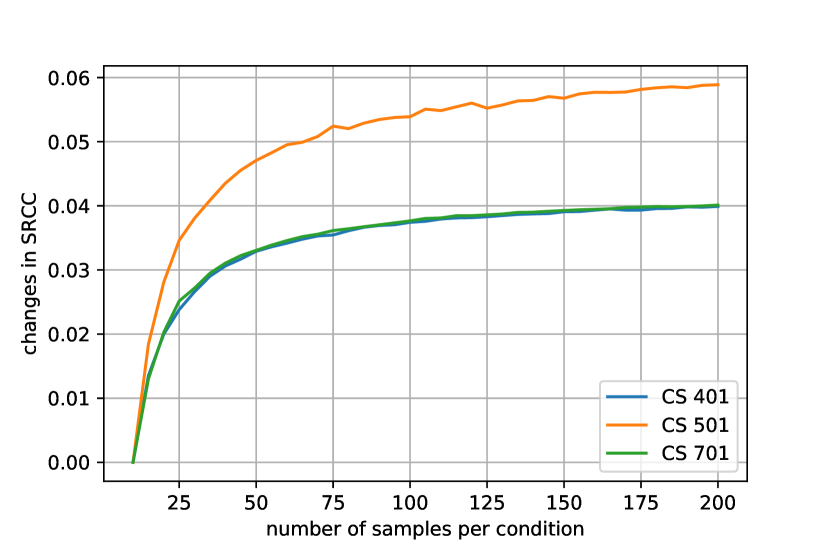
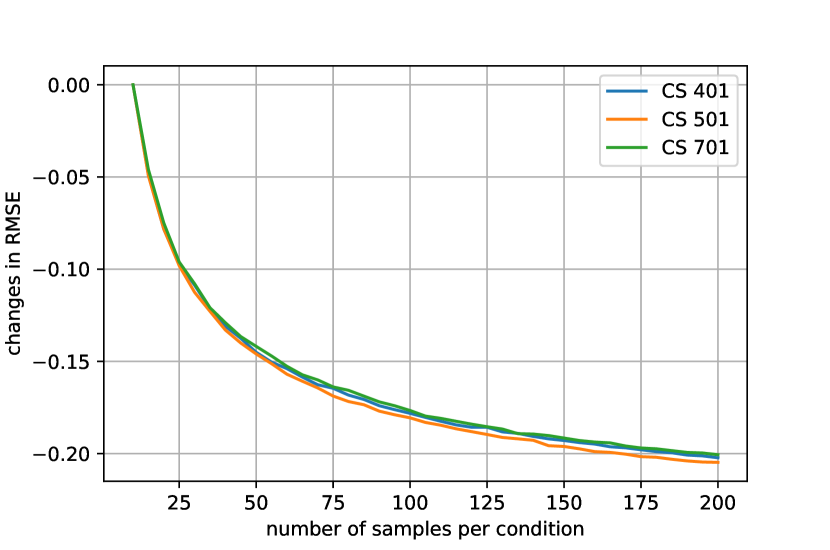
III-B Certainty Gain
We compared the simulated samples with the full CS data to see how much certainty we gain by adding more ratings. In other words, we quantify the loss in certainty when only a subset of the ratings is used. In the simulation run , we sample votes for each test condition and calculate the MOS values for test conditions . The vector summarizes the MOS values for the sub-sample for all test conditions in the simulation run .
Meanwhile, MOS value , and the corresponding vector , can be calculated using all ratings in the dataset. Then, the gain in certainty of simulation run is quantified as (a) the RMSE and (b) the SRCC between and . Again, the simulation is repeated times and the average gain in certainty is derived over the simulation runs.
| (4) | |||||
| (5) |
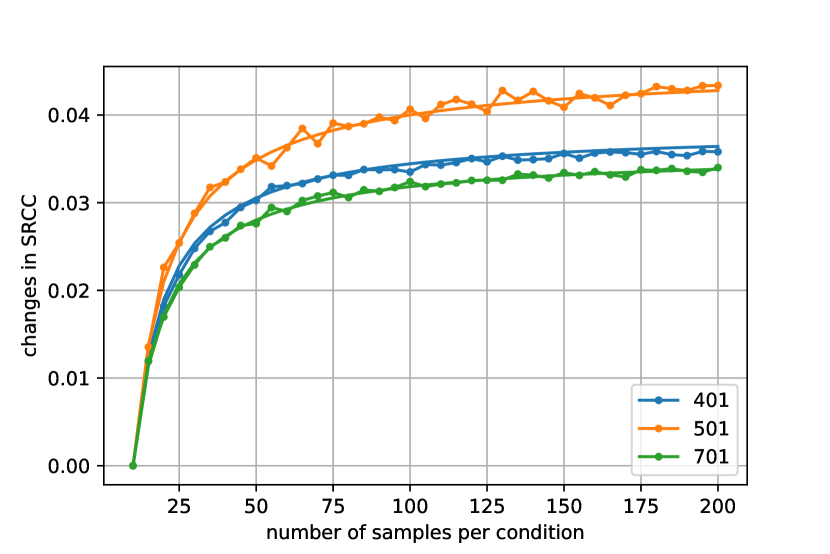
Fig. 3 shows the changes in the certainty gain for SRCC and RMSE. In particular, the changes are computed by subtracting the values by the first point for a sample size of , i.e., and . First, we observe that the changes in the SRCC are almost similar for CS 401 and CS 701. For CS 501, the obtained changes in the SRCC are higher. For more than 50 samples per condition, the curves start to flatten out, thus, around 60–100 samples seem to provide a good recommendation. For the changes in the RMSE, there are no significant curves across the datasets. When , the difference between resulting RMSE and the RMSE with votes is more than 0.15 MOS.
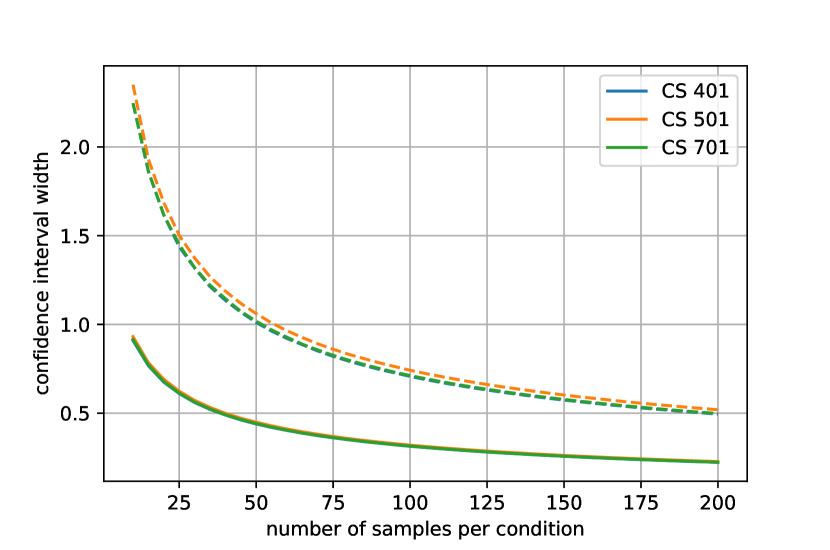
III-C Confidence Interval Width
Another measure for the uncertainty of the data considers the width of the CI for the MOS values. In particular, in the simulation run , we sampled votes for each condition . The width of the CI for the MOS of condition in run is computed based on bootstrapping, as recommended in [11], and is the difference between the upper and the lower CI bound. We used the non-parametric bootstrap method by Efron [12], which solely employs the empirical distribution of the user ratings for a condition to derive the (not necessarily symmetric) CI around the mean. Then, we obtain the following average CI width as uncertainty measure.
| (6) |
Fig. 4 plots the confidence interval width depending on the number of samples per condition for the three different datasets. We can observe that for . For , at least samples per condition are required. It can be seen that the results are almost identical across the datasets. In the lab experiments, the average confidence interval width is 0.20, 0.31, 0.26 for the lab dataset 401, 501, 701 based on 192, 96, 128 users, respectively.
Fig. 4 plots also the maximum possible CI width as dashed line. This maximum CI is obtained, when a ratio of users rates and the ratio of the remaining users rate , see [13]. For a given MOS value , it is . Then, binomial proportion CIs are computed for a given sample size based on Clopper-Pearson intervals [11], resulting in a lower bound and an upper bound , respectively. Then, the MOS confidence interval width is .
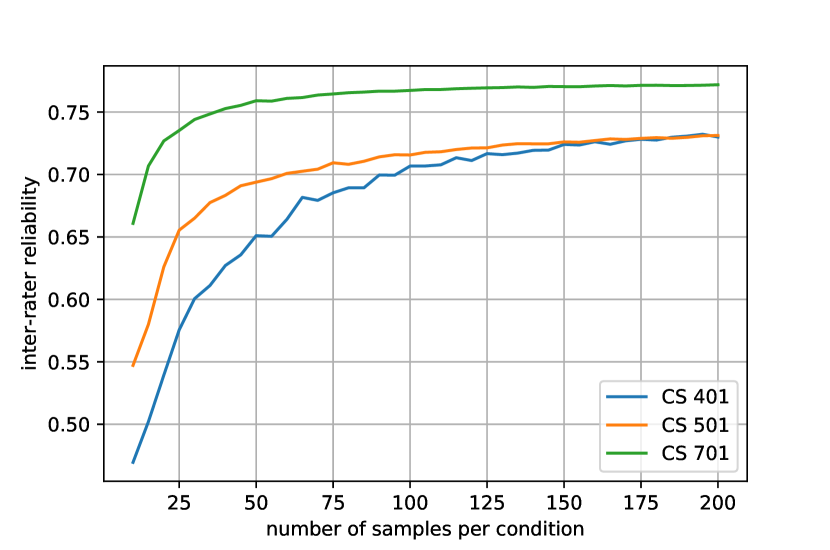
III-D Inter-Rater Reliability (IRR)
The inter-rater reliability (IRR) is derived for a single simulation run where each condition is rated times. An individual user rates several conditions with corresponding MOS value for . For the conditions , the MOS value is derived by considering all other users except . Then, the SRCC is computed for all conditions between the MOS from user and the MOS from all others . The inter-rater reliability of simulation run considers then SRCC values averaged over all users.
| (7) |
The inter-rater reliability is again the average over repetitions, . Fig. 5 depicts the IRR depending on the sample size . We see significant differences between all three curves in terms of absolute IRR. However, the shape of the curves is again similar. After 60–100 the curves flatten out once more. Note that the IRR is bounded by the IRR of the entire CS dataset (). We recommend to have at least 60 samples with regard to the IRR.
IV Discussion and Conclusion
We performed an analysis of quality judgments obtained in three crowdsourcing studies carried out on three different standard databases, using different crowdsourcing platforms and experimenters. For each database, corresponding lab judgments were provided which were collected according to ITU-T Rec. P.800. We consider the lab data as a ground truth for our crowdsourcing experiments, acknowledging that lab data also carries an uncertainty, and that the lab environment may not lead to ecologically valid results.
Regarding the validity of the crowdsourcing experiments, in all cases a good correlation to the lab data could be achieved. Spearman’s rank order correlation ranged between and for the three databases, and the RMSE between and on the MOS scale. For the 401 database, a bias between lab and CS data was observed, which could be removed with a 1st order mapping, resulting in a rather low RMSE (). Overall, taking the lab data as a “gold standard”, a good validity of the crowdsourcing experiments could be achieved.
When varying the number of votes (which was the focus of the experiments), both correlation and RMSE did not substantially increase after approx. votes per condition. Although the absolute value of both metrics and the relative increase of the metric with increasing number of votes below 60 votes is different for each database (especially for the 701 database), the increase in validity does not seem to justify the cost of having more than 60 votes per condition.
Regarding the reliability, a similar picture arises. Both the confidence interval width and the inter-rater reliability do not substantially change with more than ratings per condition. Again, database 701 sticks out in that it has a higher inter-rater reliability score than the other two databases.
Regarding the observed differences between the databases, there are a number of factors which could be their cause. Database 501, for which the CS results showed the lowest correlation to the lab, contained Swiss-German samples, which were rated in Switzerland in the lab, whereas in the crowd most crowdworkers were from Germany (). Small language differences as well as different quality backgrounds (cf. the discussion about references in the introduction) might have caused the lower correlation. Database 701 showed the highest inter-rater reliability amongst all crowdsourcing experiments. When carrying out the respective experiment, a rather large proportion of workers was removed from the data, either because of self-reported hearing loss or because these workers answered incorrectly to an attention and device checking question. This rather strong cleansing of the data might have lead to the higher inter-rater reliability on the remaining data.
Overall, recommending to use at least 60 votes per test condition in a crowdsourcing speech quality assessment experiment seems to be a reasonable compromise between effort spent and both reliability and validity of the results.
References
- [1] U. Jekosch, Voice and Speech Quality Perception. Assessment and Evaluation. Berlin: Springer, 2005.
- [2] G. A. Lienert, Testaufbau und Testanalyse. Weinheim: Verlag Julius Beltz, 1989.
- [3] ITU-T Recommandation P.800, Methods for Subjective Determination of Transmission Quality. Geneva: International Telecommunication Union, 1996.
- [4] B. Naderi, T. Polzehl, I. Wechsung, F. Köster, and S. Möller, “Effect of Trapping Questions on the Reliability of Speech Quality Judgments in a Crowdsourcing Paradigm,” in Conference of the International Speech Communication Association, 2015.
- [5] T. Polzehl, B. Naderi, F. Köster, and S. Möller, “Robustness in speech quality assessment and temporal training expiry in mobile crowdsourcing environments,” in Conference of the International Speech Communication Association, 2015.
- [6] S. Egger-Lampl, J. Redi, T. Hoßfeld, M. Hirth, S. Möller, B. Naderi, C. Keimel, and D. Saupe, “Crowdsourcing Quality of Experience Experiments,” in Evaluation in the Crowd. Crowdsourcing and Human-Centered Experiments, D. Archambault, H. Purchase, and T. Hoßfeld, Eds. Cham: Springer International Publishing, 2017.
- [7] R. Zequeira Jiménez, L. Fernández Gallardo, and S. Möller, “Influence of Number of Stimuli for Subjective Speech Quality Assessment in Crowdsourcing,” in International Conference on Quality of Multimedia Experience, 2018.
- [8] ITU-T Recommandation P.808, Subjective Evaluation of Speech Quality with a Crowdsourcing Approach. Geneva: International Telecommunication Union, 2018.
- [9] ITU-T Recommandation P.863, Perceptual Objective Listening Quality Prediction. Geneva: International Telecommunication Union, 2018.
- [10] C. Smits, T. S. Kapteyn, and T. Houtgast, “Development and validation of an automatic speech-in-noise screening test by telephone,” International journal of audiology, vol. 43, no. 1, pp. 15–28, 2004.
- [11] T. Hossfeld, P. E. Heegaard, M. Varela, and L. Skorin-Kapov, “Confidence Interval Estimators for MOS Values,” arXiv preprint arXiv:1806.01126, 2018.
- [12] B. Efron, “Bootstrap Methods: Another Look at the Jackknife,” in Breakthroughs in Statistics. Springer, 1992.
- [13] T. Hoßfeld, R. Schatz, and S. Egger, “SOS: The MOS is not Enough!” in International Workshop on Quality of Multimedia Experience, 2011.