Carnegie Supernova Project-II: A new method to photometrically identify sub-types of extreme Type Ia Supernovae
Abstract
We present a new method to photometrically delineate between various sub-types of type Ia supernovae (SNe Ia). Using the color-stretch parameters, sBV or , and the time of -band primary maximum relative to the -band (t) or -band (t) maximum it is demonstrated that 2003fg-like, 1991bg-like, and 2002cx-like SNe Ia can readily be identified. In the cases of these extreme SNe Ia, their primary -band maximum occurs after the time of the or band maxima. We suggest that the timing of the -band maximum can reveal the physical state of the SN Ia explosion as it traces: i) the speed of the recombination front of iron group elements in the ejecta, ii) the temperature evolution and rate of adiabatic cooling in the ejecta and, iii) the presence of interaction with a stellar envelope. This photometric sub-typing can be used in conjunction with other SNe analysis, such as the Branch diagram, to examine the physics and diversity of SNe Ia. The results here can also be used to screen out non-Ia SNe from cosmological samples that do not have complete spectroscopic typing. Finally, as future surveys like LSST create large databases of light curves of many objects this photometric identification can be used to readily identify and study the rates and bulk properties of peculiar SNe Ia.
1 Introduction
Type Ia supernovae (SNe Ia) have revolutionized the study of an immense volume of the cosmos. To date they have been used to map out the expansion rate of the Universe, providing the first observational evidence that it is accelerating (Riess, et al., 1998; Perlmutter, et al., 1999). SNe Ia also provide a measure of the local Hubble constant (e.g., Burns, et al., 2018), constrain the dark energy equation-of-state parameter (e.g., Scolnic et al., 2018), and have the potential to map out the local distribution of dark matter through peculiar velocity studies (Feindtet al., 2015). Currently the use of SNe Ia as standardizable candles is not limited by sample size, but a complex matrix of subtle systematic errors, where the lack of understanding of SNe Ia physics and diversity contributes a major fraction of the total error budget (Betoule et al., 2014).
We now have a myriad of varieties of SNe Ia. Maximum light spectra have been used to classify normal SNe Ia into four sub-groups: core-normal, shallow silicon, cool, and broad line (Branch, et al., 2006). There are also many sub-types of SNe Ia including; i) the luminous 1991T-like SNe (Filippenko et al., 1992b; Phillips et al., 1992), ii) the sub-luminous 1991bg-like SNe (Filippenko et al., 1992a; Leibundgut et al., 1993), iii) the broad, but faint 2002cx-like SNe (Li et al., 2003; Foley, et al., 2013; Jha, 2017), iv) the over-luminous and possibly “Super-Chandrasekhar” mass SNe Ia, 2003fg-like SNe Ia (Howell et al., 2006; Hicken et al., 2007), iv) the 2002ic-like SNe Ia which show evidence of strong interaction with their circumstellar medium (Hamuy et al., 2003), v) and the 2006bt-like SNe Ia, which have broad, slowly declining light curves but lack a prominent secondary maximum in the band (Foley et al., 2010). Identifying the differences and diversity of SNe Ia is key if we are to improve upon their effectiveness as a multi-purpose cosmological tool and understand their diversity and progenitor scenarios.
Commonly, SNe Ia are classified using maximum light spectra. However, with just one spectrum it is often not possible to firmly identify to which sub-type of SNe Ia the object belongs. Furthermore, spectra require significant exposure times and it is not possible to obtain spectra of all transients. Current and future surveys, such as ZTF and LSST, scan the night sky with a daily cadence, and obtain light curves of many more supernovae than can be followed spectroscopically with current infrastructure.
Previous work has used the SNe Ia light curve fitter, SiFTO, in attempt to distinguish between SNe Ia sub-classes (González-Gaitán et al., 2014). Here we use multi-band light curve observations from the Carnegie Supernova Project I & II (CSP I & II) to present a new way to identify rare SNe that likely have a thermonuclear origin. We use direct observational parameters and concentrate on the -band as it shows the largest diversity among SNe Ia.
2 Observational Sample
The Carnegie Supernova Project I & II obtained an unprecedented sample of over 300 SNe Ia light curves on a stable and well-measured photometric system (Contreras, et al., 2010; Stritzinger et al., 2011; Krisciunas, et al., 2017; Phillips, et al., 2019; Hsiao, et al., 2019). Here, we consider a subset of these objects characterized by high-cadence , , , and -band light curve coverage. Photometric data from the CSP were obtained with the Swope telescope at Las Campanas Observatory, and reduced, calibrated and template subtracted following the procedures described in Krisciunas, et al. (2017) and Phillips, et al. (2019). Definitive light curve photometry from the CSP-I was published by Krisciunas, et al. (2017) and those from CSP-II will be published in the near future (Suntzeff et al., in prep).
The selection criteria for building the sub-sample examined in this work include: pre-maximum -band photometry, a clearly discernible time of maximum light, and photmetric coverage extending through 30 days past maximum. The normal SNe have an error on the time of maximum ([err]) less than 0.5 days, other SNe have [err]0.6 days, except for the 03fg-like objects which have a [err]2.5 d. A larger error budget was set for the peculiar SNe to ensure the sample sizes were large enough.
Following these requirements when using the -band we identify: 103 normal SNe Ia, 4 1991T-like, 6 03fg-like, 11 1991bg-like, 5 2002cx-like, and 2 2006bt-like SNe. When using the -band instead of the band the sample size is smaller. There are 60 normal, 0 1991T-like, 10 1991bg-like, 3 2003fg-like, and 5 2002cx-like SNe. Additionally, in both samples we have added 3 more 2003fg-like SNe Ia from the literature, which are SNe 2006gz (Hicken et al., 2007) , 2012dn (Taubenberger et al., 2019), and ASASSN-15pz (Chen, et al., 2019). All of the objects in the sample were spectroscopically classified to determine their sub-type.
We have corrected the SNe for Galactic extinction using values from Schlafly & Finkbeiner (2011), but not for host-galaxy extinction. The average redshift of the SNe in the sample is 0.030.02. Therefore, we have not performed K-corrections because all of our objects are low redshift (less than 0.1), therefore the effect on the time of maximum will be minimal. It is also non-trivial to compute K-corrections for peculiar SNe Ia sub-types until more spectra are available. However, the three non-CSP SNe were S-corrected to the natural CSP system, using the spectra of SN 2009dc. Finally, all of the light curves were converted to rest frame by scaling the number of days since maximum by .
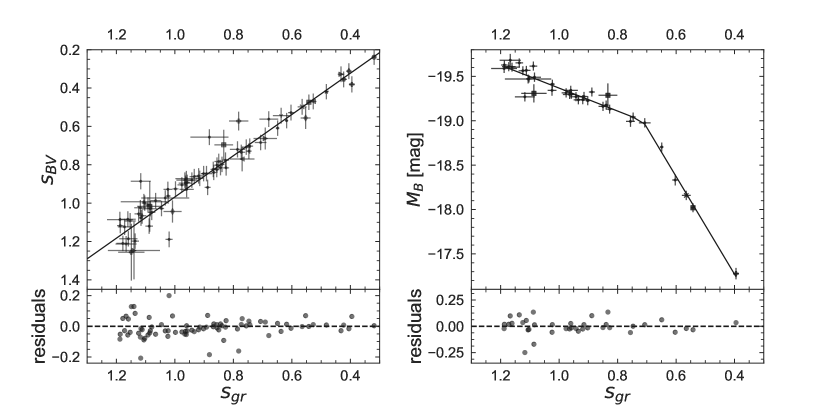
The parameters used in this analysis are the time of -band maximum relative to or maximum (t, t) and the colour-stretch parameters sBV and (Burns, et al., 2014). The color-stretch parameter, sBV, is dimensionless and defined as the time difference between -band maximum and the reddest point in the post-maximum color curve divided by 30 days, where typical SNe Ia have sBV1. The sBV values of the SNe were obtained from Gaussian Processes interpolation to the light curves. The Gaussian Processes interpolation accounts for uncertainties through its covariance function. As recent surveys are often limited to Sloan () filters, and lack the more extensive information obtained with the traditional Johnson () filters, we use a new parameter . corresponds to the time of () maximum relative to -band maximum, normalized by 30 days. is fitted using the same approach as sBV. Using 79 SNe Ia, we find a precise linear correlation between and sBV. The correlation is represented by:
| (1) |
with an RMS = 0.05, see the left panel of Figure 1. contains similar information as sBV. This is demonstrated in the right hand panel of Figure 1 where there is a strong correlation between and . This is similar to the trend seen between and sBV in Burns, et al. (2018). We find that a two-piece linear function fits the data best with a break at 0.71. The data were fit using the python package pwlf, where a global optimization algorithm was used to determine the best break point location by solving least squares fits. The best fit equations are given by
| (2) |
To determine t and t, the , , and -band light curves were fit with Gaussian Processes, where the errors are once again accounted for in the covariance function. The fitting process was performed using the Gaussian Processes function in SNooPy (Burns, et al., 2011). The SNe data were directly fit. No templates were used in the fitting procedure as they are not available for the extreme SNe Ia, and using normal SNe Ia templates would bias the values obtained.
3 Maximum light spectra
SNe Ia are dominated by line opacity. Where the elements in the ejecta and their ionization states determines what is observed. Understanding which lines are present in each sub-type can provide clues about the diversity which is seen in the light curves. Hence, in this section we discuss the differences in the maximum light spectra for each sub-type.
The maximum light spectra of all SNe Ia are dominated by intermediate mass and iron group elements and lack H and He features. All of the spectra prominently display the iconic Si ii 6355 feature. Therefore they all belong to the SNe Ia category and originate from the thermonuclear explosion of a white dwarf. All the various sub-types follow those commonalities, and each spectrum has its own peculiarities that set it apart from a CN (core-normal, Branch, et al. 2006) SN Ia. Below we discuss some of the differences.
At maximum light a normal SNe Ia spectrum mainly displays doubly and singly ionized species. Specifically; Ca ii 3968, 3933, Si ii 4130, Mg ii 4481, Si iii 4552, Fe ii 5196, Fe iii 5156, S ii 5453+5606, Si ii 5978 6355, O i 7771 and Ca ii 8498, 8542, 8662 (e.g., Branch, et al., 2006; Ashall, et al., 2018).
1991T-like SNe are brighter and hotter than normal SNe Ia, with features associated with doubly ionized Fe iii and Si iii. Due to this higher temperature 1991T-like SNe have a weak Si ii 6355 feature. This high ionization state has been suggested to be caused by a large amount of 56Ni in ejecta and heating of the photosphere (Phillips et al., 1992; Filippenko et al., 1992b).
SN 2003fg-like SNe are events which are as bright, and usually brighter, than normal SNe Ia. However, the ionization state of these SNe is much lower than that of a 1991T-like. They look remarkably like normal SNe Ia, with the exception that they exhibit weak Ca ii features (Taubenberger et al., 2019). They also have two strong C ii features at 6580 and 7234, which points to a large amount of unburnt material in the ejecta (Howell et al., 2006; Hicken et al., 2007). Hachinger et al. (2012) demonstrated that the ionization state of the ejecta does not correspond to the luminosity of these events, and concluded that there must be some additional source of energy, for example interaction with H/He deficient material, such as a stellar envelope.
2002cx-like are dominated by doubly ionized species, such as Fe iii, similar to that of 1991T-like events (Li et al., 2003; Phillips et al., 2007; Foley, et al., 2013). They are much less luminous and have low expansion velocities ranging from 2000–7000 km s-1(Jha, 2017).
Finally, the spectra of 1991bg-like SNe are dominated by singly ionized species, a large Si ii line ratio, a strong O i feature, and the appearance of a Ti ii feature at 4400Å (Filippenko et al., 1992a; Leibundgut et al., 1993). It has been been suggested that this is due to a temperature evolution from normal to 1991bg-like SNe Ia, where the less luminous SNe have less 56Ni, less heating, and therefore a lower ionization state (Nugent et al., 1995).
4 Results
4.1 Thermonuclear SNe
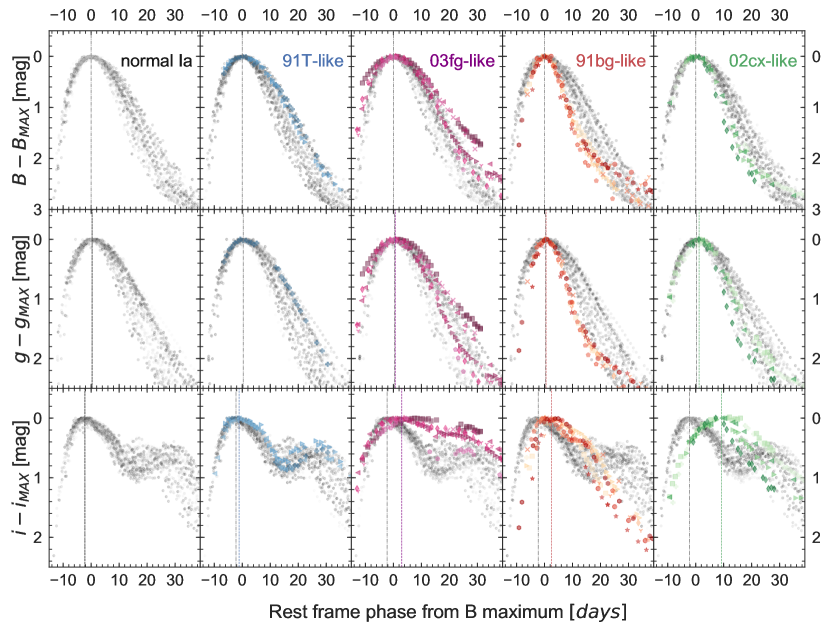
In Fig. 2 we present the -, -, and -band light curves of the SNe in our sample separated by sub-type, normalized in both flux and the time of the -band maximum. All of the normal SNe Ia exhibit a secondary -band maximum and the time of the primary -band maximum (-2.250.91d) occurs prior to the epoch of -band maximum. In the -band, 1991T-like SNe show a similar trend to the normal SNe Ia, but they tend to be broader than the normal SNe Ia population. They also have a prominent secondary -band maximum, and a primary -band maximum (-1.120.47d) that peaks before the -band maximum. However, there is need of more 1991T-like high cadence light curves to determine the significant of this behavior.
The 2003fg-like SNe Ia may have longer rise times than normal SNe Ia and on average, they also have broader -band light curves. In the band they differ significantly from normal objects. Their light curves are very broad and have a weak or no secondary maximum. Furthermore, the primary -band maximum (2.982.10d) occurs after the time of -band maximum.
The 1991bg-like SNe have -band light curves that decline faster than normal SNe Ia. In the band they also differ from normal SNe Ia in that their primary maximum (2.511.61 d) occurs after the time of -band maximum. In the -band, 2002cx-like SNe also decline rapidly, but less so than 1991bg-like SNe. In the band 2002cx-like SNe peak significantly later (9.171.85 d) compared to all other sub-types. Both 1991bg-like and 2002cx-like SNe do not exhibit a prominent -band secondary maxima.
Similar trends are seen in the timing of -band maximum relative to -band maximum. For normal and 1991T-like SNe, the timing of the -band primary maximum is before that of the -band maximum, and for 1991bg-like, 2002cx-like, and 2003fg-like SNe Ia the -band maximum is after that of the -band maximum.
The -band secondary maximum is thought to be produced when the photospheric radius reaches its maximum; after which a recombination front of iron group elements recedes through the ejecta (Höflich et al., 2002; Kasen, 2006; Jack et al., 2015). For normal SNe the opacity drop starts at about +20 days, therefore they have a clear secondary -band maximum. This timing of the secondary -band maximum is a function of luminosity, brighter SNe Ia have a later secondary -band maximum and later recombination of iron group elements due to increased opacity from higher temperatures and larger 56Ni masses synthesized in the explosion. For 1991bg-like SNe, less luminosity implies less heating and an earlier drop in the opacities. The opacity drop starts at maximum light and leads to the merging of the first and secondary -band maxima. Hence 1991bg-like SNe all have t.
The 2003fg-like SNe have t , and ionization states similar or lower than normal SNe Ia. Generally, they also show expansion velocities which are low at maximum light. For example the velocity of the Si ii 6355 feature was 7500 km s-1 at maximum light for SN 2009dc (Taubenberger et al., 2011). These objects do not show the -band break in the NIR spectra at +10 d, which occurs when the photosphere reaches the 56Ni rich region (Hoeflich, & Khokhlov, 1996; Wheeler et al., 1998; Hsiao et al., 2015; Ashall et al., 2019a, b). The variety of -band break for different sub-types of SNe Ia can be seem in Fig. 6 from Hsiao, et al. (2019). All of this may be an indication that these objects have a large mass of carbon, oxygen, or intermediate mass elements above the 56Ni layers. This envelope can effectively trap the gamma-rays produced from the 56Ni, leading to longer diffusion time scales and the recombination of iron group elements in the ejecta occurring over longer time scales.
The 2002cx-like SNe have high ionization states but -band light curves that peak significantly later than normal SNe Ia. 2002cx-like SNe have the lowest expansion velocities of all the SNe Ia, in the range of 2000-7000 km s-1, which may cause them to stay hot and highly ionized for a long time. It has been suggested that 2002cx-like SNe Ia come from a Chandrasekhar mass white dwarf progenitor that experiences a pulsational delayed detonation (Stritzinger et al., 2015). In this scenario the photosphere recedes through the ejecta quickly and only keeps the material just above the photosphere highly ionized. This produces the narrow lines, high ionization and lack of recombination of iron group elements leading to one -band maximum. Alternatively, it has been suggested that 2002cx-like SNe come from the partial deflagration of a white dwarf, where the ejecta is fully mixed. In this scenario the 56Ni in the outer layers produces the high ionization and a lack of recombination of iron group elements (Jha, 2017). Generally, the low expansion velocities, high ionization state, and broad light curves of these objects suggest that they have the longest diffusion time scales, which produces a slow temperature evolution and adiabatic cooling and is the cause of the large t.
The color stretch parameter, sBV, has successfully been used in conjunction with other observables to distinguish SNe Ia properties (Ashall, et al., 2018; Burns, et al., 2018). Fig. 3 shows sBV and as a function of t or t. All of the extreme SNe, except 1991T-like, are classified by having t d. They are also all located in distinct areas of this diagram 111It should be noted that this separation does not exist if using and the time of -band maximum relative to -band maximum.. Table 1 contains the parameters that can be used to identify these groups.
The 1991bg-like, 2003fg-like and 2002cx-like SNe are separated from the normal population, which points to different origins of these subclasses. It is worth addressing if there is a continuous distribution between most of the SNe Ia sub-types. For example, previous work has shown 1991bg-like SNe and normal SNe Ia come from a continuous distribution (Burns, et al., 2018; Ashall, et al., 2018). This is also seen in Fig. 3 where 1991bg-like SNe are located at the end of the distribution of normal SNe Ia. In fact, it could be argued that the division between 1991bg-like and normal SNe Ia is slightly arbitrary and purely determined by the presence of Ti ii and the ionization state seen in maximum light spectra. SN 2003fg-like objects are often thought to be their own distinct sub-type, and from Fig. 3 this appears to be true. The peculiar SN 2006bt has been suggested to be a connection between 2003fg-like SNe and normal SNe Ia (Foley et al., 2010), and its location in Fig. 3 fits with this conclusion. Finally, it seems that the 2002cx-like SNe are a distinct group, and possibly come from a totally different origin.
4.2 Core collapse SNe
The aim of this work is to produce a photometric sub-typing of SNe Ia, similar to that found with maximum light spectra in Branch, et al. (2006). However, it is also interesting to understand where core-collapse SNe are located in this parameter space, and to see if their location offers insights on the physics of the Ia subgroups. SNe II evolve over longer time scales than SNe Ia. For example SN 2012aw, a type II-SN, did not peak in until 90 days past -band maximum, which would give it an sBV of 3. The type II-L SN 2013ej peaked in the band at least 15 days after -band maximum. This places SNe II outside of both axes of Fig. 3. We also examined a type IIb (SN 1993J, Schmidt et al. 1993) which has sBV of 0.9 and t3, a Type Ib (SN 2009jf Valenti et al. 2011) which has sBV0.91 and t8, and a type Ic (SN 2016coi Prentice et al. 2018), that has sBV0.59 and t7. This places the Type IIb and Ib in the 2003fg-like area of Figure 3, and the Type Ic supernova in the 2002cx-like area of the Figure 3.
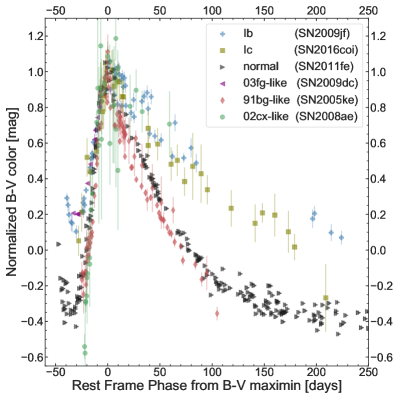
Some additional information which could lead to clues about the SNe Ia sub-types is the gradient of the or color curve after the color turnover. For normal, 1991bg-like, and some 2002cx-like SNe (e.g. SN 2008ae) the slope after the maximum is much steeper than for core collapse SNe. For example it takes SN 2011fe 80 days to change by one magnitude, whereas it takes 150 days for the type Ic SN 2016coi to change by the same amount, see Fig. 4. However, the gradients of the color curves of core collapse supernovae and 2003fg-like SNe are similar222It should be noted that the gradient of the color curve is also sensitive to the total-to-selective extinction ().. This may indicate that the photosphere is moving through ejecta with similar composition, probably a large carbon/oxygen rich layer. For the 2003fg-like SNe the interaction with this large H/He deficient envelope could also be the cause of the excess luminosity compared to normal SNe Ia (Hachinger et al., 2012).
Although not the aim of this work, the results here may also be used alongside absolute magnitude to photometrically classify transient sources. For example, most stripped-envelope supernovae reach peak -band absolute magnitudes of to (see Taddia et al., 2018, their Fig. 8). However, even the faintest 2003fg-like SNe from the CSP sample and the literature peak at –19.3 mag (Taubenberger et al., 2019), making 2003fg-like events consistently at least one magnitude more luminous. Therefore, a cutoff of mag could be used to separate core-collapse and 2003fg-like events. It should be noted that a larger sample of core collapse SNe needs to be examined to test the validity of these results. Also, further data of extreme SNe Ia will enable the robustness of this method to be determined.
| Sub-type | mean(sBV) | mean() | mean(t) | mean(t ) | Classification () | Classification () |
|---|---|---|---|---|---|---|
| normal | 0.95 0.17 | 0.96 0.16 | 2.25 0.91 | 2.81 0.76 | t and sBV0.5 | t and 0.6 |
| 91T-like | 1.17 0.04 | 1.12 0.47 | t and sBV1.1 | |||
| 03fg-like | 1.25 0.11 | 1.13 0.03 | 2.98 2.10 | 1.84 2.09 | t and sBV0.85 | t and 0.95 |
| 91bg-like | 0.41 0.10 | 0.47 0.10 | 2.51 1.61 | 2.14 1.59 | t and sBV0.6 | t and 0.7 |
| 02cx-like | 0.65 0.09 | 0.73 0.11 | 9.17 1.85 | 7.96 1.98 | t and sBV0.85 | t and 0.9 |
5 Conclusions
We present a new method to photometrically distinguish between sub-types of thermonuclear SNe. A set of -, -, and -band light curves of 103 normal SNe Ia, 4 1991T-like, 9 2003fg-like, 11 1991bg-like, 5 2002cx-like SNe, and 2 2006bt-like SNe have been used to demonstrate how the timing of the primary -band maximum provides a clear means to discriminate between SN sub-types.
The peculiar 2003fg-like, 1991bg-like, and 2002cx-like SNe have their primary peak in the -band later than that of the -band and -band. These sub-types also have a weak or no secondary -band maximum. Using the time of primary -band maximum in conjunction with the color stretch parameters, sBV or , it was found that normal, 2003fg-like, 1991bg-like, and 2002cx-like SNe fall into distinct photometric groups which correspond to their spectral classification.
We speculate that the timing of the -band maximum is potentially caused by multiple factors: i) 1991bg-like SNe have low 56Ni masses, low ionization and an early onset of the recombination front, which merges the two -band maxima normally seen in SNe Ia, ii) 2003fg-like SNe have a lack of secondary -band maximum which may be due to long diffusion time scales, caused by a large optically thick envelope around the 56Ni region, iii) and 2002cx-like SNe have a high ionization state, lack of recombination of iron group elements, and low expansion velocities, all of which produce a slow temperature evolution and an ejecta which slowly adiabatically cools. This may cause a lack of secondary -band maximum, and a later primary maximum.
Future surveys, such as LSST, will produce massive databases of high cadence light curves of SNe, and using the identification scheme presented here it will be possible to unambiguously identify the SNe Ia sub-type where there is poor, uncertain, or no spectral classification. The results here can also be used in conjunction with already existing spectral classifications, such as those from Branch, et al. (2006) to further refine our understanding of SNe Ia physics. This work can also be used as a guide line to screen out non-Ia SNe from cosmological samples that don’t have complete spectroscopic typing. Finally, as more sub-types of thermonuclear SNe are discovered, high cadence -band data can be used to determine their connection with the existing sub-types.
References
- Ashall et al. (2019a) Ashall, C., Hsiao, E. Y., Hoeflich, P., et al. 2019a, ApJ, 875, L14
- Ashall et al. (2019b) Ashall, C., Hoeflich, P., Hsiao, E. Y., et al. 2019b, ApJ, 878, 86
- Ashall, et al. (2018) Ashall C., et al., 2018, MNRAS, 477, 153
- Betoule et al. (2014) Betoule, M., Kessler, R., Guy, J., et al. 2014, A&A, 568, A22
- Branch, et al. (2006) Branch D., et al., 2006, PASP, 118, 560
- Burns, et al. (2018) Burns C. R., et al., 2018, ApJ, 869, 56
- Burns, et al. (2011) Burns C. R., et al., 2011, AJ, 141, 19
- Burns, et al. (2014) Burns C. R., et al., 2014, ApJ, 789, 32
- Chen, et al. (2019) Chen P., et al., 2019, ApJ, 880, 35
- Contreras, et al. (2010) Contreras C., et al., 2010, AJ, 139, 519
- Feindtet al. (2015) Feindt, U., Kerschhaggl, M., Kowalski, M., et al. 2015, A&A, 578, C1
- Filippenko et al. (1992a) Filippenko, A. V., Richmond, M. W., Branch, D., et al. 1992a, AJ, 104, 1543
- Filippenko et al. (1992b) Filippenko, A. V., Richmond, M. W., Matheson, T., et al. 1992b, ApJ, 384, L15
- Foley, et al. (2013) Foley R. J., et al., 2013, ApJ, 767, 57
- Foley et al. (2010) Foley, R. J., Narayan, G., Challis, P. J., et al. 2010, ApJ, 708, 1748
- Galbany et al. (2019) Galbany, L., Ashall, C., Höflich, P., et al. 2019, A&A, 630, A76
- González-Gaitán et al. (2014) González-Gaitán, S., Hsiao, E. Y., Pignata, G., et al. 2014, ApJ, 795, 142
- Hachinger et al. (2012) Hachinger, S., Mazzali, P. A., Taubenberger, S., et al. 2012, MNRAS, 427, 2057
- Hamuy et al. (2003) Hamuy, M., Phillips, M. M., Suntzeff, N. B., et al. 2003, Nature, 424, 651
- Hicken et al. (2007) Hicken, M., Garnavich, P. M., Prieto, J. L., et al. 2007, ApJ, 669, L17
- Höflich et al. (2002) Höflich, P., Gerardy, C. L., Fesen, R. A., et al. 2002, ApJ, 568, 791
- Hoeflich, & Khokhlov (1996) Hoeflich, P., & Khokhlov, A. 1996, ApJ, 457, 500
- Howell et al. (2006) Howell, D. A., Sullivan, M., Nugent, P. E., et al. 2006, Nature, 443, 308
- Hsiao, et al. (2019) Hsiao E. Y., et al., 2019, PASP, 131, 014002
- Hsiao et al. (2015) Hsiao, E. Y., Burns, C. R., Contreras, C., et al. 2015, A&A, 578, A9
- Jack et al. (2015) Jack, D., Baron, E., & Hauschildt, P. H. 2015, MNRAS, 449, 3581
- Jha (2017) Jha, S. W. 2017, Handbook of Supernovae, 375
- Kasen (2006) Kasen, D. 2006, ApJ, 649, 939
- Krisciunas, et al. (2017) Krisciunas K., et al., 2017, AJ, 154, 211
- Leibundgut et al. (1993) Leibundgut, B., Kirshner, R. P., Phillips, M. M., et al. 1993, AJ, 105, 301
- Li et al. (2003) Li, W., Filippenko, A. V., Chornock, R., et al. 2003, PASP, 115, 453
- Nugent et al. (1995) Nugent, P., Phillips, M., Baron, E., et al. 1995, ApJ, 455, L147
- Pereira et al. (2013) Pereira, R., Thomas, R. C., Aldering, G., et al. 2013, A&A, 554, A27
- Perlmutter, et al. (1999) Perlmutter S., et al., 1999, ApJ, 517, 565
- Phillips, et al. (2019) Phillips M. M., et al., 2019, PASP, 131, 014001
- Phillips et al. (2007) Phillips, M. M., Li, W., Frieman, J. A., et al. 2007, PASP, 119, 360
- Phillips et al. (1992) Phillips, M. M., Wells, L. A., Suntzeff, N. B., et al. 1992, AJ, 103, 1632
- Prentice et al. (2018) Prentice, S. J., Ashall, C., Mazzali, P. A., et al. 2018, MNRAS, 478, 4162
- Riess, et al. (1998) Riess A. G., et al., 1998, AJ, 116, 1009
- Schlafly & Finkbeiner (2011) Schlafly E. F., Finkbeiner D. P., 2011, ApJ, 737, 103
- Schmidt et al. (1993) Schmidt, B. P., Kirshner, R. P., Eastman, R. G., et al. 1993, Nature, 364, 600
- Scolnic et al. (2018) Scolnic, D. M., Jones, D. O., Rest, A., et al. 2018, ApJ, 859, 101
- Stritzinger et al. (2011) Stritzinger, M., Phillips, M. M., Contreras, C., et al. 2011, AJ, 142, 156
- Stritzinger et al. (2015) Stritzinger, M. D., Valenti, S., Hoeflich, P., et al. 2015, A&A, 573, A2
- Taddia et al. (2018) Taddia, F., Stritzinger, M. D., Bersten, M., et al. 2018, A&A, 609, A136
- Taubenberger et al. (2019) Taubenberger, S., Floers, A., Vogl, C., et al. 2019, MNRAS, 488, 5473
- Taubenberger et al. (2011) Taubenberger, S., Benetti, S., Childress, M., et al. 2011, MNRAS, 412, 2735
- Valenti et al. (2011) Valenti, S., Fraser, M., Benetti, S., et al. 2011, MNRAS, 416, 3138
- Wheeler et al. (1998) Wheeler, J. C., Höflich, P., Harkness, R. P., et al. 1998, ApJ, 496, 908
Appendix A table
Table 2 contains the parameters derived the from light curves of the SNe.
| SN name | redshift | SN type | |||||
|---|---|---|---|---|---|---|---|
| MJD | days | days | |||||
| SN2006bt | 0.032 | 53857.77 0.21 | 0.87 0.31 | 0.04 0.30 | 1.04 0.06 | 1.01 0.03 | 06bt-like |
| SN2006ot | 0.053 | 54065.68 | 2.8 | 0.83 | 06bt-like | ||
| ASAS14kd | 0.024 | 56981.76 0.21 | 0.98 0.33 | 1.13 0.04 | 91T-like | ||
| SN2014dl | 0.033 | 56934.65 0.09 | 1.31 0.14 | 1.22 0.04 | 91T-like | ||
| SN2014eg | 0.019 | 56991.26 0.47 | 0.56 0.58 | 1.17 0.04 | 91T-like | ||
| LSQ12gdj | 0.030 | 56252.17 0.25 | 1.65 0.27 | 1.14 0.04 | 91T-like | ||
| SN2007if | 0.074 | 54348.18 2.55 | 3.03 3.24 | 2.85 3.14 | 1.26 0.15 | 1.15 0.05 | 03fg-like |
| LSQ14fmg | 0.066 | 56938.71 0.58 | 1.51 1.05 | 1.20 0.08 | 03fg-like | ||
| ASASSN-15hy | 0.019 | 57150.67 0.33 | 7.28 0.47 | 5.97 0.65 | 1.24 0.18 | 03fg-like | |
| SN2013ao | 0.044 | 56362.11 0.11 | 1.80 0.26 | 3.24 0.69 | 1.02 0.13 | 1.09 0.04 | 03fg-like |
| MLS140102aaSN full name: MLS140102:120307-010132 | 0.077 | 56667.36 0.31 | 3.97 0.73 | 1.24bbThis lower limit was calculated using the sBV vs relation for the 03fg-like SNe. | 03fg-like | ||
| ASASSN-15pz | 0.000 | 57306.65 0.76 | 0.04 0.81 | 1.37 0.09 | 03fg-like | ||
| SN2012dn | 0.010 | 56132.59 0.59 | 2.04 0.61 | 0.55 1.50 | 1.25 0.15 | 1.14 0.09 | 03fg-like |
| SN2006gz | 0.024 | 54019.97 0.30 | 4.60 1.65 | 1.37 0.03 | 03fg-like | ||
| SN2009dc | 0.021 | 54946.94 0.21 | 2.52 0.34 | 1.91 0.49 | 1.29 0.07 | 03fg-like | |
| SN2012Z | 0.007 | 55967.22 0.23 | 10.50 0.60 | 8.60 0.60 | 0.57 0.05 | 0.78 0.03 | 02cx-like |
| PTF14ans | 0.032 | 56781.76 0.31 | 10.85 0.65 | 10.18 0.58 | 0.70 0.08 | 0.83 0.03 | 02cx-like |
| SN2014ek | 0.023 | 56957.39 0.25 | 8.08 0.37 | 6.50 0.32 | 0.66 0.06 | 0.69 0.04 | 02cx-like |
| SN2005hk | 0.013 | 53684.62 0.12 | 9.94 0.25 | 9.16 0.26 | 0.77 0.06 | 0.77 0.04 | 02cx-like |
| SN2008ha | 0.005 | 54781.89 0.37 | 6.47 0.39 | 5.36 0.19 | 0.56 0.06 | 0.55 0.02 | 02cx-like |
| LSQ14ip | 0.061 | 56688.06 0.150 | 0.71 0.214 | 0.50 0.041 | 91bg-like | ||
| KISS15m | 0.024 | 57143.68 0.180 | 4.02 0.211 | 3.49 0.121 | 0.38 0.042 | 0.40 0.010 | 91bg-like |
| SN2016hnk | 0.016 | 57689.48 3.27 | 1.60 0.20 | 0.44 0.03 | 91bg-like | ||
| SN2015bo | 0.016 | 57075.76 0.110 | 2.05 0.140 | 1.64 0.093 | 0.47 0.040 | 0.54 0.008 | 91bg-like |
| SN2009F | 0.013 | 54841.80 0.110 | 3.48 0.176 | 3.01 0.140 | 0.33 0.041 | 0.43 0.011 | 91bg-like |
| SN2008bt | 0.015 | 54571.98 0.200 | 0.65 0.397 | 0.23 0.347 | 0.47 0.041 | 0.53 0.011 | 91bg-like |
| SN2007N | 0.013 | 54123.46 0.250 | 4.60 0.322 | 4.18 0.213 | 0.31 0.041 | 0.41 0.010 | 91bg-like |
| SN2007ba | 0.039 | 54196.67 0.130 | 0.48 0.230 | 0.37 0.195 | 0.54 0.041 | 0.64 0.028 | 91bg-like |
| LSQ11pn | 0.033 | 55929.07 0.090 | 0.89 0.178 | 0.53 0.158 | 0.50 0.041 | 0.57 0.015 | 91bg-like |
| SN2007ax | 0.007 | 54187.75 0.110 | 4.17 0.210 | 3.63 0.180 | 0.36 0.041 | 0.42 0.011 | 91bg-like |
| SN2006mr | 0.006 | 54050.54 0.060 | 3.81 0.217 | 3.08 0.210 | 0.24 0.040 | 0.32 0.007 | 91bg-like |
| SN2005ke | 0.005 | 53698.39 0.080 | 2.80 0.205 | 1.95 0.190 | 0.42 0.040 | 0.48 0.007 | 91bg-like |
| LSQ15alq | 0.047 | 57154.13 0.20 | 2.15 0.22 | 0.91 0.04 | normal | ||
| PS1-14rx | 0.067 | 56736.32 0.29 | 2.48 0.43 | 0.83 0.04 | normal | ||
| PTF11pbp | 0.029 | 55871.42 0.18 | 2.09 0.23 | 1.19 0.04 | normal | ||
| PTF13anh | 0.062 | 56413.56 0.16 | 1.56 0.23 | 0.96 0.04 | normal | ||
| PTF13duj | 0.017 | 56601.23 0.19 | 0.93 0.31 | 1.19 0.04 | normal | ||
| PTF13ebh | 0.013 | 56622.90 0.08 | 1.30 0.11 | 1.83 0.09 | 0.61 0.04 | 0.65 0.01 | normal |
| PTF13efe | 0.075 | 56640.64 0.31 | 1.22 0.46 | 1.23 0.04 | normal | ||
| PTF14aaf | 0.059 | 56739.46 0.43 | 0.13 0.49 | 1.19 0.04 | normal | ||
| PTF14aje | 0.028 | 56757.99 0.27 | 1.26 0.31 | 1.88 0.18 | 0.68 0.04 | 0.71 0.02 | normal |
| PTF14fpg | 0.034 | 56930.56 0.27 | 2.20 0.35 | 2.89 0.24 | 1.21 0.04 | 1.17 0.04 | normal |
| LSQ14xi | 0.051 | 56719.97 0.31 | 2.04 0.37 | 1.10 0.04 | normal | ||
| LSQ14wp | 0.070 | 56716.98 0.19 | 2.81 0.49 | 2.72 0.46 | 1.12 0.04 | 1.17 0.02 | normal |
| LSQ14mc | 0.057 | 56696.88 0.21 | 3.62 0.26 | 0.95 0.04 | normal | ||
| PTF14gnl | 0.054 | 56956.29 0.41 | 2.91 0.40 | 1.04 0.04 | normal | ||
| LSQ13dsm | 0.042 | 56670.15 0.26 | 2.69 0.27 | 2.59 0.11 | 0.88 0.04 | 0.94 0.02 | normal |
| LSQ13ry | 0.030 | 56395.38 0.18 | 2.84 0.20 | 2.91 0.09 | 0.86 0.04 | 0.93 0.02 | normal |
| LSQ14age | 0.081 | 56734.76 0.49 | 0.68 0.53 | 1.12 0.05 | normal | ||
| LSQ14q | 0.067 | 56672.60 0.29 | 2.21 0.31 | 0.94 0.04 | normal | ||
| LSQ14ahm | 0.050 | 56736.19 0.45 | 2.29 0.47 | 1.23 0.04 | normal | ||
| LSQ14foj | 0.046 | 56939.65 0.25 | 0.99 0.30 | 1.05 0.04 | normal | ||
| LSQ14fom | 0.056 | 56937.59 0.16 | 2.25 0.24 | 0.92 0.04 | normal | ||
| LSQ14gov | 0.090 | 57027.74 0.18 | 2.58 0.29 | 1.11 0.04 | normal | ||
| LSQ14ie | 0.090 | 56687.97 0.30 | 2.09 0.50 | 1.22 0.04 | normal | ||
| SN2005W | 0.009 | 53411.33 0.25 | 2.29 0.27 | 0.92 0.04 | normal | ||
| LSQ14jp | 0.045 | 56692.21 0.11 | 0.49 0.13 | 0.64 0.04 | normal | ||
| SN2007bd | 0.031 | 54206.29 0.24 | 3.53 0.31 | 3.98 0.21 | 0.88 0.04 | 0.97 0.03 | normal |
| LSq13dpm | 0.051 | 56656.91 0.15 | 2.76 0.25 | 1.07 0.04 | normal | ||
| SN2004eo | 0.016 | 53278.24 0.11 | 2.90 0.12 | 3.50 0.08 | 0.82 0.04 | 0.87 0.01 | normal |
| SN2004ey | 0.016 | 53303.73 0.13 | 2.98 0.16 | 3.37 0.10 | 1.01 0.04 | 1.09 0.01 | normal |
| SN2004gs | 0.027 | 53355.92 0.13 | 1.90 0.40 | 2.28 0.38 | 0.70 0.04 | 0.74 0.01 | normal |
| SN2005el | 0.015 | 53647.02 0.45 | 3.04 0.49 | 2.86 0.20 | 0.84 0.04 | 0.87 0.01 | normal |
| SN2005iq | 0.034 | 53687.36 0.05 | 3.14 0.12 | 3.37 0.11 | 0.87 0.04 | 0.96 0.04 | normal |
| SN2005kc | 0.015 | 53697.61 0.16 | 3.05 0.21 | 0.90 0.04 | normal | ||
| SN2015F | 0.005 | 57106.46 0.26 | 2.47 0.31 | 2.88 0.18 | 0.85 0.04 | 0.9 0.01 | normal |
| SN2014I | 0.030 | 56683.53 0.14 | 2.65 0.17 | 2.69 0.11 | 0.90 0.04 | 0.96 0.02 | normal |
| SN2005ki | 0.019 | 53704.75 0.14 | 2.97 0.27 | 3.67 0.24 | 0.83 0.04 | 0.86 0.01 | normal |
| SN2014at | 0.032 | 56774.07 0.17 | 3.44 0.32 | 3.29 0.27 | 0.93 0.04 | 1.02 0.02 | normal |
| SN2013M | 0.035 | 56323.28 0.28 | 1.89 0.33 | 2.00 0.20 | 0.93 0.04 | 0.96 0.02 | normal |
| SN2013H | 0.016 | 56309.43 0.18 | 2.99 0.20 | 3.34 0.11 | 1.06 0.04 | 1.12 0.01 | normal |
| PTF14w | 0.019 | 56669.55 0.17 | 2.21 0.19 | 2.59 0.10 | 0.73 0.04 | 0.75 0.01 | normal |
| SN2013gy | 0.014 | 56648.71 0.15 | 2.89 0.16 | 2.96 0.09 | 0.89 0.04 | 0.96 0.01 | normal |
| SN2013E | 0.009 | 56307.38 0.22 | 2.54 0.24 | 3.40 0.10 | 1.12 0.04 | 1.09 0.01 | normal |
| SN2005M | 0.022 | 53405.50 0.19 | 2.93 0.21 | 3.03 0.09 | 1.21 0.04 | 1.18 0.02 | normal |
| SN2013aj | 0.009 | 56361.45 0.27 | 3.42 0.39 | 3.46 0.28 | 0.78 0.04 | 0.83 0.01 | normal |
| SN2013aa | 0.004 | 56343.15 0.20 | 3.63 0.34 | 3.76 0.28 | 1.00 0.04 | 1.1 0.01 | normal |
| SN2012ij | 0.011 | 56302.33 0.10 | 0.06 0.16 | 0.54 0.13 | 0.53 0.04 | 0.6 0.01 | normal |
| SN2012ht | 0.004 | 56295.22 0.39 | 1.81 0.42 | 2.18 0.19 | 0.86 0.04 | 0.92 0.02 | normal |
| SN2012hr | 0.008 | 56288.72 0.22 | 3.04 0.23 | 3.28 0.09 | 0.96 0.04 | 1.02 0.01 | normal |
| SN2012hd | 0.012 | 56264.97 0.14 | 2.44 0.18 | 2.82 0.11 | 0.87 0.04 | 0.92 0.01 | normal |
| SN2012gm | 0.015 | 56261.79 0.08 | 3.29 0.11 | 0.98 0.04 | normal | ||
| SN2012fr | 0.006 | 56242.28 0.34 | 2.67 0.42 | 2.91 0.26 | 1.12 0.04 | 1.19 0.01 | normal |
| SN2011jh | 0.008 | 55930.21 0.12 | 2.16 0.13 | 2.93 0.07 | 0.80 0.04 | 0.84 0.01 | normal |
| PTF14yy | 0.043 | 56732.58 0.19 | 0.87 0.24 | 0.82 0.04 | normal | ||
| SN2013fy | 0.031 | 56600.55 0.22 | 0.24 0.28 | 1.19 0.04 | normal | ||
| SN2006gj | 0.028 | 54000.06 0.22 | 0.91 0.43 | 1.44 0.38 | 0.66 0.04 | 0.88 0.07 | normal |
| ASAS14jz | 0.016 | 56980.56 0.08 | 2.79 0.14 | 0.98 0.04 | normal | ||
| ASAS14hu | 0.022 | 56935.05 0.20 | 2.60 0.29 | 2.58 0.22 | 1.08 0.04 | 1.16 0.03 | normal |
| ASAS14hr | 0.034 | 56932.12 0.21 | 1.03 0.29 | 1.21 0.22 | 0.78 0.04 | 0.85 0.02 | normal |
| ASAS14ad | 0.026 | 56691.61 0.15 | 2.12 0.18 | 2.89 0.11 | 1.03 0.04 | 1.08 0.02 | normal |
| SN2006gt | 0.045 | 54003.00 0.20 | 0.81 0.24 | 1.23 0.15 | 0.56 0.04 | 0.68 0.03 | normal |
| SN2006kf | 0.021 | 54041.03 0.16 | 2.43 0.19 | 2.81 0.12 | 0.74 0.04 | 0.77 0.01 | normal |
| SN2009Y | 0.009 | 54875.37 0.20 | 1.51 0.27 | 2.57 0.20 | 1.19 0.04 | 1.02 0.01 | normal |
| SN2009ds | 0.019 | 54960.03 0.16 | 1.90 0.33 | 1.13 0.05 | normal | ||
| SN2009D | 0.025 | 54840.61 0.32 | 3.04 0.35 | 3.20 0.15 | 1.19 0.04 | 1.16 0.03 | normal |
| SN2009cz | 0.021 | 54942.31 0.18 | 2.82 0.22 | 1.19 0.04 | normal | ||
| SN2009ad | 0.028 | 54885.59 0.16 | 2.87 0.18 | 1.02 0.04 | normal | ||
| SN2009ab | 0.011 | 54882.94 0.19 | 3.15 0.20 | 0.87 0.04 | normal | ||
| SN2007ca | 0.014 | 54226.95 0.25 | 2.94 0.33 | 1.06 0.04 | normal | ||
| SN2007le | 0.007 | 54398.40 0.36 | 2.19 0.39 | 2.80 0.16 | 1.03 0.04 | 1.05 0.01 | normal |
| SN2007af | 0.006 | 54174.07 0.24 | 2.84 0.28 | 3.12 0.14 | 0.93 0.04 | 1.0 0.01 | normal |
| SN2007on | 0.007 | 54420.16 0.09 | 1.99 0.22 | 2.03 0.20 | 0.57 0.04 | 0.62 0.01 | normal |
| SN2008bf | 0.024 | 54554.46 0.22 | 3.74 0.28 | 3.81 0.18 | 1.02 0.04 | 1.12 0.02 | normal |
| SN2006ob | 0.059 | 54062.95 0.20 | 1.20 0.41 | 1.69 0.36 | 0.72 0.04 | 0.79 0.03 | normal |
| SN2008fp | 0.006 | 54729.53 0.29 | 2.25 0.31 | 2.91 0.11 | 1.08 0.04 | 1.12 0.01 | normal |
| SN2008gp | 0.033 | 54778.82 0.24 | 3.67 0.26 | 3.74 0.13 | 0.97 0.04 | 1.03 0.08 | normal |
| SN2008hj | 0.038 | 54800.83 0.14 | 2.79 0.19 | 1.01 0.04 | normal | ||
| SN2008hv | 0.013 | 54816.74 0.28 | 3.53 0.30 | 4.00 0.11 | 0.85 0.04 | 0.89 0.02 | normal |
| SN2008bc | 0.015 | 54548.83 0.17 | 2.66 0.21 | 3.28 0.13 | 1.05 0.04 | 1.08 0.01 | normal |
| LSQ13dkp | 0.069 | 56641.97 0.14 | 1.71 0.29 | 0.63 0.04 | normal | ||
| ASAS14me | 0.018 | 57019.67 0.19 | 2.92 0.20 | 2.88 0.09 | 1.09 0.04 | 1.19 0.04 | normal |
| LSQ13cwp | 0.067 | 56611.57 0.32 | 0.75 0.41 | 0.91 0.05 | normal | ||
| LSQ13aiz | 0.009 | 56437.25 0.14 | 0.82 0.21 | 0.96 0.04 | normal | ||
| LSQ12hzs | 0.072 | 56298.56 0.16 | 2.12 0.27 | 1.09 0.05 | normal | ||
| LSQ12gxj | 0.036 | 56274.88 0.17 | 2.36 0.23 | 1.10 0.04 | normal | ||
| SN2006ax | 0.017 | 53827.11 0.25 | 3.26 0.29 | 3.06 0.16 | 0.99 0.04 | 1.07 0.02 | normal |
| LSQ12fxd | 0.031 | 56246.07 0.19 | 2.52 0.31 | 1.10 0.04 | normal | ||
| LSQ12fvl | 0.056 | 56239.83 0.11 | 0.00 0.22 | 0.59 0.04 | normal | ||
| LSQ12bld | 0.083 | 56025.04 0.32 | 2.09 0.36 | 0.85 0.04 | normal | ||
| SN2006bh | 0.011 | 53833.31 0.11 | 3.59 0.23 | 3.72 0.20 | 0.80 0.04 | 0.86 0.01 | normal |
| SN2006D | 0.009 | 53757.35 0.14 | 2.56 0.19 | 2.83 0.13 | 0.82 0.04 | 0.84 0.01 | normal |
| KISS13v | 0.080 | 56395.62 0.13 | 0.23 0.31 | 1.03 0.05 | normal | ||
| PSN 13-24ccSN full name: PSN J13471211-2422171 | 0.020 | 57069.77 0.21 | 0.77 0.51 | 1.14 0.47 | 0.71 0.04 | 0.76 0.02 | normal |
| SN2006et | 0.022 | 53993.16 0.14 | 2.68 0.18 | 2.98 0.12 | 1.09 0.04 | 1.15 0.02 | normal |
| ASAS14mw | 0.027 | 57028.20 0.18 | 3.05 0.42 | 3.83 0.38 | 1.07 0.04 | 1.11 0.01 | normal |
| ASAS14my | 0.021 | 57029.99 0.27 | 2.08 0.30 | 2.82 0.16 | 0.91 0.04 | 0.98 0.02 | normal |
| ASAS15be | 0.022 | 57048.59 0.29 | 1.42 0.44 | 2.23 0.34 | 1.20 0.04 | 1.14 0.01 | normal |
| ASAS15bm | 0.021 | 57053.21 0.31 | 2.26 0.37 | 3.11 0.22 | 0.99 0.04 | 1.11 0.08 | normal |
| ASAS14lw | 0.021 | 57012.25 0.40 | 2.26 0.41 | 1.26 0.04 | normal | ||
| CSS120305ddSN full name: CSS120325:123816-150632 | 0.097 | 56022.06 0.20 | 2.42 0.34 | 1.11 0.04 | normal | ||
| CSS130303eeSN full name: CSS130303:105206-133424 | 0.079 | 56364.02 0.38 | 1.57 0.43 | 1.19 0.04 | normal | ||
| OGLE14-019ffSN full name: OGLE-2014-SN-019 | 0.036 | 56718.28 0.25 | 2.06 0.34 | 1.67 0.28 | 0.89 0.04 | 1.12 0.03 | normal |
| ASAS15hf | 0.006 | 57136.89 0.13 | 2.67 0.23 | 3.26 0.19 | 0.92 0.04 | 0.89 0.01 | normal |
| SN2004ef | 0.031 | 53263.77 0.12 | 3.32 0.12 | 3.70 0.04 | 0.82 0.04 | 0.83 0.01 | normal |