Dark matter haloes in the multicomponent model. III. From dwarfs to galaxy clusters
Abstract
A possibility of DM being multicomponent has a strong implication on resolving decades-long known cosmological problems on small scale. In addition to elastic scattering, the model allows for inelastic interactions, which can be characterized by a ‘velocity kick’ parameter. The simplest 2cDM model with cross section and the kick velocity has been shown to robustly resolve the missing satellites, core-cusp, and too-big-to-fail problems in -body cosmological simulations tested on MW-like haloes of a virial mass M⊙ (Paper I II). With the aim of further constraining the parameter space available for the 2cDM model, we extend our analysis to dwarf and galaxy cluster haloes with their virial mass of and M⊙, respectively. We find cm2g-1is preferentially disfavored for both dwarfs and galaxy cluster haloes in comparison with observations, while cm2g-1causes little perceptible difference from that of the CDM counterpart for most of the cross section’s velocity dependence studied in this work. Our main result is that within the reasonable set of parameters the 2cDM model can successfully explain the observational trends seen in dwarf galaxy and galaxy cluster haloes and the model leaves us an open window for other possible alternative DM models.
keywords:
cosmology: theory – methods: numerical – self-interacting dark matter – galaxies: formation1 Introduction
The success of the collisionless CDM paradigm on the large-scale structure formation has made it the standard model of cosmology. The CDM-based simulations (e.g., Springel et al. 2005, 2008; Diemand et al. 2008; Stadel et al. 2009; Klypin et al. 2011) have consistently shown remarkable agreement with observations on the large scale structure (e.g., Tegmark et al. 2006; Hinshaw et al. 2013) and the model has thus far served as a strong foundation for studying many branches of astrophysical phenomena both in observational and theoretical fields, providing us deeper and enriching insights into the large-scale structure formation process. From the other side, however, the CDM model has faced outstanding challenges. An -body CDM simulation is known to produce centrally-concentrated haloes (Dubinski & Carlberg 1991) in which the halo density profiles have a characteristic cuspy inner profile () that is self-similar across a wide halo mass range (e.g., Prada et al. 2012; Dutton & Macciò 2014), and can be well described by a Navarro-Frenk-White profile (NFW) (Navarro et al. 1996b, 1997). The observations, on the other hand, have shown that cored profiles with shallow inner density slope in tend to be favored in dwarf galaxies (Swaters et al. 2003; de Blok 2010; Walker & Peñarrubia 2011; Kuzio de Naray & Kaufmann 2011; Oh et al. 2015). Related to this, the CDM-predicted haloes hosting dwarf galaxies (or massive subhaloes) in the Local Group type of environment in simulations are significantly larger and more centrally-concentrated compared to observations, known as the Too-big-to-fail problem (TBTF) (Boylan-Kolchin et al. 2011; Tollerud et al. 2014; Garrison-Kimmel et al. 2014; Papastergis et al. 2015). The CDM model is also known to produce an excessive number of subhaloes around such environment in simulations compared to observations (missing satellites problem) (Klypin et al. 1999; Moore et al. 1999).
One of the favored solutions to the small-scale problems without disregarding the success of the CDM on the large scale revolves around baryonic physics. The radiative and thermal energy output originating from the stellar feedback, including star formation and supernovae (SN) feedback could produce perturbations which disrupt and modify the gravitational potential of the central part of dwarf galaxy haloes. Earlier numerical studies predicted that removal of baryonic contents in the halo center by such means could lead to the formation of a cored DM profile (Navarro et al. 1996b). For instance, hydrodynamical simulations that employ a bursty, stellar feedback with repeated gas outflows produced by SN explosions have shown to transform the cuspy inner profile to a shallower one, thus resolving the core-cusp problem (Read & Gilmore 2005; Governato et al. 2012; Pontzen & Governato 2012; Teyssier et al. 2013; Read et al. 2016; Tollet et al. 2016). The gas outflows as a result of the starbursts at higher redshift in dwarf galaxies have also been observationally implied (van der Wel et al. 2011). Meanwhile, some studies have shown the consideration of baryon and baryonic feedback are insufficient to account for the full resolution to the problems (e.g., di Cintio et al. 2011; Kuzio de Naray & Spekkens 2011; Parry et al. 2012).
The baryonic processes could also be a solution to the missing satellites problem. It has been proposed that in combination with stellar feedback and heating from reionization and UV background could alleviate the problems (e.g., Simpson et al. 2013; Oñorbe et al. 2015), while some studies show such effects are insufficient (Papastergis & Shankar 2016). In particular, an important role played by tidal disruption or ram pressure stripping in addition to the stellar feedback by means of removing baryonic matter from dwarf galaxies has been proposed as a solution to reconcile the problem (Brooks et al. 2013; Sawala et al. 2013; Arraki et al. 2014; Brooks & Zolotov 2014; Sawala et al. 2016; Wetzel et al. 2016; Sawala et al. 2017). In the meantime, Trujillo-Gomez et al. (2016) recently showed even with an assumption of maximal feedback effect the discrepancy in the abundance of the satellite galaxies cannot be fully reconciled. Taking into account baryonic processes could also be the key to solve the TBTF problem (e.g., Madau et al. 2014; Brook & Di Cintio 2015); but see Garrison-Kimmel et al. (2013); Papastergis et al. (2015). Aside from baryons, the DM physics itself might provide an alternative solution to the small-scale problems. As pointed out by Garrison-Kimmel et al. (2013), simultaneously resolving the intertwined small scale problems by baryonic processes alone still poses a challenge to the CDM paradigm. A plethora of DM models have therefore been proposed without necessitating an extensive modification to the conventional CDM model. Particularly interesting is the SIDM model which allows elastic scattering between DM in non-relativistic regime (Spergel & Steinhardt 2000). Studies have shown that the inclusion of self-interactions of DM particles induces the creation of cores in the density profile of low-mass haloes, resolving the core-cusp problem with or without the need for baryonic processes (e.g., Davé et al. 2001; Loeb & Weiner 2011; Rocha et al. 2013; Vogelsberger et al. 2014; Fry et al. 2015; Elbert et al. 2015). Recent work by Kamada et al. (2017) showed analytically that the observed diversity of the rotation curves from low-mass to spiral galaxies can also be addressed by the SIDM scheme.
The -component DM model (cDM) with both elastic and inelastic interactions in the dark sector is a very promising extension of the CDM model. The model was first proposed as a self-interacting flavor-mixed DM (fmDM) (Medvedev 2000, 2001a, 2001b, 2001c) in the context of dark matter halo evolution as a way to resolve the substructure problem. The inelastic DM (iDM) and exothermic DM (exDM) models were introduced in the context of the direct detection DM experiments (Smith & Weiner 2001; Graham et al. 2010; McCullough & Randall 2013). The excited DM (eDM) was proposed in the context of 511 keV signal in the Galaxy (Finkbeiner & Weiner 2007). Despite differences in physics of interactions in the dark sector and different evolution in the early universe, these models share much in common. They all postulate (i) the existence of more than one species, either different ”mass eigenstates” (in fmDM) or “excited and ground states” (in iDM, eDM, exDM), (ii) the sufficiently large DM-DM cross sections while matter-DM interactions are of much smaller strength, (iii) the possibility of inter-conversion of the ‘species’ in inelastic interactions which can release/absorb energy of (in fmDM) or (in iDM, eDM, exDM). These models have nearly identical implementation in cosmological -body codes, e.g., in GADGET (Medvedev 2014b; Todoroki & Medvedev 2019a) and AREPO (Vogelsberger et al. 2016; Vogelsberger et al. 2019).
The 2cDM model is the simplest realization of the cDM. It is particularly interesting because it can resolve all the problems simultaneously, yet it does not violate all known constraints (Medvedev 2010a, b, 2014a, 2014b). To our knowledge, 2cDM is the only model that (i) reproduces observational data, (ii) does not contradict available observational constraints and (iii) successfully and naturally evades the early universe constraint (Medvedev 2014a), i.e., the Boltzmann suppression of the abundance of ‘excited’ states after freeze-out.
The 2cDM model is characterized by the elastic (scattering) and inelastic (conversion) cross sections, and , which can be velocity-dependent, and the energy difference, or , between the two species. Numerical DM-only simulations demonstrate that (or ), that is in order not to modify the large-scale structure formation (Medvedev 2014b). It also appears that cosmological simulations can constrain the normalized values only: , and . It is also convenient to introduce a characteristic velocity ; we will use along with . The 2cDM model’s detailed theoretical foundations are described in Medvedev (2010a, b, 2014a). Note also that SIDM is automatically included in cDM and corresponds to and .
In Todoroki & Medvedev (2019a, b) (correspondingly, Paper I and II), we introduced a simplistic 2cDM model, which incorporates two physical processes to the CDM paradigm: (i) the hard-sphere elastic scattering and (ii) inelastic mass conversion between two DM-species, labeled as heavy and light (Medvedev 2000, 2001a, 2001b, 2001c, 2010a, 2014a, 2014b). In the model the DM cross section is generally assumed to be velocity-dependent, which arises from the quantum mechanical formalism. Such cross section’s velocity-dependence has been implied as a viable possibility in simulations (Colín et al. 2002; Vogelsberger et al. 2012; Zavala et al. 2013; Kaplinghat et al. 2016). Similarly, the 2cDM model assumes the velocity-dependent cross section for the two separate physical processes (i) (ii) mentioned above as
| (1) |
where and are the power-law indices of the elastic scattering and the inelastic mass conversion processes, respectively, km s-1 is the velocity normalization, and the coefficient is parametrized by expressing it in terms of the cross section per unit mass, , in cm2g-1. The () prefactor, or -prefactor (or -prefactor), which is the ratio of the initial to the final momenta of the interacting particle, arises for the mass conversion to take into account the quantum mechanical detailed balance in the forward and reverse interaction probabilities. This prefactor explicitly appears in all cases, except for () = ().
Following Medvedev (2014b), we use the kick velocity parameter of . This kick velocity depicts the boosted velocity of the light particle that was converted from the heavy partner after the mass conversion takes place. That is, with the mass degeneracy, we have a non-relativistic kick velocity, whereas a relativistic kick velocity is in principle possible if the difference of the two masses are assumed large.
In Paper I II, the 2cDM model was tested on MW-like haloes in -body cosmological numerical simulations and a set of the model parameters were explored. We showed that the 2cDM effectively resolves the small-scale problems, namely the (i) missing satellites, (ii) too-big-to-fail, and (iii) core-cusp problems with most of the available parameters. To address these problems and constrain the model parameter space, the internal structure of the DM haloes and the abundance of the subhaloes were examined by looking at the halo density profiles and maximum circular velocity functions (or velocity functions for simplicity). Comparing with observations, we found that cases with the power-law indices of the velocity-dependent cross section of () with or , the self-interacting DM cross section per unit mass of [cm2g-1] and km s-1 can effectively solve the small-scale problems, while km s-1 fails to do so when the model is tested on an environment similar to the Local Group.
Note however that these work did not consider the effect of baryonic feedback and the gas dynamics, which are non-negligible and important especially in the formation and evolution process of the MW-type halo given the large relative abundance of the luminous mass (i.e., lower mass-to-light ratio). Despite the lack of statistical samples, the parameter space for the 2cDM model was extensively explored, and their studies comprise strong implications that self-interacting, multicomponent DM model is a possibility without spoiling the success of CDM on large scale.
In this Paper III, our objective is to further extend the studies presented in Paper I II to investigate the effect of 2cDM physics to the dwarf and galaxy cluster-sized haloes. That is, it is important to investigate whether the 2cDM model can still solve the small-scale problems across many orders of magnitude in halo mass and further deduce a tighter constraint on the set of parameters that can be compatible with observations. For the ”dwarf” simulations, we focus on the internal structure of the DM haloes by examining the DM density profiles. For the galaxy cluster (GC) simulations, we examine a sample of GC haloes and study their internal structure by looking at both the density profiles and the fitting parameters. For this, we only focus on a particular set of parameters that are not ruled out by the dwarf simulations and the MW-sized simulations.
The paper is structured as follows. In Section 2, we describe the simulation setup for both dwarfs and GCs. In Section 3 we examine the inner structure of the DM haloes and explore the fitting parameters in comparison with observations. Further, we also present a quantitative measure on the DM velocity distributions on the radial range and the mass loss due to the inelastic mass conversion of the 2cDM model. Section 4 is dedicated to the GC simulations where we examine the DM halo density profiles and the fitting parameters to see whether the results of the 2cDM model meets the observational expectations. In Section 6, we summarize our findings and provide future prospects on the multicomponent DM model and the constrains on its parameter space.
2 Simulations
As discussed in Paper I II, we used the same set of numerical techniques by implementing the 2cDM model in the TreePM/SPH code GADGET-3 (Springel 2005; Springel et al. 2008) on -body cosmological simulations. In this work, we used two initial conditions for the Dwarf and GC simulations. The cosmological parameters were chosen to be consistent with Planck Collaboration et al. (2015), where , , , , , and the normalized Hubble constant . All simulations start at the initial redshift of and run down to the current time of . For identifying the haloes and extracting their halo properties, we used the Amiga Halo Finder (AHF) (Knollmann & Knebe 2009).
| Dwarf | GC | |
|---|---|---|
| Mvir [M⊙] | ||
| of halo sample | 5 | 18-21 |
| Box size [Mpc] | 0.3 | 50 |
| 2243 | 3843 | |
| [kpc] | 0.046 | 4.5 |
| [M⊙] | 309 | 2.8 |
In our simulations, each simulation particle is a macroscopic representation of an ensemble of DM particles. We call this ensemble a simulation particle or simply ’particle’. Each of this particle is given a fixed mass, which is primarily determined by the simulation setup, such as the cosmological parameters, the total number of simulation particles, and the size of the simulation box used.
For the purpose of studying the internal structure of the 2cDM haloes and exploring the parameter space, we use a set of high-resolution simulations. Table 1 summarizes the basic parameters used for the two cases: the dwarfs and GCs. For dwarfs, we used a rather small cubic box of 300 kpc per side length with particles. In such a small simulation box, the size of largest halo that can be produced is limited to the order of M⊙, and the strong environmental effects, such as the tidal stripping that could originate from the host halo, are therefore absent. Thus, the setup is rather close to an isolated dwarf halo and strictly speaking it is not cosmological. The largest halo on the order of M⊙ contains more than a million simulation particles with a single DM mass of 309 M⊙. The force resolution is set to 46 pc, which is small enough for our purposes to study the internal structure of the five largest haloes over the range of M M⊙.
For GCs our sample contains haloes of the order M⊙. The simulation box size is 50Mpc for the side length and the total number of particles is 3843. The force resolution is about two orders of magnitude larger than the dwarf simulation (i.e., 4.5 kpc), but it provides enough accuracy in the inner radial profiles to ascertain whether the 2cDM is capable of creating shallower inner slope as it is indicated by observations for galaxy clusters. The total number of haloes studied ranges from 18 to 21, depending on the choice of the parameters in which some produced a few outliers that are mostly attributed to numerical artifacts.
To ease the comparison among the models based on the different set of parameters, we use the same initial condition that was used for all cases tested on each setup for dwarf and GC simulations. The cosmological parameters are also unchanged for all cases in order to see the direct effect of each set of 2cDM parameter on the halo properties.
3 Dwarf Haloes
It has been observationally shown that low-mass galactic haloes, including Low Surface Brightness (LSB) galaxies and dwarf spheroidals (dSphs), tend to have shallower rotation curves in the inner radial profile (de Blok et al. 2008; de Blok 2010; Oh et al. 2011, 2015), which concurrently implies cored halo density profiles, as opposed to the cuspy profiles predicted by -body numerical simulations of a CDM cosmology (Flores & Primack 1994). There is a mixed conclusion in literature that some claim a cascade of early supernovae feedback can transform a cuspy inner profile to cored one in dwarf galaxies (e.g., Navarro et al. 1996a), while others argue that in such DM-dominated systems star-formation-induced energetic supernovae are inefficient to achieve such transformation based on observational constraints (e.g., Kuzio de Naray & Kaufmann 2011). Here we study whether the 2cDM physics alone could sufficiently explain the formation of cored density profiles in dwarf haloes without considering the presence and the effects of baryonic physics.
To begin, we first present the halo density profiles and examine the internal structure based solely on the DM mass distribution. Subsequently, the parameters are constrained by applying the fit to the profiles and comparing it with observations. We then study the direct effects of the elastic scattering and mass conversion (or ”quantum evaporation” effects) of 2cDM in the DM velocity profiles as well as the DM velocity distribution function within a halo. The phase-space diagram is also shown to check the effects. Some of the selected set of parameters are further studied to see the effects of 2cDM on the anisotropy radial profiles and the halo spin parameter. Finally, in comparison with the CDM counterpart, we quantify the fraction of halo mass that can be lost or evaporated by the 2cDM physics.
A summary of the set of parameters explored in our dwarf simulations are the following: (i) = 0.001, 0.01, 0.1, and 1 cm2g-1, (ii) () = () where , which gives 9 cases in combination. The kick velocity km s-1 is used throughout this work as the fiducial value, which corresponds to the mass degeneracy of (see Section 1). Most of these parameters are chosen in accord with the results from Paper I II.
3.1 Density profiles
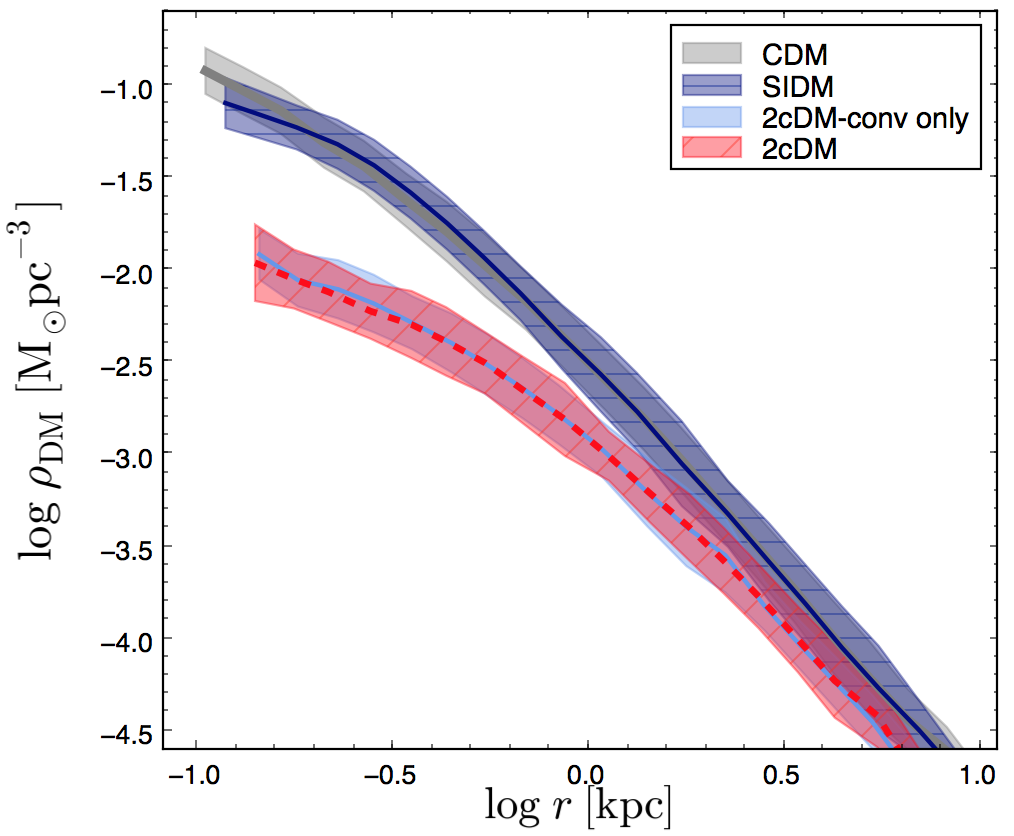
Figure 1 shows the mean DM halo density profiles for the selected models to highlight the effect of 2cDM. We chose (i.e., no velocity dependence) with cm2g-1for all the cases shown: SIDM (= elastic scattering only), 2cDM, and 2cDM. The CDM is also shown for a comparison. The sample consists of the largest five haloes in the simulation box. It clearly shows the mass conversion is the key physical process that successfully reduces the inner-most density, as 2cDM and the full 2cDM (both mass conversion and elastic scattering enabled) closely follow each other’s trend. Their profiles start to deviate from the CDM and SIDM at kpc with the chosen set of parameters, generally conforming to the observed range.
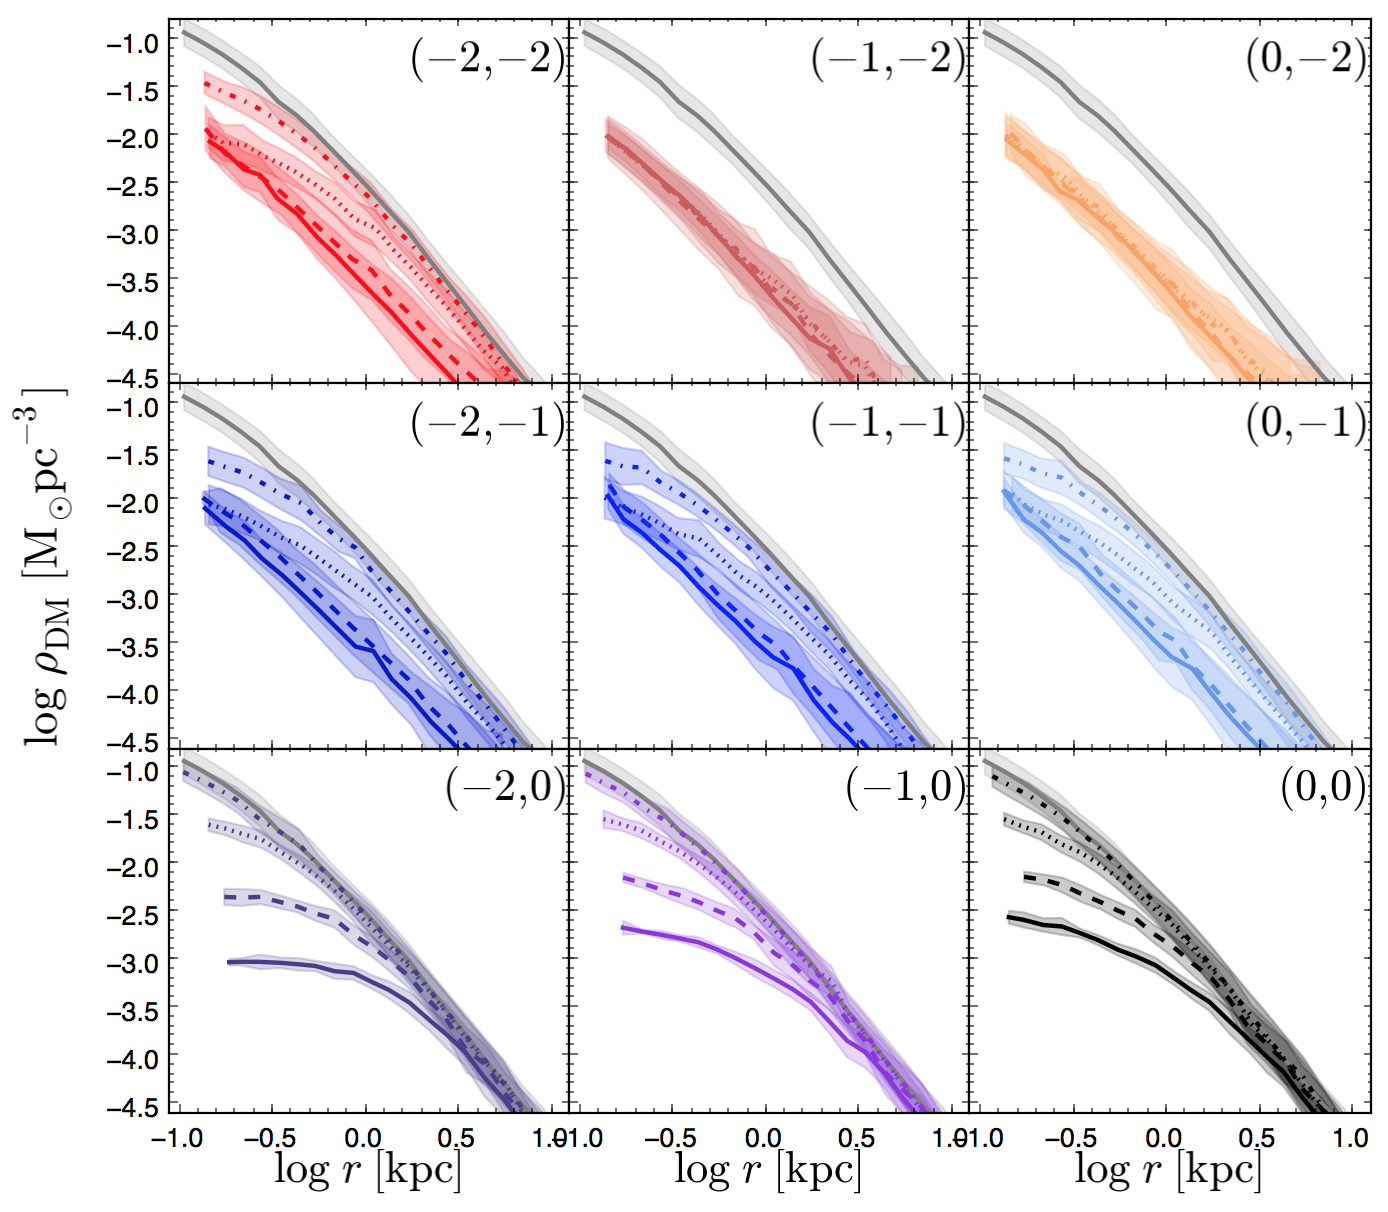
To explore the parameter space further, Figure 2 shows the compilation of profiles for all the other cases of 2cDM. We immediately see the prominent impact of on the formation of a cored density profile by simply comparing the rows, whereas that of is minimal by comparing across the columns. In other words, the shape of the profile is predominantly determined by the strength of mass conversion rather than elastic scattering. This is particularly true for low-mass systems such as the dwarf haloes considered here; their intrinsically small DM velocity has a significant effect on the cross section that is inversely proportional to the velocity.
The following are a list of other implications: (i) The shape of density profile appears nearly identical, irrespective of the value of , for the cases with the mass conversion having a strong velocity dependency of () where , or . It is unclear what the exact physical mechanism is attributed to such similarity. The exception is (), in which case the -prefactor becomes identity and behaves similar to the case with . Meanwhile, a strong evaporation effect is clearly responsible for creating less steep logarithmic slopes over the haloes’ virial range compared to the CDM. It is likely that its dominant effect is negating the -dependency in this case. (ii) The models with , or (), show cored density profiles only for smaller values of 0.001 and 0.01 cm2g-1. For larger values ( cm2g-1), we are unable to tell whether the core formation is possible within the radial scale our simulations can resolve. (iii) For (, 0) where the mass conversion cross section has no velocity-dependence , the core density () and core radius () are primarily determined by , producing self-similar profiles. This particular model shows a clear trend where a smaller (and a larger ) is created by a larger .
To quantitatively compare the results with observations and constrain the parameters, we use a cored density profile model, which is a modified version of the isothermal (ISO) model. Following the formula introduced in Paper I II, we fit the dwarf halo density profiles with the generalized isothermal model (gISO), which is given by
| (2) |
where is a parameter that introduces a flexibility to the pure ISO model for the outer slope of the density profile. Note that with the model is effectively reduced to the pure ISO model. This model inevitably gives a poorer fit to the cases with cuspy inner profiles. For example, most of () and () cases clearly do not show a sign of core formation within the resolved radial scale, which corresponds roughly to 100 pc.
To ease the comparison with observations and mitigate the problem arising from the fit, we take the total halo mass within 300 pc from the halo center (M300 = M) instead of , which tends to be poorly determined, especially for the cuspy cases. The advantage of M300 over is that it is a parameter that can simply be determined by the number of DM particles reside in pc independently of the fitting model used. It also allows us to quantify the effectiveness of the mass evaporation directly. For completeness, however, we conducted the fit on all cases with gISO over the numerically resolved radial range.
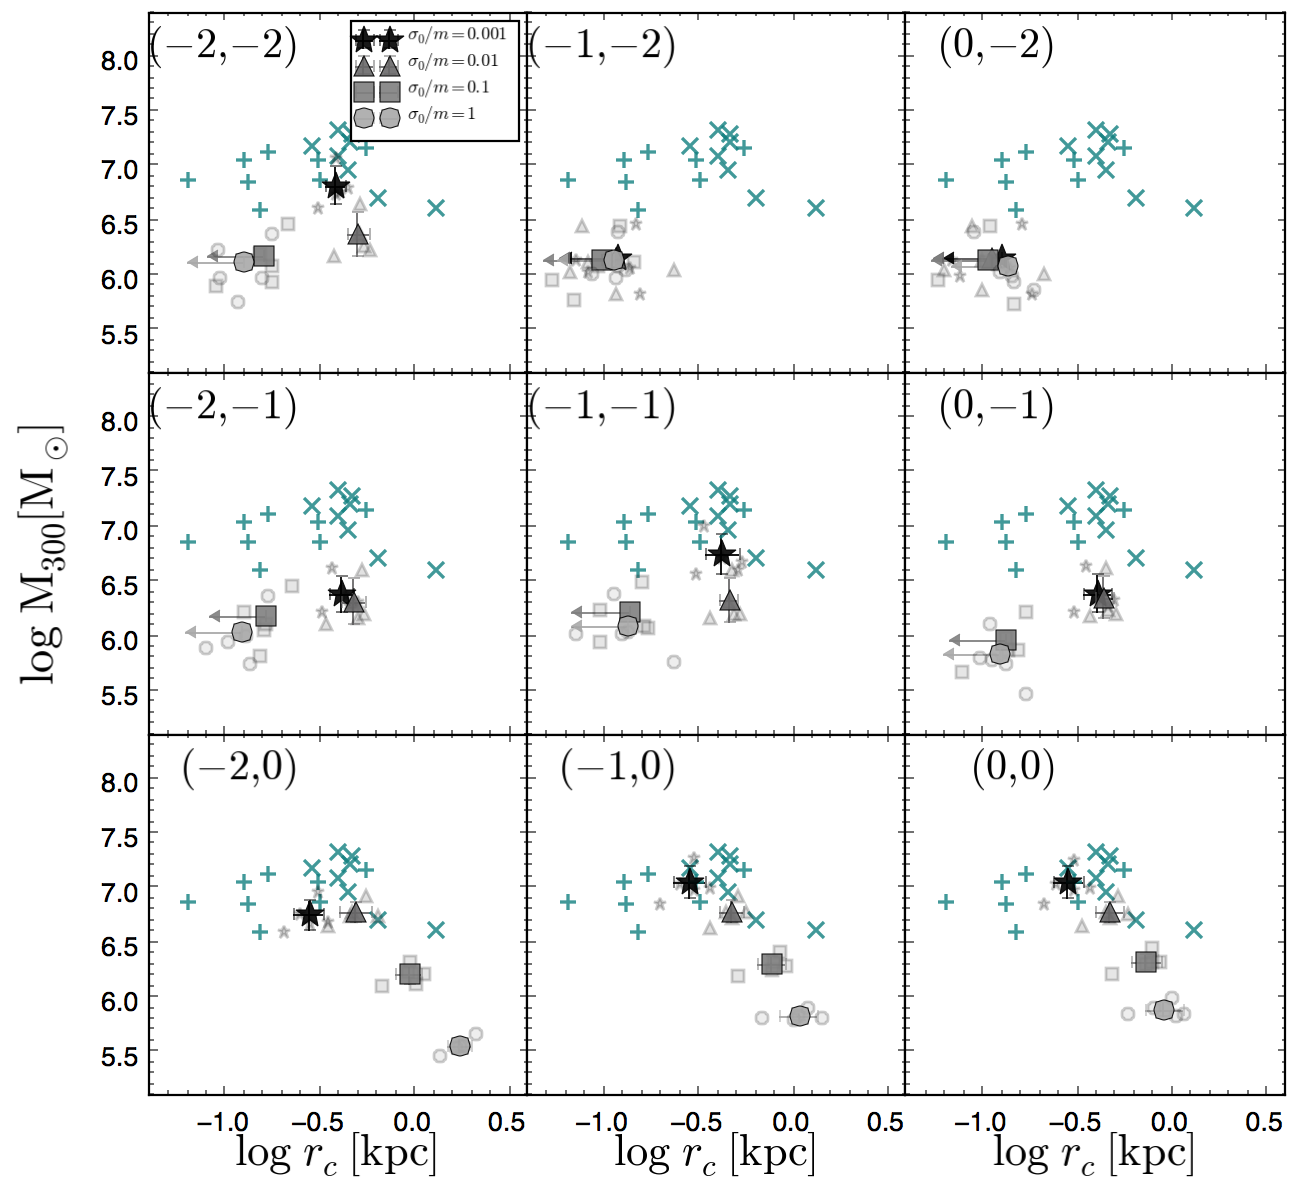
Figure 3 shows M300 as a function of along with observational data from Milky Way dSphs. For the reasons mentioned above, we take for the cuspy ones as the upper-limits. As expected, those ’cuspy’ cases consistently show smaller M300 due to stronger evaporation effect induced by the stronger velocity dependence of the cross section with either or . The only cases that show good agreement with observations, and thus are unlikely to be ruled out are: (), () and (), where (), with and 0.01 cm2g-1. In the meantime, and 1 cm2g-1are unlikely, at least from the -body simulation presented here.
3.2 Velocity profiles
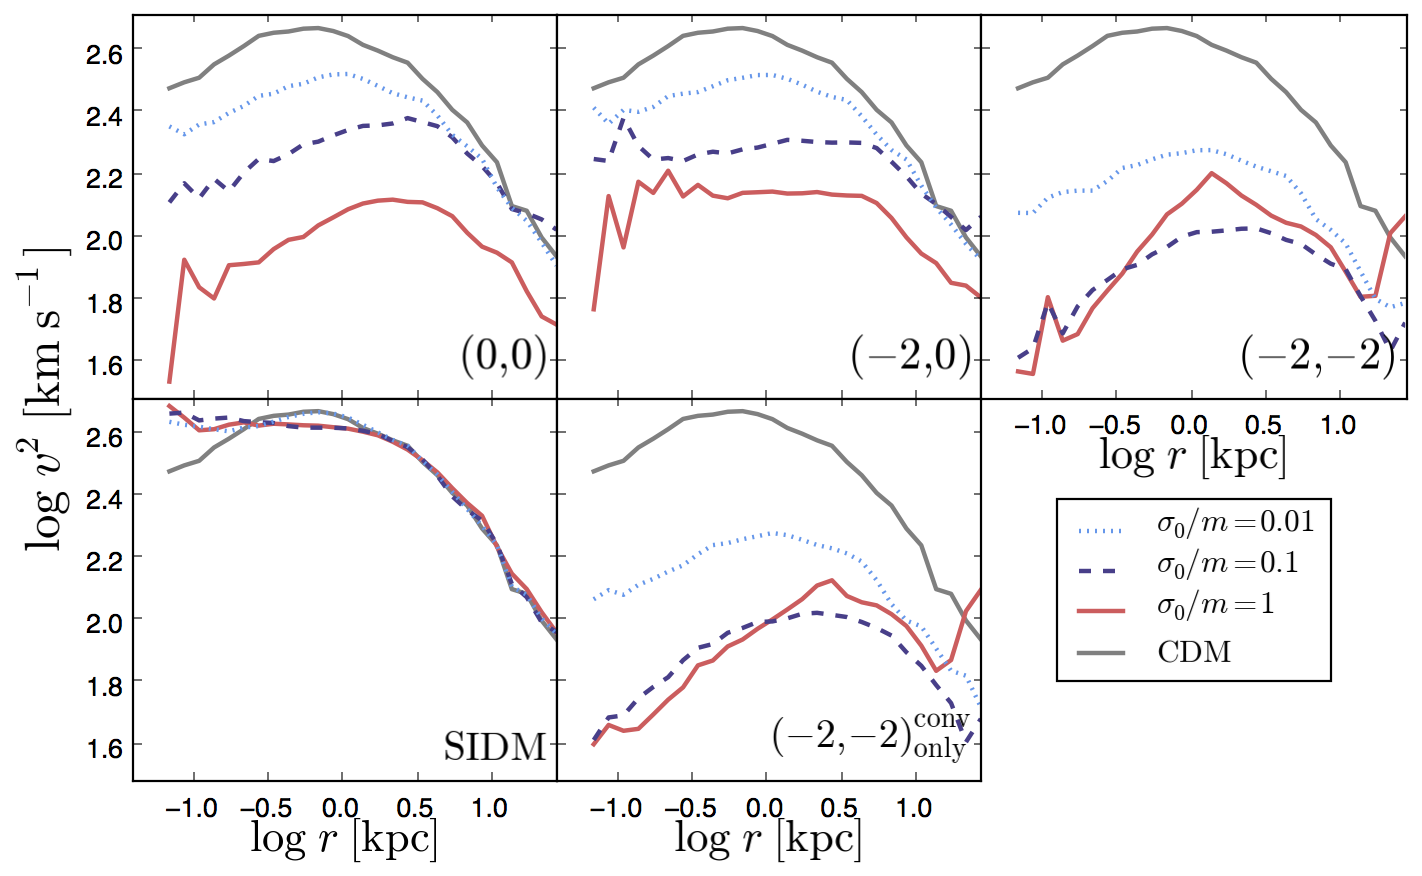
By examining the density profiles, it is clear that the inelastic mass conversion process plays a significant role in characterizing the DM mass distribution within the dwarf haloes. As briefly mentioned in Section 1, the most important feature of the mass conversion is the non-relativistically boosted light particles escaping the halo, altering the velocity distribution of DM. To highlight the effect, Figure 4 shows the velocity profiles, , of the selected cases. Here we focus on examining the effect of the elastic scattering and the mass conversion on the shape of the profile by comparing the cases with (i) no velocity-dependence of the cross section for both elastic scattering and inelastic mass conversion, i.e., (), (ii) the velocity dependence of is only applied for the elastic scattering with , or (), (iii) a case with strong velocity dependence of , (), and its duplicate case with the elastic scattering process disabled, , and (iv) another () case with the mass conversion disabled (or equivalently, SIDM). A range of values are also checked for each case. The profile is computed by taking the mean of of DM particles that reside within each radial bin in a spherical shell. For a clear comparison, the same most-resolved halo ( M⊙) was used to extract the profile for all cases.
The most prominent outcome of the evaporation seen in the velocity profile is that the high-velocity particles are being preferentially removed from the halo due to the reduction of the halo mass. Although the inner-most part of the halo is where the DM interaction rate is the highest, the boosted DM particles in a small halo with km s-1 easily escape from the halo potential after the mass conversion. This is clearly seen in the conversion-only case of and () in which a significant loss of the high-velocity DM particles from the halo is obvious. The elastic scattering, in the meantime, causes mere exchange of the kinetic energy of the interacted particles and does not lead to any loss of halo mass (i.e., the case for SIDM). The primary effect of such exchange of energy is the increase of velocity dispersion in the inner-most part of the halo, producing a flattened profile. This demonstrates the mass conversion has the dominant effect on determining the shape of the velocity profile, just as it is so for the mass density profile.
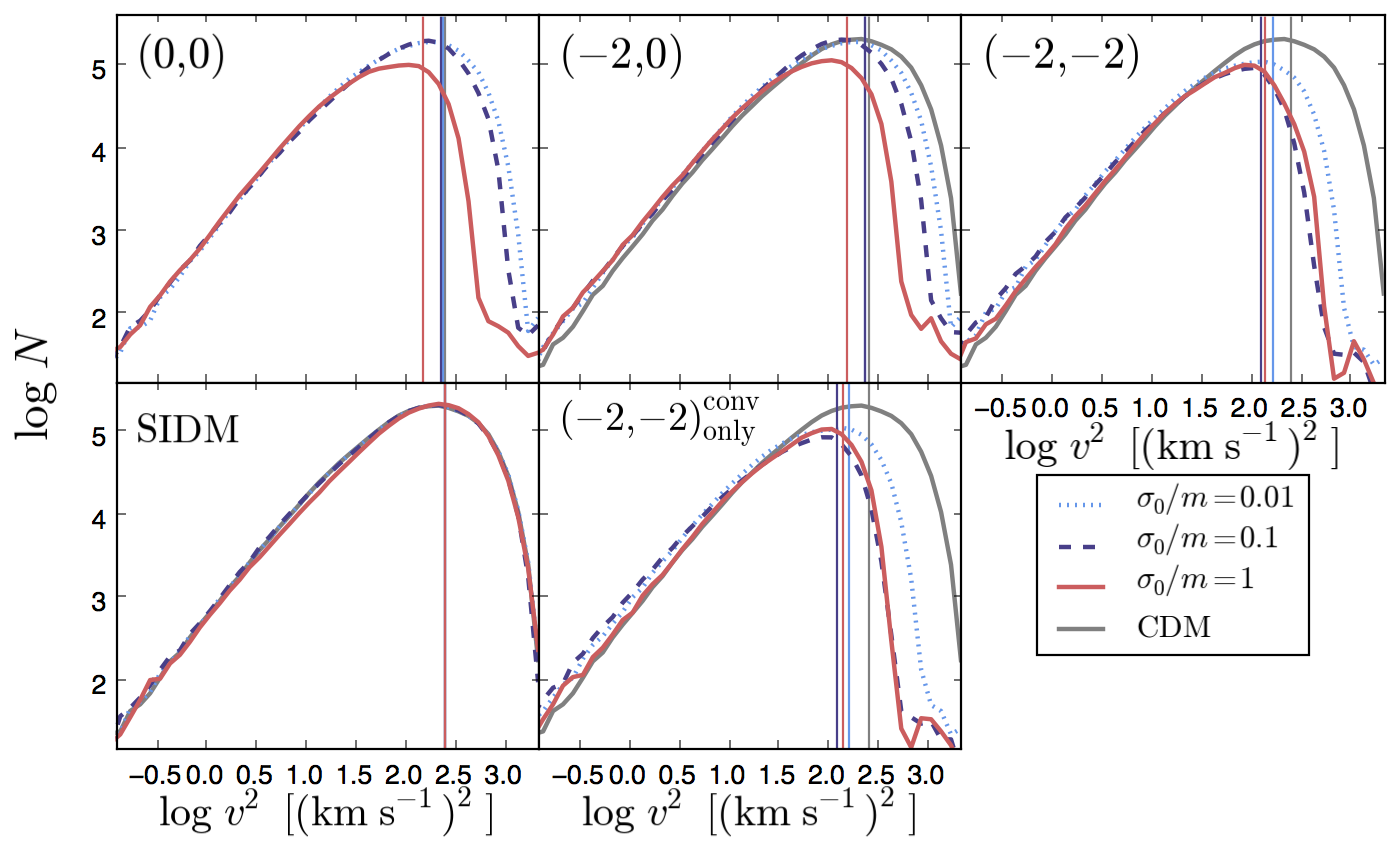
To quantitatively see it from another point of view, Figure 5 shows the distribution function of , the mean of the squared velocity in the spherical radial bin. The turnover occurs roughly around the escape velocity of the halo (indicated as vertical lines), and it shifts to the lower velocity side for the cases where strong evaporation is observed. The identical distribution function of SIDM with respect to CDM signifies the elastic scattering alone does not lead to the reduction of the halo mass and has a negligible effect on the velocity distribution function within the halo.
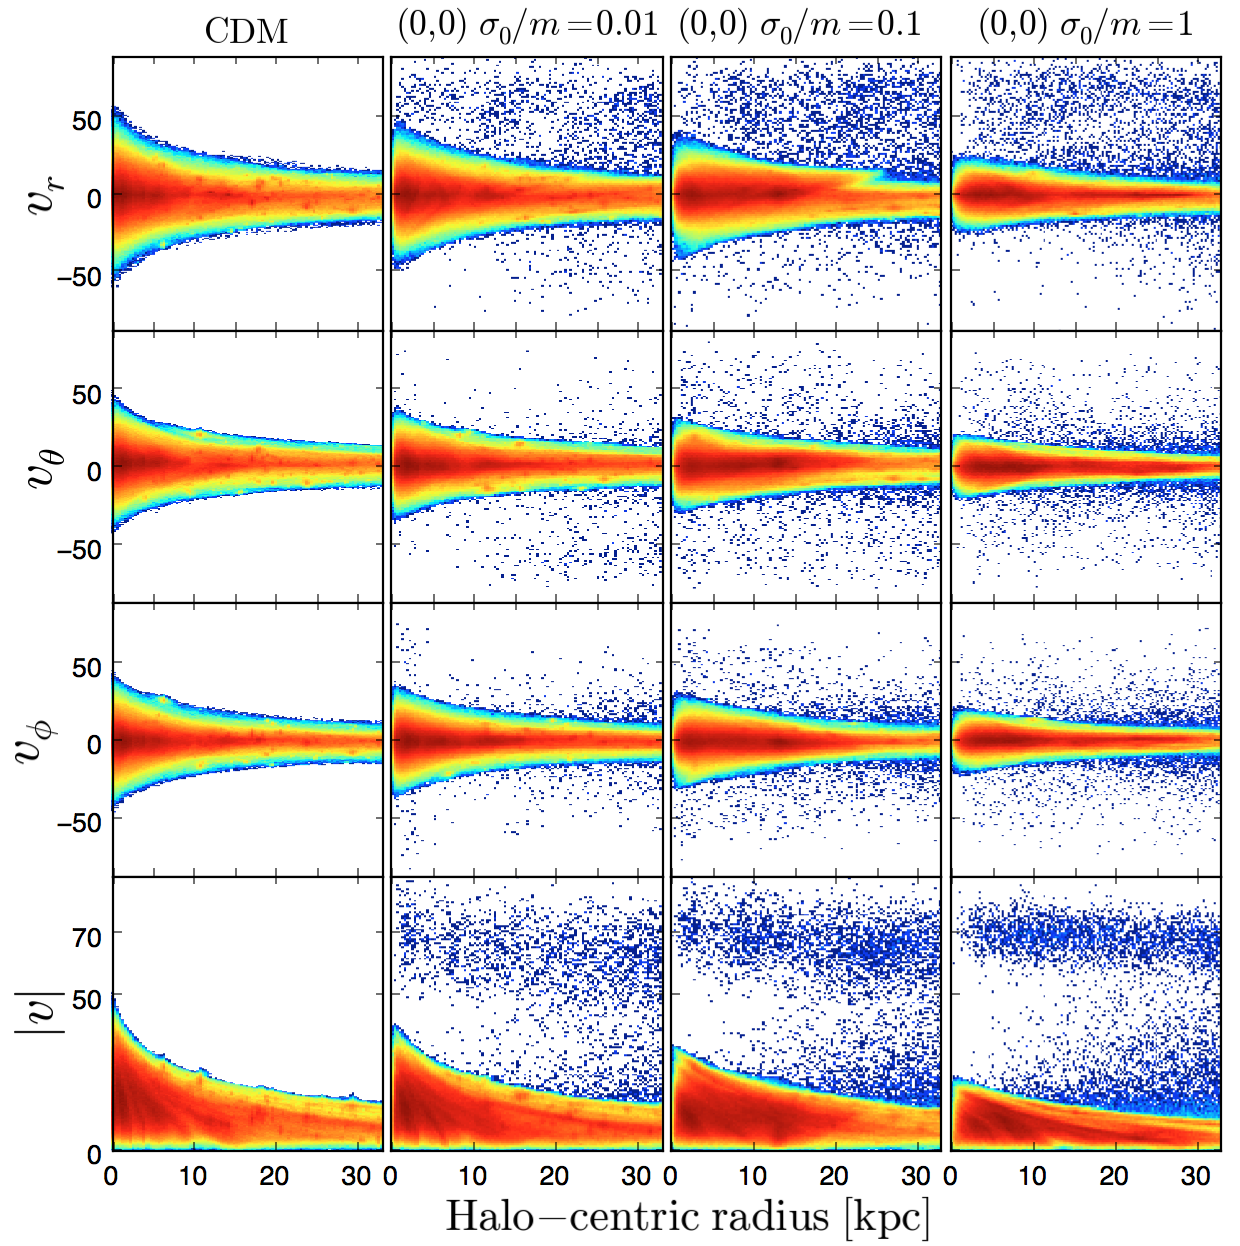
Another effective way of examining the consequence of the mass conversion is to study the phase space. Figure 6 shows the phase space diagram in the form of spherical velocity profiles of the halo. In this case each pixel represents an individual DM simulation particle. To illustrate the key point, only the () case is shown in comparison with CDM. It captures the essence of the mass conversion effect of the 2cDM model as seen in the boosted light particles being relocated to well outside of the virial radius of the halo ( kpc). This creates a stark contrast with the CDM model shown in the left-most column. It is also interesting to see how the abundance of the substructures is reduced in the 2cDM model compared to the CDM. Substructures appear as high concentrations of the particles in the phase space, and such signature is smoothed out and disappear for () with a larger cross-section value.
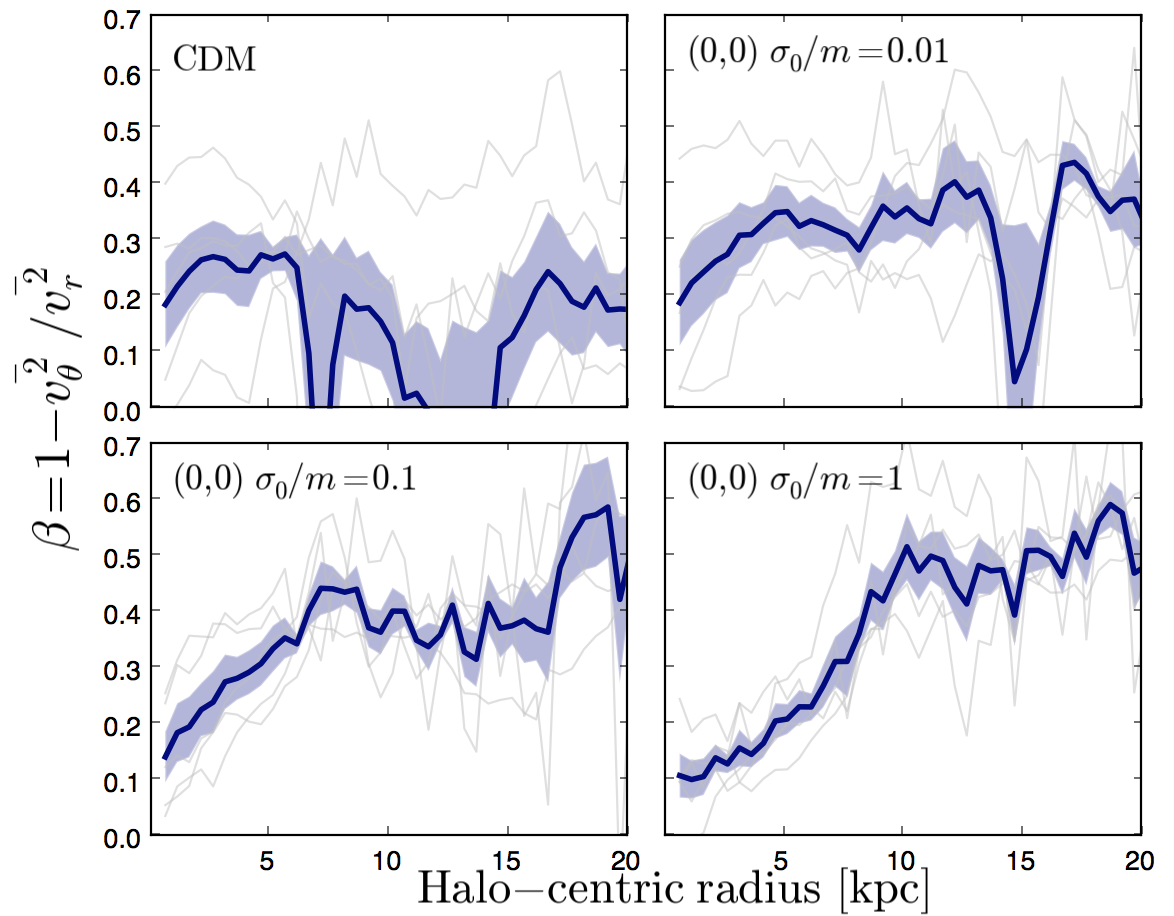
One could extend the study of the halo structure based on the velocity-component by examining the anisotropy of the halo. The so-called anisotropy parameter is defined as (Binney & Tremaine 2008), which describes the geometry of the internal structure of the halo in terms of the velocity in the spherical coordinates. Then the sphericity, or isotropy, corresponds to with , while the degree of anisotropy increases as the radial component dominates over the polar component (), giving . We evaluate the mean anisotropy profile of the five most resolved haloes and it is presented in Figure 7.
Despite the statistically poor sample, we find a clear transformation of the degree of anisotropy within a halo for the () cases. Notably, the rise of relative to (hence, declining value) near the halo center is consistently seen among the halo sample for the case with larger cross section of and 1 cm2g-1that are also producing a clear cored inner density profile. We can see that their halo structure is divided into two regimes – one that is more isotropic (, inner part) and the other being more anisotropic (outer part of halo). The boundary which separates these two regimes roughly corresponds to the characteristic radius in the density profile where the shape of the profile transforms from to a shallower, cored one. When the cases with and 1 cm2g-1are compared, one can see that the size of the characteristic radius increases for the latter case, indicating the expansion of the spherical core region inside the halo due to the stronger mass evaporation effect accompanied with a larger interaction rate.
3.3 Mass loss fraction
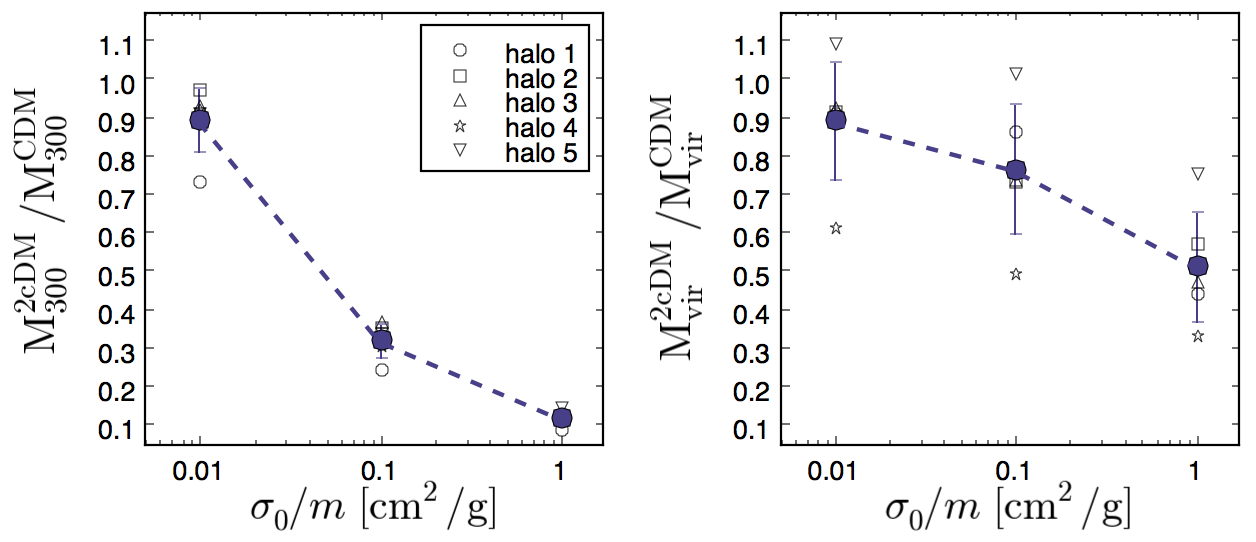
We now quantify the fractional mass loss due to the 2cDM physics, namely the mass conversion, on individual halo bases. In Figure 8 we compare the ratio of 2cDM halo mass to that of the CDM counterpart as a function of the DM cross section at and examine how much mass is lost from (i) the inner part of pc (of which the halo mass contained within is denoted as M300) (left panel) and from (ii) the halo virial radius of roughly kpc or less for our halo sample (right panel). We chose the (0,0) model, where the cross section has no dependency on the velocity for elastic scattering, while mass conversion process has a dependency of that arises from the -prefactor.
By comparing the left and right panels, it is immediately clear that the mass loss is more substantial in the inner part than the virial range. This in turn means not all boosted particles fully escape the halo and some fraction of them remain bounded to the potential after mass conversion. For example, the case with cm2g-1shows the mass reduction achieved in the inner part is , whereas that of over the virial range is only (on average) relative to the CDM halo mass. For the case with cm2g-1, the mass reduction is kept minimal () in both regimes. In either case, our results indicate that small haloes with MM⊙ are not completely blown away by losing all of its mass even with a case with a strong interaction rate provided by a large value.
Note that a more accurate representation is than since the boundary of halo may not be well-defined, resulting in a larger scatter among the sample compared to that of . We emphasize that the mass loss fraction presented here is predominantly due to the mass conversion and is independent of environmental effects, such as tidal stripping, since the small box size we use does not contain any other large haloes. Interestingly, it appears that the fractional mass loss does not seem to strongly depend on the size of halo with this size; that is, the largest halo (open circle) is not necessarily the one that shows the strongest reduction of mass compared to the other smaller haloes within our sample (). This implies the presence of non-negligible statistical fluctuations among the sample, hence, for a more accurate analysis a larger sample is clearly desired.
4 Galaxy cluster haloes
As the largest gravitationally bound objects found in the Universe, GCs offer a crucial venue to explore and study the 2cDM model on the high-mass end of the halo mass function. Similar to dwarf galaxies, GCs are DM-dominated with high mass-to-light ratios, which makes them best suited for studying the role of DM played on cosmological scales. According to the bottom-up scenario, small structures form in the early Universe continuously accrete mass and experience mergers by gravity over the comic time scale to form GCs at later times. With such a long time scale evolutionary process, DM haloes grow in size and can cover many decades of mass range, which places dwarf galaxy haloes and GCs at the both ends of the extreme in halo mass. In this section, we study whether the 2cDM model is capable of reproducing agreement with observations by further constraining the model parameter on GC haloes.
(Simulations) To achieve our goal, we test the 2cDM model on GCs by examining the internal structure of the halo and compare the results with observationally available data. We chose a set of simulations with the total number of simulation particles of with a cubic side length of 50 Mpc. The force resolution is set to 4.5 kpc, which is small enough to allow us to discern whether the given set of parameters can be ruled out. That is, some observational studies have shown that a typical GC core size can be kpc (Allen et al. 2011), and hence if the 2cDM GC core size either exceeds 100 kpc or is much smaller than 50 kpc, we can safely rule out the particular set of model (although this requires caution since it is subject to the baryonic effects as well, which is discussed in the Section 5). We explored some of the most promising cases that have survived the parameter studies on the MW-sized in Paper I II and dwarf-sized haloes (Section 3).
(Halo sample) The simulation box size is large enough, for our purposes, to have a GC sample of 20 in the range log with the mean of . We study the sample taken at , which corresponds to the redshift of some of the observed GCs we use for comparison. The haloes were selected based on the total number of particles contained within the virial halo radius, . We set , that is, the GC halo virial quantities are estimated based on the density contrast that exceeds 200 times of the critical density of the Universe. This yields about 20 haloes on average in our simulations over the mass range mentioned above. Our sample consists of both dynamically relaxed and unrelaxed haloes.
4.1 Density profiles
Observationally, the mass distribution of GCs are probed by gravitational lensing, X-ray emission, and optical observables. In particular, taking the advantage of the deep gravitational potentials produced by GCs, gravitational lensing technique provides a robust way of probing the mass distribution of GCs regardless of whether it is luminous or dark matter. It also has an advantage of not necessitating the assumption of the hydrostatic equilibrium unlike in X-ray observations. Based on Einstein’s theory of general relativity, a presence of mass or deep gravitational potential, such as in GCs, creates curvature in its surrounding space-time and deflects the path of light rays, resulting in the distortion patterns seen in the image of the distant background galaxies. Mass distribution can be mapped by measuring such distortion that appears as giant arcs centered around the gravitational potential (strong lensing), and by systematically studying a weaker and more coherent distortion patterns on the image of background galaxies (weak lensing) (e.g. Bartelmann & Schneider 2001). A disadvantage of the lensing method, especially relevant to the strong lensing, is that it is sensitive to the mass projection bias due to the triaxial halo shape (e.g. White et al. 2002; Torri et al. 2004; Gavazzi 2005; Hennawi et al. 2007). The CLASH cluster survey (Postman et al. 2012) used a selection criteria of clusters based on X-ray morphology specifically for avoiding such disadvantage.
The conventional CDM in -body simulations has shown to reproduce a cuspy density profile for GC haloes which is well described by an NFW profile. This raises a possible tension with some observational studies that have shown a flat or mildly cuspy inner density profiles in the observed GC haloes (Ettori et al. 2002; Sand et al. 2004; Newman et al. 2011, 2013b), whereas other studies have shown that there is no such tension (Schmidt & Allen 2007). Here we check whether the 2cDM model is capable of producing a density profile that is consistent with both of the pictures mentioned above.
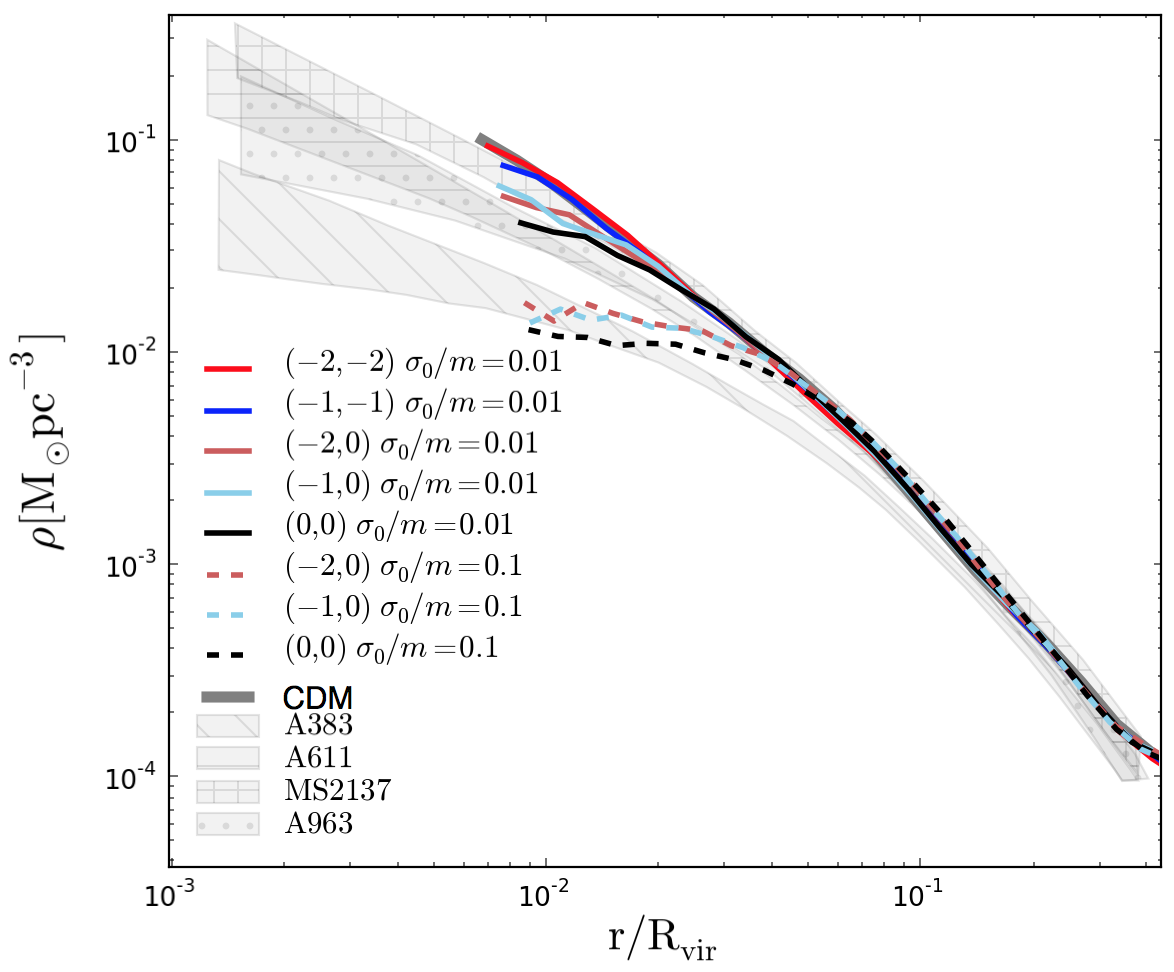
Based on the previous results, including what is shown in the previous sections on dwarf galaxy haloes, we select a set of parameters that are considered to be most promising. To account for the possibility of having a shallower (or mildly shallower) inner profile found in dwarf galaxies, we only choose relatively small cross sections, namely and 0.1 cm2g-1, and the set of velocity-dependent models used are (), (), (), (), and ().
Figure 9 overlays the promising cases of 2cDM profiles on observational data. Although our simulation data do not allow us to probe as deep the inner-radial range as the observational data, we are resolving enough range to see the characteristic radii where the turnover occurs for some of the 2cDM models. Overall, the cases presented here with cm2g-1follow a similar trend with the CDM except that they show mildly shallower profiles towards smaller , which are well within the observationally inferred range. Those cases with with cm2g-1(dashed curves), on the other hand, give much larger core radii with smaller central density. This implies that even with a possible presence of baryon, which would induce a deeper gravitational potential in the cluster center, the cross-section value greater than 0.1 cm2g-1would likely to fail to conform to the observations.
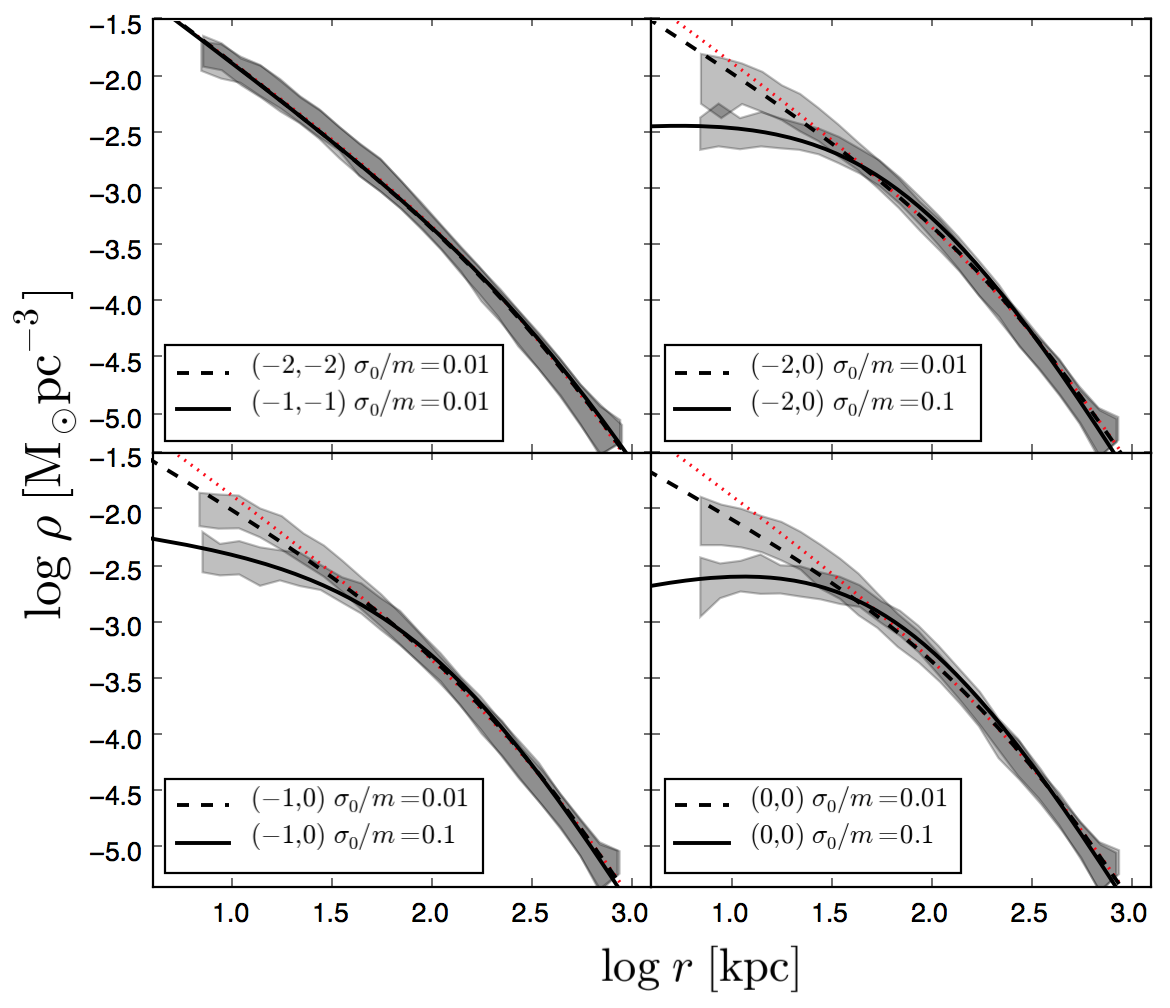
As a more quantitative way to study the profiles, we show some of the cases with the mean radial density profile with 1 spread (shaded) and the fit (solid dashed curves) in Figure 10. Also shown in each panel is the mean profile of the CDM model (red dotted) for comparison. Having shown that the 2cDM model creates cored density profiles in dwarf galaxy and MW sized haloes (Section 3, Paper I II), it might be natural to consider a cored profile, such as gISO profile, for cluster density profiles as well. However, since the observed cluster data that we want our data to be compared with can be described by either an NFW or its modified version of the generalized NFW (gNFW) (Newman et al. 2011; Newman et al. 2013a; Newman et al. 2013b; Meneghetti et al. 2014; Umetsu et al. 2016), we fit our cluster sample with the gNFW model written as
| (3) |
where and are the characteristic density and radius, respectively, and is the logarithmic inner slope which adds statistical flexibility to the fitting model as opposed to that of the constant value of for the CDM model. Note that the gNFW is effectively reduced to the NFW if .
We found that with the chosen set of parameters the 2cDM model can successfully create both a shallower and an NFW-like inner profile, and the gNFW model gives a reasonable fit. The other implications are the following: (i) The (,0) models, where , produce mild to relatively strong reduction on the inner mass density with and 0.1 cm2g-1. (ii) The symmetric cases of and , which we only tested with cm2g-1, show a somewhat weaker effect on the density reduction in the inner-most part compared to the (, 0) counterparts. Their gNFW fit also turned out nearly identical to that of the CDM model. Note that although not shown, the cases with () and () are also expected to show a similar behavior with () with minor differences for GCs as it was indicated in dwarf galaxy haloes (see Figure 2).
The relatively strong effect seen in the (, 0) models with cm2g-1implies a larger cross-section value of cm2g-1or greater for those models would likely produce a much shallower inner profile with a larger core radius ( kpc), thereby it could potentially conflict with observations even with the presence of baryons since the domination of baryons by mass in GCs does not extend beyond 100 kpc. In the meantime, any values in the range of cm2g-1within those models can be plausible, given that we do not consider baryonic effects.
4.2 Fitting parameters
4.2.1 vs.
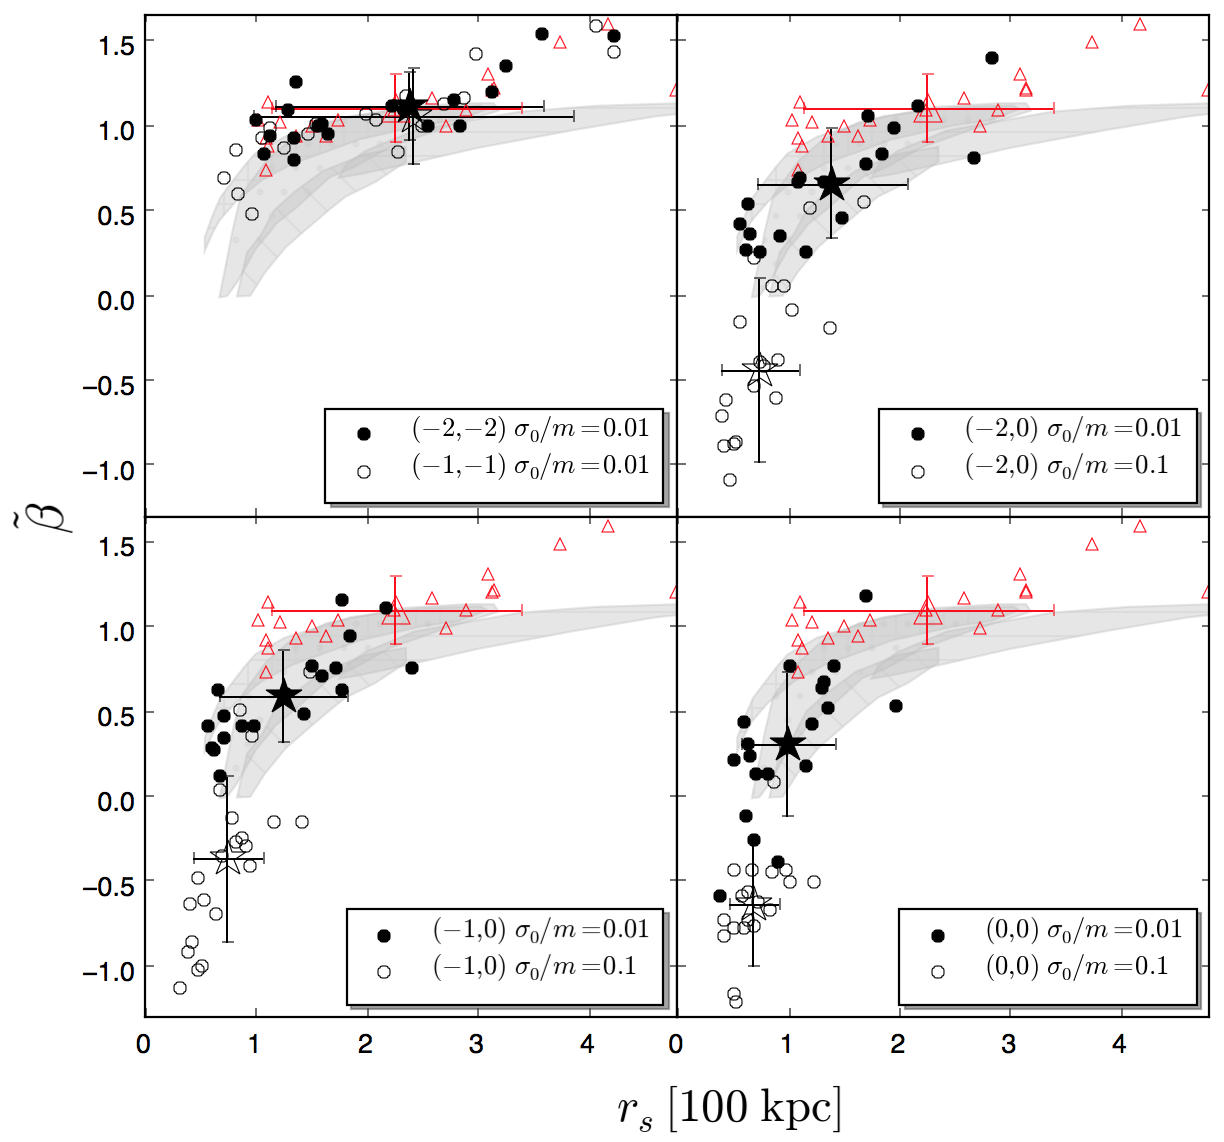
One of the primary outcomes of imposing inelastic mass conversion along with the elastic scattering to a DM model is creation of a shallower inner slope of DM halo density profile. The parameter obtained from the gNFW fitting model quantifies any deviation of the inner slope from a cuspy one, and thus provides us a quantitative measure on the strength of the effect of the 2cDM physics. By evaluating in comparison with observations, it would then provide another way of constraining the parameters used in the 2cDM model. Here we study the correlation between the two fitting parameters, and , and discuss the implications.
Figure 11 shows vs. from our sample overlaid the observational data from Newman et al. (2013a). The selected observational data consist of A383, A611, A963 and MS2137 (1 confidence region) with their mean virial mass ranging from log to 14.9, which is by a factor of 7 larger than the mean of our sample halo mass, but our largest halo differs from them by a factor of only less than 2. For comparison purposes, we also show the case with CDM (red triangles) in all the panels.
We confirm that the CDM model is well within the observational range with the mean , consistent with previous studies that an NFW function can describe the observed GC density profile reasonably well. Closely following the CDM trend is the symmetric cases of and with cm2g-1(upper left panel). This in turn implies that with those particular set of parameters on and , cm2g-1is hitting the lower-limit and any smaller cross section would yield results that are no more different than the collisionless CDM model. The () models, on the other hand, show a clear deviation from the CDM, and the larger cross-section value yields much less than 1, corresponding to a shallower inner density profile. A particularly strong flattening of the inner slope is clearly seen for the cases with cm2g-1where drops below 0, although we note that our results are still in agreement with observations within the 2 confidence level (not shown). In the meantime, the cases with cm2g-1show the mean value of the logarithmic inner slope and are well within the observed data. We caution, however, that the goodness of the gNFW fit is being compromised for these cases with cm2g-1for all the (, 0) models due to the lack of spatial resolution in the inner-most region of the halo. That is, the density profiles shown in Figure 10 imply the actual value of should be smaller than what we have obtained from the fit. Lastly, there is a minimal difference between , and (), and our results indicate that the difference is simply due to statistical in nature.
A further implication on the cross section is that a larger value of cm2g-1is likely to produce a large core that is inconsistent with observations, and therefore might be excluded from the plausible parameter space in the 2cDM model. This is consistent with the numerical results presented in Paper I II that for -body simulations that the 2cDM model seems to consistently reproduce agreement with observations over the many decades of halo mass most well with cm2g-1, regardless of the choice of and . We argue that this constrain would remain plausible even with the possibility of including baryonic physics in our simulations.
4.2.2 Concentration parameter
For consistency check, we also examined the concentration parameter of our cluster sample with observations. The concentration parameter is defined in terms of the virial quantity as , which describes the halo concentration derived from an NFW profile. The parameter naturally appears in both an NFW and gNFW profiles, and hence they can be measured and compared with observations. Both observational and theoretical studies have shown that the concentration can be dependent on the halo mass and the redshift or its assembly history, both in a form of declining power-laws over a given halo mass range (e.g. Bullock et al. 2001; Buote et al. 2007; Schmidt & Allen 2007; Macciò et al. 2008; Duffy et al. 2008; Okabe et al. 2010; Oguri et al. 2012).
Such power-law dependency could however give us an overestimate of the DM annihilation flux signal (or -ray detection signal) expected from the highly concentrated substructures, and more modest substructure boosts are expected from a much smaller mass scale (Sánchez-Conde & Prada 2014). It has been raised that there may be a tension between the observed concentration and the one from numerical simulations, in which the former appears to have some factors larger concentration than that of simulations (Broadhurst et al. 2008; Oguri et al. 2009), whereas some studies found otherwise (Merten et al. 2015; Sereno et al. 2015; Umetsu et al. 2016). Here we briefly summarize the results on the concentration, or more specifically the concentration-mass (c-M) relation, for the 2cDM and CDM.
From the gNFW fit, we found that the case with cm2g-1yields the mean concentration from the sample is , whereas that of CDM is with 1 error. The cases with and cm2g-1are only marginally different from CDM. In general, the value of the mean concentration for the case with a larger cross section turned out much smaller when an NFW is used for the fit. For example, cm2g-1gives , which is roughly a factor of 7 smaller than the value from gNFW. The large discrepancy is attributed to the poorer fit given by NFW compared to the gNFW for profiles that have a shallower inner density slope, and thus a similar but more mild discrepancy is seen in the cases with and cm2g-1. In the meantime, for the cases with smaller cross section of cm2g-1are within 1 from each other between gNFW and NFW.
We found that there is an inconsistent trend in the values of , hence , when compared between the gNFW and NFW in the 2cDM results, especially for the cases with a large cross-section value of 0.1 cm2g-1for . While for the NFW fit, a larger cross section yields a larger scale radius with a smaller concentration , the gNFW gives the opposite trend with a larger cross section producing a smaller and a higher . Even though the goodness of the fit in terms of the reduced value does not differ significantly between the two profile models (especially true if the profile shape is close to that of CDM), the gNFW profile captures the mildly shallower or flat inner part of density profile better. In other words, the gNFW is more sensitive in determining the turnover of the profile, which is where is essentially defined. For the 2cDM model, the DM mass are re-distributed and pushed outward after the mass conversion interactions take place, resulting in the shift of the position of in the density profile and creating a more sudden turnover compared to a more smooth transition seen in an NFW profile. The inconsistent trend found in the concentration from NFW and gNFW can thus mostly be due to (i) the inability of the NFW profile model to accurately determine for a flat profile and (ii) the gNFW can be too sensitive to the more drastic turnover of a flat 2cDM density profiles.
Due to the limited statistical sample over the range of halo mass and the GC counts, we do not attempt to fit our data on the c-M relation with a power-law. The relatively large scatter among the sample also prevents us from drawing any firm conclusion on the anti-correlation of the c-M relation seen in literature. Our results however highlights that in terms of the concentration parameter, a cross-section value of cm2g-1in the 2cDM model, especially for the cases with and , yields good agreement with the CDM. The only minute difference from the CDM is that there is an implication from the density profile that the inner-most slope ( kpc) is shallower. If there is a better numerical resolution to resolve the inner radial region, then the fitting parameter obtained from the gNFW would have been slightly affected and possibly producing a slightly larger concentration than the CDM. It is inconclusive whether the tension between the numerical/theoretical predictions and observations can be explained by the 2cDM.
5 Discussion
The results shown in this work do not consider the baryonic physics. For DM-dominated systems this is a reasonable assumption in general, at least to test and constrain a DM model for our purposes. However, both observations and numerical simulations have shown that even for DM-dominated systems the baryonic physics plays a role in certain regimes, although the significance of the effect may depend on the assumptions and models at hand. In this section we discuss the implications from this work and the possible effects of including baryonic physics combined with 2cDM physics on dwarf and GC systems.
5.1 Implications on baryonic effects
5.1.1 Dwarf galaxies
Dwarf galaxies are known to host relatively small fraction of stars and gas (high mass-to-light ratios) and mostly dominated by DM mass. The inclusion of baryons in our analysis would therefore less likely affect significantly the overall shape of the 2cDM density profiles shown in this work. However, unlike galaxy clusters, they are formed in the early Universe via the bottom-up structure formation scenario. This requires us to examine how the 2cDM physics plays a role in terms of the halo evolutionary processes. To quantitatively check this, we examined the evolution of the fitting parameters from the gISO profile, namely , and (in Eq. (2)), over the scale factor of (). We found that the evolution of follows a power-law with the logarithmic slope of , which is nearly independent of whether the elastic scattering, inelastic mass conversion, or both are assumed in the 2cDM model with . The slope is also insensitive to the cross section, at least for smaller ones ( and 0.01 cm2g-1). The evolution of as a function of scale factor also shows a modest power-law relation: it indicates the haloes can be better described as isothermal at higher redshift and the halo deviates from it gradually towards the current time. Importantly, we also found that as oppose to the gradual increase of , the core radius steadily decreases towards the current time. This implies the central region of dwarf haloes can be less concentrated at earlier redshift (as early as ), especially so if the mass conversion is enabled, and that in this scenario it is likely that the formation of gas and stars in such lower dense environment at earlier time could delay the burst of star formation significantly.
The FIRE hydrodynamical simulations (Oñorbe et al. 2015) showed that a bursty stellar feedback can create a DM density core size of kpc in the inner-most region of dwarf galaxies only above a stellar mass of M M⊙, depending on the star formation histories. Similarly, Governato et al. (2012) found the inefficiency in the transfer of stellar feedback energy to DM in the system below the virial halo mass of M⊙ to soften the cuspy DM density profile. In this work we showed that the 2cDM model can create a sizable DM density core even in the virial halo mass of as small as M⊙, which is up to a few orders of magnitude smaller than their counterparts, and that our results show the mass conversion naturally creates a core without relying on baryonic feedback.
5.1.2 Galaxy clusters
Possible baryonic effect in GCs can particularly be noticeable in the core of clusters where the complex interplay among the central galaxies, hot bubbles, cold stream, etc. is not well understood (e.g. McNamara & Nulsen 2007). However it has been observed that the central region (as small as kpc) is dominated by stellar mass, and hence the total density profile (luminous + DM) has a logarithmic inner slope steeper than that of an NFW (e.g. Sand et al. 2004; Newman et al. 2013a; Newman et al. 2013b). CDM-based numerical simulations generally confirm this picture. Meanwhile, the so-called overcooling problem has also been well-known in the numerical simulations to cause condensation of baryonic matter in the deep gravitational potential, which induces an exceeding amount of cold gas in the cluster center, resulting in excessive star formation (e.g. Borgani & Kravtsov 2011). This is generally attributed to the inefficiency of the baryonic feedback processes, namely Active Galactic Nuclei (AGN) feedback, of which its strength and efficiency can be controlled by the assumptions made in the model and the parameters associated with them, to counteract with the cluster’s gravity within the CDM framework. In fact, numerical simulations with an AGN feedback have predicted both a cuspy (Schaller et al. 2015) or shallower DM inner density profile (Martizzi et al. 2012; Martizzi et al. 2013), in which the latter can primarily be created by a strong AGN feedback. That is, the feedback can be energetic enough to quench late star formation and turn the cuspy DM density profile to a flat one by means of causing a strong perturbations in the gravitational potential and removing the DM mass from the central part of clusters.
Due to the nature of the 2cDM model to create a shallower gravitational potential in the halo center, producing a flat core in the DM density profile, the model naturally alleviates the so-called overcooling problem seen in the CDM without relying on the baryonic feedback. In fact, for the cases with cm2g-1tested in this work, creation of a core size of roughly 30 kpc is evident, while with cm2g-1they are kpc (note that these values do not necessarily correspond to the characteristic radius measured from an NFW or gNFW profile). In other words, the DM density within such radial range is noticeably reduced and the gravitational potential can significantly be shallower compared to that of a CDM halo. The immediate impact is a suppression of overly concentrated cold gas in the core, thus it follows that it could inhibit the excessive star formation. Such effect is expected to be particularly significant for cases with cm2g-1within the 2cDM paradigm. In the meantime, combining a strong AGN feedback as described in Martizzi et al. (2013) with the 2cDM model would likely create a core size that is larger than what is observed, especially for the cases with cm2g-1or greater. This would certainly worsen the discrepancy with observations.
The effect of including baryons on the c-M relation has also been studied in literature and implied to have a non-negligible impact (e.g. Fedeli 2012). This however is not trivial because the measurement of the concentration requires accurate determination of the characteristic radius that is dependent on how well a gNFW or NFW model fits the profile. In Section 4.2.2 we showed that the value of starts to deviate from each other in between gNFW and NFW for the case with larger cross-section values, mostly owning to the lack of accuracy in NFW to capture the shallower inner slope. We argue that although our results are inconclusive on whether the apparent discrepancy found by some studies in the c-M relation can be explained by the 2cDM model, inclusion of baryonic physics would unlikely transform the inner DM density profile to be an even shallower one, unless a strong AGN feedback is employed. However, additional presence of baryon concentration induced by the gas cooling and the presence of large stellar mass in the central region could enhance the DM concentration in that region through gravitational attractions, which would help make some of the flat 2cDM profiles more towards that of a cuspy CDM-like profile. Therefore, there lies no problem since some observational studies found that the observed c-M relation agrees with that of CDM predictions.
5.2 Constrains from cluster mergers
Cluster merger has been studied widely and of great importance in establishing a firm evidence of DM existence (Clowe et al. 2004). It has also been used to constrain the self-interacting nature of DM based on the offset between the collisionless stellar component and the DM component, measured from optical images and gravitational lensing data. The well-known Bullet Cluster shows the gas distribution detected in the optical or X-ray images lags behind the collisionless stars and DM (Markevitch et al. 2004), which signifies that DM cannot be fluid-like or any more than modestly collisional. The other merging clusters were also studied to set a constrain on the self-interacting nature of the DM. Similar to the Bullet Cluster, their inferred self-interaction cross section per unit mass () based on the scattering depth of the DM, , where is the DM surface mass density estimated from lensing data, has been reported to be cm2g-1as an order of magnitude estimate for the upper limit (Markevitch et al. 2004; Bradač et al. 2008; Merten et al. 2011; Dawson et al. 2012; Clowe et al. 2012; Harvey et al. 2015). Theoretical and numerical simulations of cluster merger have also reached a similar constrain (e.g. Randall et al. 2008; Kahlhoefer et al. 2014; Robertson et al. 2017). The inferred cross-section value of cm2g-1as the 2cDM model’s preferred value is clearly in reasonable agreement with those cluster merger studies.
| MW | Dwarf | GC | Theoretical | ||||||
|---|---|---|---|---|---|---|---|---|---|
| Model | Density profile | VF | RHDF | Density Profile | Density Profile | - | - relation | preference | |
| 0.001 | Maybe | YES | YES | NO | – | – | – | YES | |
| 0.01 | Maybe | Maybe | YES | YES | YES | YES | YES | YES | |
| 0.1 | YES | YES | YES | NO | – | – | – | YES | |
| 1 | YES | YES | YES | NO | – | – | – | YES | |
| 10 | NO | YES | YES | NO | – | – | – | YES | |
| \hdashline | 0.001 | Maybe | YES | YES | NO | – | – | – | |
| 0.01 | Maybe | YES | YES | NO | – | – | – | ||
| 0.1 | YES | YES | YES | NO | – | – | – | ||
| 1 | YES | YES | YES | NO | – | – | – | ||
| 10 | NO | YES | YES | NO | – | – | – | ||
| \hdashline | 0.001 | Maybe | YES | YES | NO | – | – | – | |
| 0.01 | Maybe | YES | YES | NO | – | – | – | ||
| 0.1 | YES | YES | YES | NO | – | – | – | ||
| 1 | YES | YES | YES | NO | – | – | – | ||
| 10 | NO | YES | YES | NO | – | – | – | ||
| \hdashline | 0.001 | Maybe | YES | YES | NO | – | – | – | |
| 0.01 | Maybe | Maybe | YES | YES | – | – | – | ||
| 0.1 | YES | YES | YES | NO | – | – | – | ||
| 1 | YES | YES | YES | NO | – | – | – | ||
| 10 | NO | YES | YES | NO | – | – | – | ||
| \hdashline | 0.001 | Maybe | YES | YES | NO | – | – | – | YES |
| 0.01 | Maybe | Maybe | YES | YES | YES | YES | YES | YES | |
| 0.1 | YES | YES | YES | NO | – | – | – | YES | |
| 1 | YES | YES | YES | NO | – | – | – | YES | |
| 10 | NO | YES | YES | NO | – | – | – | YES | |
| \hdashline | 0.001 | Maybe | YES | YES | NO | – | – | – | |
| 0.01 | Maybe | Maybe | YES | YES | – | – | – | ||
| 0.1 | YES | YES | YES | NO | – | – | – | ||
| 1 | YES | YES | YES | NO | – | – | – | ||
| 10 | NO | YES | YES | NO | – | – | – | ||
| \hdashline | 0.001 | Maybe | NO | YES | NO | – | – | – | |
| 0.01 | Maybe | NO | NO | YES | YES | YES | YES | ||
| 0.1 | YES | Maybe | YES | YES | Maybe | YES | YES | ||
| 1 | YES | YES | NO | NO | – | – | – | ||
| 10 | NO | NO | YES | NO | – | – | – | ||
| \hdashline | 0.001 | Maybe | NO | YES | NO | – | – | – | |
| 0.01 | Maybe | NO | NO | YES | YES | YES | YES | ||
| 0.1 | YES | Maybe | YES | YES | Maybe | YES | YES | ||
| 1 | YES | YES | NO | NO | – | – | – | ||
| 10 | YES | NO | YES | NO | – | – | – | ||
| \hdashline | 0.001 | Maybe | NO | YES | NO | – | – | – | YES |
| 0.01 | YES | NO | NO | YES | YES | YES | YES | YES | |
| 0.1 | YES | Maybe | YES | YES | Maybe | YES | YES | YES | |
| 1 | YES | YES | NO | NO | – | – | – | YES | |
| 10 | NO | NO | YES | NO | – | – | – | YES | |
| \hdashlineSIDM | 0.001 | YES | NO | – | – | – | – | – | |
| 0.01 | YES | NO | – | – | – | – | – | ||
| 0.1 | YES | NO | – | – | – | – | – | ||
| 1 | YES | NO | – | – | – | – | – | ||
| 10 | – | – | – | – | – | – | – | ||
| \hdashlineCDM | – | Maybe | Maybe | Maybe | Maybe | YES | YES | YES |
6 Summary and Conclusions
In this work we explored the effect of the 2cDM physics on the DM haloes of the size of hosting dwarf galaxies and clusters of galaxies, effectively covering 7 orders of magnitudes in the virial halo mass. Following the studies on the MW-sized haloes presented in Paper I II, the results presented in this work places a more stringent constrain on the 2cDM model parameters based on the -body cosmological simulations.
Constraining parameters is one of the major goals of this work, and we first tested the promising set of parameters on dwarf haloes. Those promising parameters that were inferred from the results of MW-sized halo studies presented in Paper I II include the symmetric cases of , and , and others with and 0, totaling 9 sets of DM cross section’s velocity dependent or independent models. Note that models with (i.e., either or ) were not considered in this work due to the fact that such strong velocity dependence puts DM close to reaching the fluid regime with characteristically high interaction rates within the reasonable choice of cross-section values. The other key parameter chosen as a fiducial value for both dwarf and GC is the kick velocity km s-1 which accounts for the mass degeneracy between the two mass eigenstates as . Additionally, we explored the 4 decades of DM cross-section values ranging from to 1 cm2g-1, where we excluded a case with 10 cm2g-1for the similar reason to the case with . By examining the halo structures of the top 5 most well resolved haloes in our sample with their virial mass of M⊙, we found the following:
-
•
cm2g-1are generally disfavored for all the models except for where . The cross section can be as small as cm2g-1for , , and () to show at least a modest deviation from the cuspy NFW profile in the logarithmic inner slope. However, with such a small cross section makes little difference and its halo profile is nearly identical to the CDM counterpart. From this, our results indicate that the minimum cross-section value to make some noticeable flattening of the inner density profile lies somewhere between cm2g-1in the 2cDM model.
-
•
The mass loss fraction due mainly to the inelastic mass conversion is particularly profound within pc compared to that of within the virial radius (Figure 8). On average a 2cDM halo with (0,0) can lose for , for , and for cm2g-1of DM mass from pc in comparison with the CDM counterpart.
Following from what is implied in the dwarf haloes, we chose only a limited set of parameters which are considered to be some of the most promising to further test the 2cDM model on the GCs. The selected parameters are the symmetric cases of and a few asymmetric cases of and . The cross section was chosen to be either 0.1 or 0.01 cm2g-1, excluding 1 cm2g-1which is unlikely to be plausible. We studied a cluster sample of taken at over the halo mass () range of M⊙ and performed a fit on the density profile with the gNFW and NFW radial profiles and examine the fitting parameters by comparing with observational data. The key findings are as follows:
-
•
cm2g-1is well within the observations, which can create density profiles that are not too dissimilar to that of CDM but with a slightly shallower, less cuspy inner slope. Thus, with such cross section the 2cDM could explain both possibilities of creating an NFW-like and a shallower profile with a reasonable core size of kpc. Presence of baryonic mass in the core region would also be compatible to observations, for the dominance of stellar mass in the central galaxies typically does not exceed a few tens of kpc measured from the halo center. However, we note that a possible effect of strong AGN feedback in the central region could compromise the agreement with observations by creating unrealistically large core size.
-
•
The concentration parameters derived from the gNFW and NFW profiles show generally reasonable agreement with both observations and CDM-based numerical predictions. We found some degree of deviation from CDM for cases with a larger cross section of cm2g-1, but the resulting concentration can still be within the error due to the relatively large scatter within the sample.
For both dwarf and GC simulations performed in this work, we have enough spatial resolution to probe the radial scale of our interest to discern whether a certain set of parameters should be ruled out. While some parameters are shown to be inconsistent with observations and can be ruled out, there remains a handful of them that can still be a possibility, even when the baryonic physics is considered. We summarize the entire list of 2cDM parameters that are either tested or implied in this work and from Paper I II in Table 2. By considering MW, dwarf, GC and possible effects from including baryonic physics, the 2cDM’s most preferred cross-section value is cm2g-1, which is in agreement with both observations and theoretical/numerical predictions on self-interacting DM models (e.g. Peter et al. 2013; Rocha et al. 2013). We also found that the symmetric models of and generally work well to reproduce desirable results. The implication is that with the inelastic mass conversion, the model allows both a strong velocity-dependent and velocity-independent cross section as a possibility. To further investigate the model, a set of dark matter + baryonic hydrodynamics simulations are required with a better statistical sample than what is presented in this work.
Acknowledgements
The simulations for this work were carried out at the Advanced Computing Facilities at the University of Kansas. MM is grateful to the the Institute for Theory and Computation at Harvard University and the Kavli Institute for Theoretical Physics for support and hospitality. This research was supported in part by the NSF under grant No. PHY-1748958, the DOE under grant No. DE-SC0016368 and the DOE EPSCOR under grant No. DE-SC0019474.
References
- Allen et al. (2011) Allen S. W., Evrard A. E., Mantz A. B., 2011, ARA&A, 49, 409
- Arraki et al. (2014) Arraki K. S., Klypin A., More S., Trujillo-Gomez S., 2014, MNRAS, 438, 1466
- Bartelmann & Schneider (2001) Bartelmann M., Schneider P., 2001, Phys. Rep., 340, 291
- Binney & Tremaine (2008) Binney J., Tremaine S., 2008, Galactic Dynamics: Second Edition. Princeton University Press
- Borgani & Kravtsov (2011) Borgani S., Kravtsov A., 2011, Advanced Science Letters, 4, 204
- Boylan-Kolchin et al. (2011) Boylan-Kolchin M., Bullock J. S., Kaplinghat M., 2011, MNRAS, 415, L40
- Bradač et al. (2008) Bradač M., Allen S. W., Treu T., Ebeling H., Massey R., Morris R. G., von der Linden A., Applegate D., 2008, ApJ, 687, 959
- Broadhurst et al. (2008) Broadhurst T., Umetsu K., Medezinski E., Oguri M., Rephaeli Y., 2008, ApJ, 685, L9
- Brook & Di Cintio (2015) Brook C. B., Di Cintio A., 2015, MNRAS, 450, 3920
- Brooks & Zolotov (2014) Brooks A. M., Zolotov A., 2014, ApJ, 786, 87
- Brooks et al. (2013) Brooks A. M., Kuhlen M., Zolotov A., Hooper D., 2013, ApJ, 765, 22
- Bullock et al. (2001) Bullock J. S., Kolatt T. S., Sigad Y., Somerville R. S., Kravtsov A. V., Klypin A. A., Primack J. R., Dekel A., 2001, MNRAS, 321, 559
- Buote et al. (2007) Buote D. A., Gastaldello F., Humphrey P. J., Zappacosta L., Bullock J. S., Brighenti F., Mathews W. G., 2007, ApJ, 664, 123
- Burkert (2015) Burkert A., 2015, ApJ, 808, 158
- Clowe et al. (2004) Clowe D., Gonzalez A., Markevitch M., 2004, ApJ, 604, 596
- Clowe et al. (2012) Clowe D., Markevitch M., Bradač M., Gonzalez A. H., Chung S. M., Massey R., Zaritsky D., 2012, ApJ, 758, 128
- Colín et al. (2002) Colín P., Avila-Reese V., Valenzuela O., Firmani C., 2002, ApJ, 581, 777
- Davé et al. (2001) Davé R., Spergel D. N., Steinhardt P. J., Wandelt B. D., 2001, ApJ, 547, 574
- Dawson et al. (2012) Dawson W. A., et al., 2012, ApJ, 747, L42
- Diemand et al. (2008) Diemand J., Kuhlen M., Madau P., Zemp M., Moore B., Potter D., Stadel J., 2008, Nature, 454, 735
- Dubinski & Carlberg (1991) Dubinski J., Carlberg R. G., 1991, ApJ, 378, 496
- Duffy et al. (2008) Duffy A. R., Schaye J., Kay S. T., Dalla Vecchia C., 2008, MNRAS, 390, L64
- Dutton & Macciò (2014) Dutton A. A., Macciò A. V., 2014, MNRAS, 441, 3359
- Elbert et al. (2015) Elbert O. D., Bullock J. S., Garrison-Kimmel S., Rocha M., Oñorbe J., Peter A. H. G., 2015, MNRAS, 453, 29
- Ettori et al. (2002) Ettori S., Fabian A. C., Allen S. W., Johnstone R. M., 2002, MNRAS, 331, 635
- Fedeli (2012) Fedeli C., 2012, MNRAS, 424, 1244
- Finkbeiner & Weiner (2007) Finkbeiner D. P., Weiner N., 2007, Physical Review D, 76, 083519
- Flores & Primack (1994) Flores R. A., Primack J. R., 1994, ApJ, 427, L1
- Fry et al. (2015) Fry A. B., et al., 2015, MNRAS, 452, 1468
- Garrison-Kimmel et al. (2013) Garrison-Kimmel S., Rocha M., Boylan-Kolchin M., Bullock J. S., Lally J., 2013, MNRAS, 433, 3539
- Garrison-Kimmel et al. (2014) Garrison-Kimmel S., Boylan-Kolchin M., Bullock J. S., Kirby E. N., 2014, MNRAS, 444, 222
- Gavazzi (2005) Gavazzi R., 2005, A&A, 443, 793
- Governato et al. (2012) Governato F., et al., 2012, MNRAS, 422, 1231
- Graham et al. (2010) Graham P. W., Harnik R., Rajendran S., Saraswat P., 2010, Phys. Rev. D, 82, 063512
- Harvey et al. (2015) Harvey D., Massey R., Kitching T., Taylor A., Tittley E., 2015, Science, 347, 1462
- Hennawi et al. (2007) Hennawi J. F., Dalal N., Bode P., Ostriker J. P., 2007, ApJ, 654, 714
- Hinshaw et al. (2013) Hinshaw G., et al., 2013, ApJS, 208, 19
- Kahlhoefer et al. (2014) Kahlhoefer F., Schmidt-Hoberg K., Frandsen M. T., Sarkar S., 2014, MNRAS, 437, 2865
- Kamada et al. (2017) Kamada A., Kaplinghat M., Pace A. B., Yu H.-B., 2017, Physical Review Letters, 119, 111102
- Kaplinghat et al. (2016) Kaplinghat M., Tulin S., Yu H.-B., 2016, Physical Review Letters, 116, 041302
- Klypin et al. (1999) Klypin A., Kravtsov A. V., Valenzuela O., Prada F., 1999, ApJ, 522, 82
- Klypin et al. (2011) Klypin A. A., Trujillo-Gomez S., Primack J., 2011, ApJ, 740, 102
- Knollmann & Knebe (2009) Knollmann S. R., Knebe A., 2009, ApJS, 182, 608
- Kuzio de Naray & Kaufmann (2011) Kuzio de Naray R., Kaufmann T., 2011, MNRAS, 414, 3617
- Kuzio de Naray & Spekkens (2011) Kuzio de Naray R., Spekkens K., 2011, ApJ, 741, L29
- Loeb & Weiner (2011) Loeb A., Weiner N., 2011, Physical Review Letters, 106, 171302
- Macciò et al. (2008) Macciò A. V., Dutton A. A., van den Bosch F. C., 2008, MNRAS, 391, 1940
- Madau et al. (2014) Madau P., Shen S., Governato F., 2014, ApJ, 789, L17
- Markevitch et al. (2004) Markevitch M., Gonzalez A. H., Clowe D., Vikhlinin A., Forman W., Jones C., Murray S., Tucker W., 2004, ApJ, 606, 819
- Martizzi et al. (2012) Martizzi D., Teyssier R., Moore B., Wentz T., 2012, MNRAS, 422, 3081
- Martizzi et al. (2013) Martizzi D., Teyssier R., Moore B., 2013, MNRAS, 432, 1947
- McCullough & Randall (2013) McCullough M., Randall L., 2013, J. Cosmology Astropart. Phys., 10, 058
- McNamara & Nulsen (2007) McNamara B. R., Nulsen P. E. J., 2007, ARA&A, 45, 117
- Medvedev (2000) Medvedev M. V., 2000, ArXiv Astrophysics e-prints,
- Medvedev (2001a) Medvedev M., 2001a, ArXiv Astrophysics e-prints,
- Medvedev (2001b) Medvedev M. V., 2001b, in American Astronomical Society Meeting Abstracts #198. p. 815
- Medvedev (2001c) Medvedev M. V., 2001c, in Wheeler J. C., Martel H., eds, American Institute of Physics Conference Series Vol. 586, 20th Texas Symposium on relativistic astrophysics. pp 149–151 (arXiv:astro-ph/0102400), doi:10.1063/1.1419546
- Medvedev (2010a) Medvedev M. V., 2010a, preprint, (arXiv:1004.3377)
- Medvedev (2010b) Medvedev M. V., 2010b, Journal of Physics A Mathematical General, 43, 372002
- Medvedev (2014a) Medvedev M. V., 2014a, J. Cosmology Astropart. Phys., 6, 063
- Medvedev (2014b) Medvedev M. V., 2014b, Physical Review Letters, 113, 071303
- Meneghetti et al. (2014) Meneghetti M., et al., 2014, ApJ, 797, 34
- Merten et al. (2011) Merten J., et al., 2011, MNRAS, 417, 333
- Merten et al. (2015) Merten J., et al., 2015, ApJ, 806, 4
- Moore et al. (1999) Moore B., Ghigna S., Governato F., Lake G., Quinn T., Stadel J., Tozzi P., 1999, ApJ, 524, L19
- Navarro et al. (1996a) Navarro J. F., Eke V. R., Frenk C. S., 1996a, MNRAS, 283, L72
- Navarro et al. (1996b) Navarro J. F., Frenk C. S., White S. D. M., 1996b, ApJ, 462, 563
- Navarro et al. (1997) Navarro J. F., Frenk C. S., White S. D. M., 1997, ApJ, 490, 493
- Newman et al. (2011) Newman A. B., Treu T., Ellis R. S., Sand D. J., 2011, ApJ Letters, 728, L39
- Newman et al. (2013a) Newman A. B., Treu T., Ellis R. S., Sand D. J., Nipoti C., Richard J., Jullo E., 2013a, ApJ, 765, 24
- Newman et al. (2013b) Newman A. B., Treu T., Ellis R. S., Sand D. J., 2013b, ApJ, 765, 25
- Oñorbe et al. (2015) Oñorbe J., Boylan-Kolchin M., Bullock J. S., Hopkins P. F., Kereš D., Faucher-Giguère C.-A., Quataert E., Murray N., 2015, MNRAS, 454, 2092
- Oguri et al. (2009) Oguri M., et al., 2009, ApJ, 699, 1038
- Oguri et al. (2012) Oguri M., Bayliss M. B., Dahle H., Sharon K., Gladders M. D., Natarajan P., Hennawi J. F., Koester B. P., 2012, MNRAS, 420, 3213
- Oh et al. (2011) Oh S.-H., de Blok W. J. G., Brinks E., Walter F., Kennicutt Jr. R. C., 2011, AJ, 141, 193
- Oh et al. (2015) Oh S.-H., et al., 2015, AJ, 149, 180
- Okabe et al. (2010) Okabe N., Takada M., Umetsu K., Futamase T., Smith G. P., 2010, PASJ, 62, 811
- Papastergis & Shankar (2016) Papastergis E., Shankar F., 2016, A&A, 591, A58
- Papastergis et al. (2015) Papastergis E., Giovanelli R., Haynes M. P., Shankar F., 2015, A&A, 574, A113
- Parry et al. (2012) Parry O. H., Eke V. R., Frenk C. S., Okamoto T., 2012, MNRAS, 419, 3304
- Peter et al. (2013) Peter A. H. G., Rocha M., Bullock J. S., Kaplinghat M., 2013, MNRAS, 430, 105
- Planck Collaboration et al. (2015) Planck Collaboration et al., 2015, preprint, (arXiv:1502.01589)
- Pontzen & Governato (2012) Pontzen A., Governato F., 2012, MNRAS, 421, 3464
- Postman et al. (2012) Postman M., et al., 2012, ApJS, 199, 25
- Prada et al. (2012) Prada F., Klypin A. A., Cuesta A. J., Betancort-Rijo J. E., Primack J., 2012, MNRAS, 423, 3018
- Randall et al. (2008) Randall S. W., Markevitch M., Clowe D., Gonzalez A. H., Bradač M., 2008, ApJ, 679, 1173
- Read & Gilmore (2005) Read J. I., Gilmore G., 2005, MNRAS, 356, 107
- Read et al. (2016) Read J. I., Agertz O., Collins M. L. M., 2016, MNRAS,
- Robertson et al. (2017) Robertson A., Massey R., Eke V., 2017, MNRAS, 465, 569
- Rocha et al. (2013) Rocha M., Peter A. H. G., Bullock J. S., Kaplinghat M., Garrison-Kimmel S., Oñorbe J., Moustakas L. A., 2013, MNRAS, 430, 81
- Sánchez-Conde & Prada (2014) Sánchez-Conde M. A., Prada F., 2014, MNRAS, 442, 2271
- Sand et al. (2004) Sand D. J., Treu T., Smith G. P., Ellis R. S., 2004, ApJ, 604, 88
- Sawala et al. (2013) Sawala T., Frenk C. S., Crain R. A., Jenkins A., Schaye J., Theuns T., Zavala J., 2013, MNRAS, 431, 1366
- Sawala et al. (2016) Sawala T., et al., 2016, MNRAS, 457, 1931
- Sawala et al. (2017) Sawala T., Pihajoki P., Johansson P. H., Frenk C. S., Navarro J. F., Oman K. A., White S. D. M., 2017, MNRAS, 467, 4383
- Schaller et al. (2015) Schaller M., et al., 2015, MNRAS, 452, 343
- Schmidt & Allen (2007) Schmidt R. W., Allen S. W., 2007, MNRAS, 379, 209
- Sereno et al. (2015) Sereno M., Giocoli C., Ettori S., Moscardini L., 2015, MNRAS, 449, 2024
- Simpson et al. (2013) Simpson C. M., Bryan G. L., Johnston K. V., Smith B. D., Mac Low M.-M., Sharma S., Tumlinson J., 2013, MNRAS, 432, 1989
- Smith & Weiner (2001) Smith D., Weiner N., 2001, Physical Review D, 64, 043502
- Spergel & Steinhardt (2000) Spergel D. N., Steinhardt P. J., 2000, Physical Review Letters, 84, 3760
- Springel (2005) Springel V., 2005, MNRAS, 364, 1105
- Springel et al. (2005) Springel V., et al., 2005, Nature, 435, 629
- Springel et al. (2008) Springel V., et al., 2008, MNRAS, 391, 1685
- Stadel et al. (2009) Stadel J., Potter D., Moore B., Diemand J., Madau P., Zemp M., Kuhlen M., Quilis V., 2009, MNRAS, 398, L21
- Strigari et al. (2008) Strigari L. E., Bullock J. S., Kaplinghat M., Simon J. D., Geha M., Willman B., Walker M. G., 2008, Nature, 454, 1096
- Swaters et al. (2003) Swaters R. A., Madore B. F., van den Bosch F. C., Balcells M., 2003, ApJ, 583, 732
- Tegmark et al. (2006) Tegmark M., et al., 2006, Phys. Rev. D, 74, 123507
- Teyssier et al. (2013) Teyssier R., Pontzen A., Dubois Y., Read J. I., 2013, MNRAS, 429, 3068
- Todoroki & Medvedev (2019a) Todoroki K., Medvedev M. V., 2019a, MNRAS, 483, 3983
- Todoroki & Medvedev (2019b) Todoroki K., Medvedev M. V., 2019b, MNRAS, 483, 4004
- Tollerud et al. (2014) Tollerud E. J., Boylan-Kolchin M., Bullock J. S., 2014, MNRAS, 440, 3511
- Tollet et al. (2016) Tollet E., et al., 2016, MNRAS, 456, 3542
- Torri et al. (2004) Torri E., Meneghetti M., Bartelmann M., Moscardini L., Rasia E., Tormen G., 2004, MNRAS, 349, 476
- Trujillo-Gomez et al. (2016) Trujillo-Gomez S., Schneider A., Papastergis E., Reed D. S., Lake G., 2016, preprint, (arXiv:1610.09335)
- Umetsu et al. (2016) Umetsu K., Zitrin A., Gruen D., Merten J., Donahue M., Postman M., 2016, ApJ, 821, 116
- Vogelsberger et al. (2012) Vogelsberger M., Zavala J., Loeb A., 2012, MNRAS, 423, 3740
- Vogelsberger et al. (2014) Vogelsberger M., Zavala J., Simpson C., Jenkins A., 2014, MNRAS, 444, 3684
- Vogelsberger et al. (2016) Vogelsberger M., Zavala J., Cyr-Racine F.-Y., Pfrommer C., Bringmann T., Sigurdson K., 2016, MNRAS, 460, 1399
- Vogelsberger et al. (2019) Vogelsberger M., Zavala J., Schutz K., Slatyer T. R., 2019, MNRAS, 484, 5437
- Walker & Peñarrubia (2011) Walker M. G., Peñarrubia J., 2011, ApJ, 742, 20
- Wetzel et al. (2016) Wetzel A. R., Hopkins P. F., Kim J.-h., Faucher-Giguère C.-A., Kereš D., Quataert E., 2016, ApJ, 827, L23
- White et al. (2002) White M., van Waerbeke L., Mackey J., 2002, ApJ, 575, 640
- Zavala et al. (2013) Zavala J., Vogelsberger M., Walker M. G., 2013, MNRAS, 431, L20
- de Blok (2010) de Blok W. J. G., 2010, Advances in Astronomy, 2010, 789293
- de Blok et al. (2008) de Blok W. J. G., Walter F., Brinks E., Trachternach C., Oh S.-H., Kennicutt Jr. R. C., 2008, AJ, 136, 2648
- di Cintio et al. (2011) di Cintio A., Knebe A., Libeskind N. I., Yepes G., Gottlöber S., Hoffman Y., 2011, MNRAS, 417, L74
- van der Wel et al. (2011) van der Wel A., et al., 2011, ApJ, 742, 111