To appear in a special issue of pss(b)
Nodal Semimetals : A Survey on Optical Conductivity
Abstract
Among different topological and related phases of condensed matter, nodal semimetals occupy a special place – the electronic band topology in these materials is related to three-dimensional bulk, rather than to surface, states. A great variety of different realizations of electronic band crossings (the nodes) leads to a plethora of different electronic properties, ranging from the chiral anomaly to solid-state realizations of a black-hole horizon. The different nodal phases have similar low-energy band structure and quasiparticle dynamics, which both can be accessed experimentally by a number of methods. Optical measurements with their large penetration depth and high energy resolution are ideally suited as such a bulk probe; especially at low energies where other spectroscopic methods often lack the required resolution. In this contribution, we review recent optical-conductivity studies of different nodal semimetals, discuss possible limitations of such measurements, and provide a comparison between the experimental results, simple theoretical models, and band-structure-based calculations.
I Introduction
Succeeding graphene and topological insulators, nodal semimetals came into focus of condensed matter physics a few years ago Murakami (2007); Kobayashi et al. (2007); Wan et al. (2011); Burkov and Balents (2011); Burkov et al. (2011); Park et al. (2011); Mañes (2012); Wang et al. (2012, 2013); Liu et al. (2014); Borisenko et al. (2014); Neupane et al. (2014); Vafek and Vishwanath (2014); Lv et al. (2015); Huang et al. (2015); Shekhar et al. (2015); Weng et al. (2015); Xu et al. (2015a, b); Wang et al. (2016); Chiu et al. (2016); Zhu et al. (2016); Bradlyn et al. (5037); Armitage et al. (2018). In these there-dimensional (3D) materials, linearly dispersing electronic bands possess point and/or line crossings in the vicinity of the chemical potential in the bulk Brillouin zone (BZ). These bulk band crossings may lead to topologically trivial (as in the case of Dirac semimetals) or nontrivial (e.g., in Weyl semimetals) electronic phases. Important is that the low-energy electronic dispersion relations can be approximated by a solution of Dirac equation or its modifications Wehling et al. (2014). This makes the optical (interband) response of nodal semimetals generally different from the response of “ordinary” 3D metals and semiconductors and often allows probing the low-energy band structure via optical conductivity measurements. The studies on nodal semimetals, where the linear frequency-dependent conductivity, , had been measured, were in focus of many recent experimental reports. Such measurements reflect the bulk material properties, as the skin depth is typically above a few tens of nanometers for any measurement frequency and of the order of 100 nm to 1 m for the most interesting far-infrared portion of the spectrum Schilling et al. (2017a); Neubauer et al. (2018); Hütt et al. (2018). In this paper, we summarize our findings obtained in such measurements within the last few years and review the most relevant optical results from literature.
In the discussion, we concentrate exclusively on the optical-conductivity features related to the electronic band structure. In addition, optical spectra may contain information on such effects as strong electron-electron or electron-phonon coupling. Possible importance of these interactions in different Dirac materials is widely debated Witczak-Krempa et al. (2014); Dzero et al. (2016); Liu et al. (2016); Fujioka et al. (2017); Ye et al. (2018); P. Rinkel et al. (2017); Hui et al. (2019). It looks like the majority of experimental results on nodal semimetals (particularly, for nonmagnetic systems) can be understood within a single-particle picture. Still, there are reports on experimental detection of different collective effects, also by optical means. For example, a density-wave formation was suggested in the Dirac semimetal Ca1-xNaxMnBi2 Corasaniti et al. (2019) and a strong coupling between optical phonons and Weyl quasiparticles was discussed in TaAs Xu et al. (2017). Reviewing such effects is not the scope of this paper. Here, we just note that in all examples discussed later the collective effects do not manifest themselves in optical conductivity in an explicit way. For instance, the phonon modes remain sharp (and of Lorentzian shape), even though these modes overlap in frequency with the interband (Drude) response of conducting carriers, see, e.g., Refs. Neubauer et al. (2018); Maulana et al. (2019).
II Theoretical background: electronic band dispersion and optical conductivity
In this section, we briefly recap theoretical predictions for the frequency behavior of optical conductivity in the major types of nodal semimetals (see Fig. 1). More details for specific cases can be found in vast available literature, especially in the works of J. P. Carbotte and coauthors Ashby and Carbotte (2014); Carbotte (2016); Tabert et al. (2016); Tabert and Carbotte (2016); Carbotte (2017); Mukherjee and Carbotte (2017a, b, 2018); Carbotte et al. (2019); Carbotte and Nicol (2019).
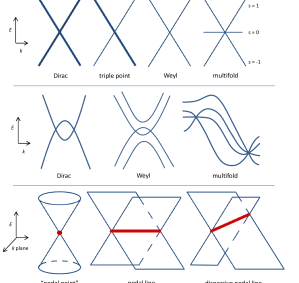
In the case of electron-hole symmetric -dimensional bands with , the real part of the interband optical conductivity is supposed to follow a power-law frequency dependence Hosur et al. (2012); Bácsi and Virosztek (2013),
| (1) |
For Dirac and Weyl semimetals, , the bands are conical (), and Eq. 1 can be more specifically rewritten as
| (2) |
where is the number of Weyl nodes (for a single Dirac node, ), is the Fermi velocity, is the Planck constant, and all Weyl/Dirac bands are considered to be identical (up to a spin degree of freedom) with their nodes situated at the chemical potential . If the node position is not at the chemical potential (), transitions for the energies below are Pauli blocked, and Eq. (2) is modified to
| (3) |
where is the Heaviside step function and any carrier scattering is ignored. In this case, an intraband contribution to conductivity will also be present in the spectra. For finite electron scattering, the Heaviside function can be replaced, for example, by
| (4) |
with representing an appropriate scattering rate, and intraband conductivity can be approximated by a standard Drude ansatz Dressel and Grüner (2002).
In Ref. Carbotte (2016), it was shown that tilting the conical bands (relevant, e.g., for type-II Weyl semimetals Soluyanov et al. (2015); Xu et al. (2015c)) affects the linear behavior of optical conductivity: remains (quasi)linear, but experiences slope changes at certain frequency points, whose positions are related to and to the tilt angle.
For generalizations of Weyl bands with higher Chern numbers Mañes (2012); Bradlyn et al. (5037); Xu et al. (2011); Fang et al. (2012); Huang et al. (2016); Singh et al. (2018), the shape of depends on the band dispersion relations. In the so-called multifold semimetals, where a few linear (rotationally symmetric) bands with generally different slopes cross at a given point of the BZ Mañes (2012); Bradlyn et al. (5037), the optical conductivity is linear in frequency (up to the steps, related to the Pauli-blocked transitions) Sánchez-Martínez et al. (2019). For more complicated band structures, such as touching bands with a linear dispersion in one direction and parabolic dispersions in the remaining two Xu et al. (2011); Fang et al. (2012), is expected to be anisotropic Ahn et al. (2017a), in accordance with Eq. 1. Additionally, if the nodes are situated at different energies, as appears, e.g., in real multifold semimetals, changes its frequency run at different energy scales. The important point is that the total interband can often be decomposed into contributions from the nodes of each kind, simplifying interpretation of experimental spectra.
A particularly interesting case is the nodal-line semimetals (NLSMs) Burkov et al. (2011), where the presence of a continues line of nodes effectively reduces the dimensionality of the crossing electronic bands to . This reduced dimensionality leads to a frequency-independent according to Eq. 1. Earlier, such “flat” optical conductivities were predicted and experimentally observed in graphene and graphite Ando et al. (2002); Mak et al. (2008); Kuzmenko et al. (2008) with a universal conductance value per one graphene sheet, . In NLSMs, no universal sheet conductance is expected; instead is related to the length of the nodal line in a BZ Carbotte (2017); Mukherjee and Carbotte (2017a); Ahn et al. (2017b). For a circular nodal line, one has:
| (5) |
It is assumed here that the plane of the nodal circle is perpendicular to the electric-field component of the probing radiation and that there is no particle-hole asymmetry. For , a Pauli edge (Eqs. 3 and 4) occurs in the conductivity spectra.
III Linear optical response: Review of experimental results
III.1 Experiment versus computations
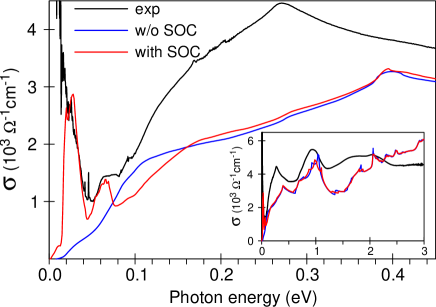
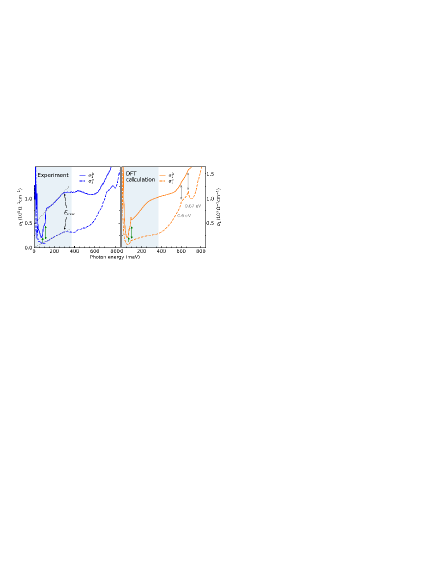
A large number of recent experiments are devoted to measuring optical conductivity in nodal-semimetal candidates Schilling et al. (2017a); Neubauer et al. (2018); Hütt et al. (2018); Ueda et al. (2012); Timusk et al. (2013); Chen et al. (2015); Sushkov et al. (2015); Xu et al. (2016); Chinotti et al. (2016); Neubauer et al. (2016); Schilling et al. (2017b); Qiu et al. (2018); Kemmler et al. (2018); Xu et al. (2018); Corasaniti et al. (2019); Martino et al. (2019); Qiu et al. (2019a, b); Maulana et al. (2019). There are also theoretical studies, where is computed for particular semimetal compounds based on their band structure Grassano et al. (2018a, b); Habe and Koshino (2018); Habe (2019); Li et al. (2019). Some studies combine both, experiment and band-structure-based computations Neubauer et al. (2018); Hütt et al. (2018); Chaudhuri et al. (2017); Ebad-Allah et al. (2019a); Shao et al. (2019). We would like to stress here that usually the match between measurements and such computations is only qualitative. In Figs. 2 and 3, we show two typical examples of the theory-vs-experiment spectra comparison – for YbMnBi2 and NbP, correspondingly. In both cases, the calculations reproduce the major features observed in the experimental conductivity, but fail to catch the exact frequency positions of the features and their spectral shapes. This result is not surprising, considering the well-known difficulties of ab initio optical-conductivity calculations, especially at low frequencies. It seems optimal to combine experimental studies with both, simple-model (or effective-Hamiltonian) approaches and ab initio calculations, as attempted, e.g., in Refs. Maulana et al. (2019); Chaudhuri et al. (2017); Ebad-Allah et al. (2019a); Shao et al. (2019). This may allow a deeper insight into the relation between the semimetal band structure and its optical conductivity. Additionally, band-selective optical-conductivity calculations are quite helpful. Such calculations are, however, rarely performed Neubauer et al. (2018); Chaudhuri et al. (2017); Ebad-Allah et al. (2019a).
III.2 Nodal-line semimetals
ZrSiS and its relatives. We start reviewing optical-conductivity measurements of nodal semimetals with ZrSiS. The reason for this is a relatively simple, basically model, band structure of this layered, quasi-two-dimensional, compound. (We note that all currently available optical measurements of ZrSiS and its relatives were performed on in-plane surfaces and showed no anisotropy, consistent with the tetragonal in-plane symmetry of these compounds.) ZrSiS possesses a nodal line, situated near the Fermi level Schoop et al. (2016); Neupane et al. (2016). Although the shape of the line is rather complex and, furthermore, the line is slightly gapped due to spin-orbit coupling (SOC), the linearity of the electronic bands forming this nodal line extends up to 0.5 eV, and other (nonlinear) bands do not cross the Fermi level. This makes ZrSiS one of the best systems for searching the signatures of Dirac electrons in the optical conductivity spectra.
Measurements of the optical conductivity in ZrSiS have been reported in Refs. Schilling et al. (2017a); Ebad-Allah et al. (2019a, b); Uykur et al. (2019). In Fig. 4, we display the real part of the optical conductivity obtained in Ref. Schilling et al. (2017a). The striking feature of the spectra is the flat, frequency-independent, region spanning from 250 to 2500 cm-1 (30 – 300 meV) for almost all temperatures investigated (at K, the flat region starts at a bit higher frequencies because of a broadened free-electron Drude mode). This observation is in perfect agreement with the simple-model predictions for NLSMs discussed above (Eqs. 1 and 5).
The sharp dip in the 10-K spectra could be interpreted as either a Pauli edge or the spin-orbit gap, enabling hence the upper estimate for the gap of around 30 meV. Our later magneto-optical investigations provide a more accurate value of 26 meV Uykur et al. (2019), in a reasonable agrement with the calculated value of 15 meV Schoop et al. (2016).
As frequency gets higher than 400 meV, first decreases and then increases again, demonstrating a U-shape behavior. Similar behavior was also observed in a number of related compounds – ZrSiSe, ZrGeS, and ZrGeTe Ebad-Allah et al. (2019a) – and reproduced in band-structure-based calculations for all four materials Habe and Koshino (2018); Ebad-Allah et al. (2019a). Interpretation of the high-energy upturn of the U-shaped conductivity is rather straightforward – it is due to transitions between almost parallel bands near the and points of the BZ of these compounds.
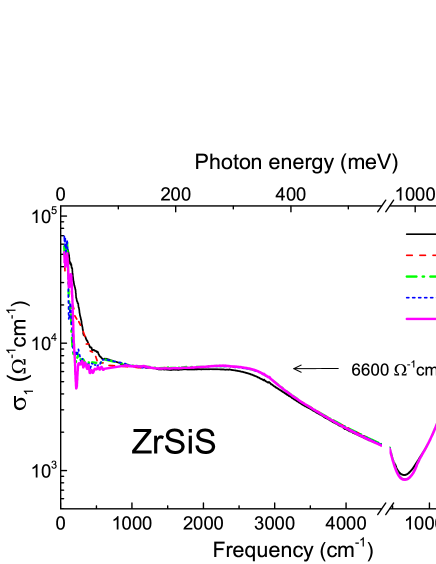
According to Ref. Ebad-Allah et al. (2019a), the low-energy part of the U-shaped conductivity, where is roughly proportional to , can be interpreted as being due to a “nodal plane” (cf. Eq. 1 for Dirac bands and ). In other words, there is a further electronic-band dimensionality reduction due to the quasi-two-dimensional (band) structure of these compounds: the dispersion is linear only in one -space direction, whereas it is almost absent along the nodal line, as well as in the out-of-plane direction. This nodal-plane picture can only work for relatively high frequencies, as otherwise the band structure cannot be approximated as two dimensional. Indeed, a basically frequency-independent is observed at low frequencies (below eV) in all four materials, albeit the frequency span of the flat conductivity is largest in ZrSiS.
These flat areas of cannot be accurately reproduced by the available calculations based on the band structure Habe and Koshino (2018); Ebad-Allah et al. (2019a). Instead, the calculated low-energy is found to increase with frequency. Habe and Koshino Habe and Koshino (2018) suggested that the observed flat conductivity might be a cumulative effect of the increasing interband conductivity and a decreasing Drude contribution. However, the experimental data do not support this explanation. As one can see from Fig. 4, the Drude term is very narrow and does not overlap with the flat region. Also, it is the interband conductivity (i.e., the conductivity after subtraction of the Drude modes), which shows the almost flat regions at low energies in Ref. Ebad-Allah et al. (2019a).
Overall, the flat interband conductivity of ZrSiS at low energies is a robust experiential result (in ZrSiSe, ZrGeS, and ZrGeTe, similar behavior is observed). The simple interpretation based on Eqs. 1 and 5 offers a good qualitative interpretation of this result. More advanced band-structure-based calculations of optical conductivity are required to provide a full description for these observations.
NbAs2. This material is another example of a NLSM. Unlike ZrSiS, the nodal lines in NbAs2 do not form closed loops or cages in a BZ, but span from one BZ to another. Most importantly, the nodal lines in NbAs2 are “dispersive”, meaning that the nodal-line energy position depends on the momentum. In fact, the nodal lines in ZrSiS and its relatives also possess such dispersion. However, it is much weaker than in NbAs2 and does not seem to affect the optical spectra appreciably. Similarly to ZrSiS, the nodal lines in NbAs2 are gapped. Shao et al. Shao et al. (2019) found in NbAs2 experimentally and also showed analytically that the optical conductivity due to the transitions between the linear bands, crossing along such dispersive nodal lines, demonstrates a linear-in-frequency, rather than a frequency-independent, behavior.
Indeed, the slope of the nodal line (i.e., , where represents the direction along the nodal line) plays the same role as the Fermi velocity of a linear band. Thus, for a band with a relatively large there will be no dimensionality reduction and the band can be considered as a 3D Dirac band with anisotropic Fermi velocity. If is not negligible, but still much smaller than the Fermi velocities in the directions perpendicular to the nodal line, will mostly be responsible for the slope of . The linear increase of is limited in frequency by the energy, corresponding to the difference between the extrema of the nodal-line energy positions. Above this frequency, becomes frequency-independent (if the bands forming the nodal line retain their linearity at these energies).
Such behavior of the optical conductivity was recorded in NbAs2, see Fig. 5. The optical conductivity is anisotropic, because the nodal lines span almost parallel to the axis. The linear behavior of is clearly seen in the measurements and can be nicely reproduced by DFT calculations. Perhaps, it is the best match between experiment and ab initio calculations reported for a nodal semimetal so far.
III.3 Weyl and Dirac semimetals
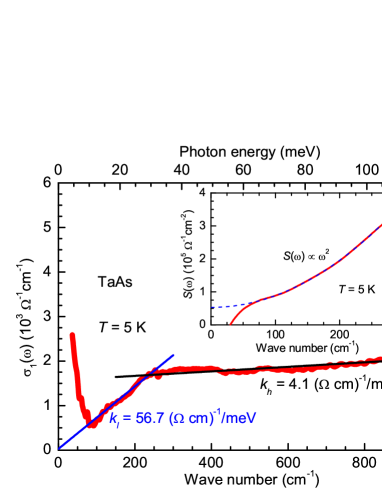
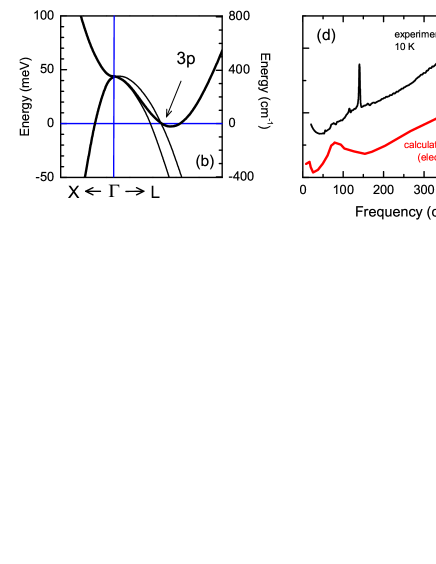
The TaAs family. TaAs was one of the first confirmed Weyl semimetals Lv et al. (2015); Huang et al. (2015); Yang et al. (2015) and its optical conductivity was reported as early as in 2016 Xu et al. (2016). This compound, as well as its family members (TaP, NbAs, and NbP), possesses 24 Weyl nodes, i.e., twelve pairs of the nodes with opposite chiralities Lv et al. (2015); Huang et al. (2015); Weng et al. (2015); Lee et al. (2015). The nodes are “leftovers” of nodal rings, which are gapped by SOC everywhere in BZ, except of these special points. The nodes can be divided in two groups, commonly dubbed as W1 () and W2 (). According to band-structure calculations, in TaAs the W1 (W2) nodes are situated around meV ( meV) below the Fermi level Grassano et al. (2018b); Lee et al. (2015).
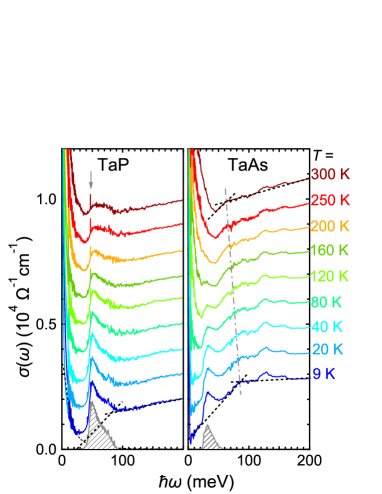
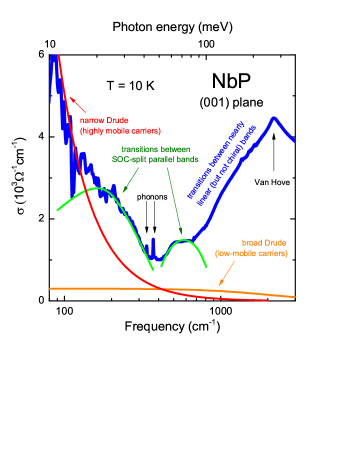
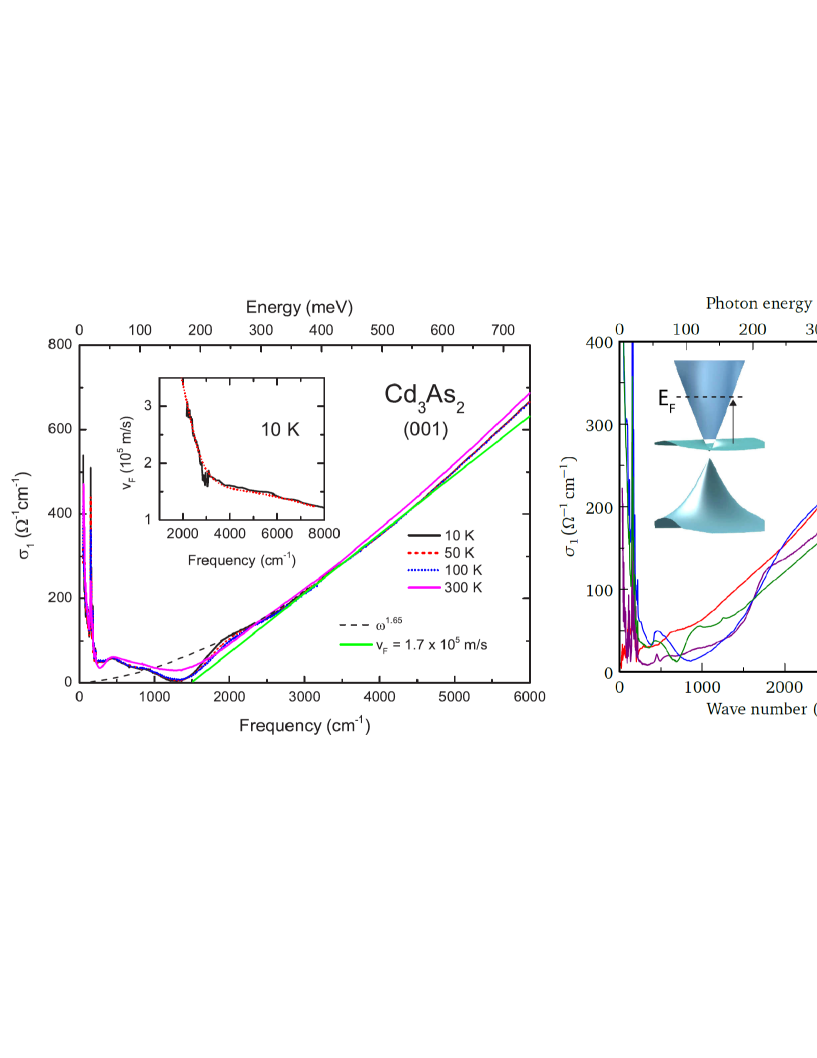
Fig. 6 reproduces the real part of TaAs optical conductivity obtained in Ref. Xu et al. (2016). The zero-frequency-centered Drude mode is followed by an almost linear , which changes its slope at around 25 meV. The low-frequency linear can be associated with the transitions between the linearly dispersing bands near the low-energy (W2) nodes. According to the spectra, the Pauli edge for these transitions should be situated at or below 10 meV, implying that the nodes are 5 meV off the Fermi level. This is not in disagreement with the band-structure calculations mentioned above: the accuracy of such calculations and the exact position of the Fermi level in a given sample are both within plus/minus a few meV.
The decreased slope of the linear for meV may look puzzling at first glance: at higher energies, the W1 nodes should start contributing to ; hence it should increase more rapidly with . To qualitatively explain the decreasing slope, one should recall that the Weyl nodes in TaAs are leftovers of gapped nodal lines. The bands, forming the W2 nodes, flatten out in the direction along the nodal lines at quite small energies (the nodal-line gap is in the tens-of-meV range). Thus, at these energies the optical response starts to remind the nodal-line situation: gets flattened.
One can notice that there is a small bump on the initial linear at some 15 meV. This bump was reproduced in later optical measurements of TaAs Kimura et al. (2017); a similar, but much stronger, peak was detected in TaP at comparable energies Kimura et al. (2017); Polatkan et al. (2019), see Fig. 7. In Ref. Kimura et al. (2017) these features were attributed to the transitions between the Lifshitz points of the bands forming the Weyl nodes (cf. Fig. 1, middle row).
Alternatively, such bumps might be related to the transitions between almost parallel bands split by SOC. Similar features were observed in our optical study of NbP at approximately 30 and 60 meV (see Fig. 3) and interpreted as being due to such transitions, based on ab initio band-resolved optical-conductivity calculations Neubauer et al. (2018). We are not aware of any band-structure-based optical-conductivity calculations for TaAs and TaP at low enough frequencies; thus, the correct interpretation of the observed low-energy peaks in these compounds is still to be found.
An interpretation of different spectral features detected in the optical conductivity of NbP is given in Fig. 8. The band-selective optical-conductivity computations seem to be the best way for making such assignments.
All optical-conductivity measurements of the TaAs family compounds discussed above have been performed on (001) surfaces, which have tetragonal crystallographic symmetry and no optical anisotropy. The out-of-plane response (with the electric-field component of the probing light parallel to [001] direction) was studied in Ref. Levy et al. (2020) for TaAs. A linear increase of the low-energy interband conductivity was also observed for this polarization at the energies below 25 meV.
Cd3As2. Cadmium arsenide is one of the first discovered Dirac semimetals Wang et al. (2013); Liu et al. (2014); Borisenko et al. (2014); Neupane et al. (2014); Jeon et al. (2014). Band-structure calculations Wang et al. (2013) predict two Dirac cones per BZ in this material. Its optical conductivity has been reported in a number of publications Neubauer et al. (2016); Crassee et al. (2018a); Jenkins et al. (2016); Akrap et al. (2016); Uykur et al. (2018) and its (magneto)-optical properties were recently thoroughly reviewed Crassee et al. (2018b).
In our brief review, we would like to point out that the (almost) linear-in-frequency interband conductivity is observed in Cd3As2 up to very high frequencies, signaling a large energy scale of the (quasi)linear electronic bands, see Fig. 9, where results collected on five different samples are displayed. The Pauli edge is observed in the spectra at 600 to 1700 cm-1, depending on the sample. This large variation of the Pauli-edge position is related to the naturally present As vacancies, whose concentration depends on sample-growth and annealing conditions. Additionally, free carriers in Cd3As2 demonstrate nonuniform spatial distribution, forming charge puddles with characteristic scales of 100 m, as demonstrated by optical microscopy Crassee et al. (2018a).
A closer inspection of the conductivity spectra reveals a slight superlinear increase of . This increase was attributed either to electron-self-energy effects or to deviations of the crossing bands from perfect linearity Neubauer et al. (2016). In the letter case, is energy dependent, as shown in the inset of the left panel in Fig. 9.
Concluding the subsection on Cd3As2, we note that the picture with two Dirac bands extending up to high energies (hundreds of meV) has been challenged by magneto-optical measurements Akrap et al. (2016), which are best consistent with a Kane-like model Kane (1957); Bodnar (1978, ) with three electronic bands, one of the bands being almost flat. (Dirac cones may still appear in this model, but on a much smaller energy scale, see the diagram in the right panel of Fig. 9). The tunneling data Jeon et al. (2014) can be (re)interpreted based on this model. It has been argued Crassee et al. (2018a) that the spectra are also consistent with the model. Still, band-structure calculations and ARPES results favor a Dirac, rather than a Kane-like, picture for Cd3As2. A full consensus about the electronic band structure of this material is still to be established.
Semimetals with strongly tilted Dirac or Weyl cones. As mentioned above, tilting the Dirac or Weyl cones should lead to the modifications of the interband optical conductivity: is still linear, but demonstrates changes in its slope at certain frequency points. A body of experimental work was conducted on materials with (supposedly) strongly tilted 3D Dirac or Weyl cones Chaudhuri et al. (2017); Chinotti et al. (2016); Beyer et al. (2016); Frenzel et al. (2017); Kimura et al. (2019). Linear portions of experimental were indeed reported, e.g., for YbMnBi2 – a type-II Weyl semimetal candidate. However, intraband contribution often masks the interband optical transitions in such materials. This is particularly relevant for type-II semimetals, where free carriers exist even if the chemical potential is situated at the nodal point Zhu et al. (2016) and, hence, Drude-like contributions are supposed to dominate the optical-conductivity spectra. This was indeed observed, for example, in WTe2 and MoTe2 Frenzel et al. (2017); Kimura et al. (2019).
III.4 Triple-point semimetals
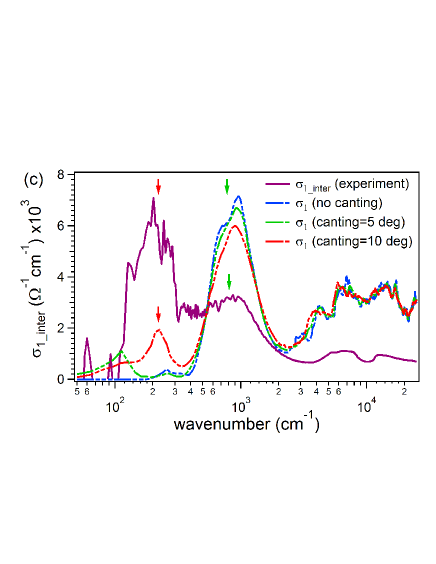
The existence of triple points, where one nondegenerate and one doubly degenerate band cross, implies the presence of bulk nodal lines in the band structure of triple-point semimetals (TPSMs) Zhu et al. (2016). Because of this band-structure complexity, no simple models for the optical conductivity are available for these materials. Thus, a comparison between experiment and band-structure-based computations is the way to interpret in TPSMs. As an example, we review below the results of our optical-conductivity measurements in GdPtBi Hütt et al. (2018), a TPSM and a member of the half-Heusler family, which is recognized for a broad variety of exotic and potentially functional properties Chadov et al. (2010); Lin et al. (2010).
In the paramagnetic state (GdPtBi enters the antiferromagnetic state at 9 K Canfield et al. (2016) – this phase was not examined by optics), at low temperatures (e.g., at 10 to 50 K), we found in GdPtBi to be linear in a broad frequency range: the linearity spans down to 100 cm-1, see Fig. 10 (a,d), indicating a low free-carrier density. Unlike the situation in a simple conical band, this linearity is not due to the transitions within such a band. Our calculations showed instead that the linear is a cumulative effect of transitions between a few bands with predominantly, but not exclusively, linear dispersion relations (Fig. 10 (b)). We also found that varying the position of the chemical potential within only meV drastically changes the overall shape of , as demonstrated in Fig. 10 (c). Thus, the simple conical dispersion, where only affects the frequency position of the Pauli edge, see Eqs. 3 and 4, is obviously not relevant for GdPtBi.
III.5 Multifold semimetals
Multifold semimetals – the materials, which possess the characteristic electronic band crossings with degeneracies higher than two Mañes (2012); Bradlyn et al. (5037) – attract currently a lot of attention. This electronic phase may occur in noncentrosymmetric compounds with no mirror planes. A number of multifold semimetals were recently predicted and experimentally confirmed, leading to a realization of “topological chiral crystals” Chang et al. (2018, 2017); Tang et al. (2017); Sanchez et al. (2019); Rao et al. (2019); Schröter et al. (2019); Takane et al. (2019). Among other chirality-related properties, these materials are believed to demonstrate a peculiar nonlinear optical phenomenon – the quantized circular photogalvanic effect (QCPGE) de Juan et al. (2017). In this effect, the circularly polarized photons excite the chiral band carriers in such a way that the resultant photocurrent is quantized in units of material-independent fundamental constants. Recently, the observation of QCPGE was reported in RhSi Rees et al. , an established multifold semimetal Chang et al. (2017); Tang et al. (2017); Sanchez et al. (2019). The knowledge of frequency-dependent linear conductivity in multifold semimetals is also essential, in particular, for a proper interpretation of QCPGE experiments. Here, we review recent reports on experimental determination of in RhSi Maulana et al. (2019); Rees et al. and compare the obtained results with the available theoretical calculations Sánchez-Martínez et al. (2019); Li et al. (2019). As noticed above, the optical conductivity of multifold semimetals is supposed to demonstrate a linear-in-frequency , similarly to 3D Dirac and Weyl semimetals.
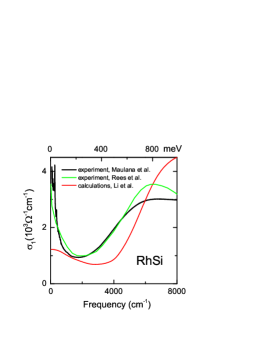
Fig. 11 shows experimental Maulana et al. (2019); Rees et al. and calculated Li et al. (2019) optical conductivity of RhSi. The experimental curves follow each other quite well. The deviations between the curves can be explained by different free-carrier contributions. Despite some discrepancy between the calculations and both experimental curves, the match can be considered as satisfactory (cf. Figs. 2 and 3). Both low-energy features of the interband experimental conductivity – the initial (i.e., for the frequencies just above the Drude roll-off) linear increase and the further flattening – are reproduced by theory.
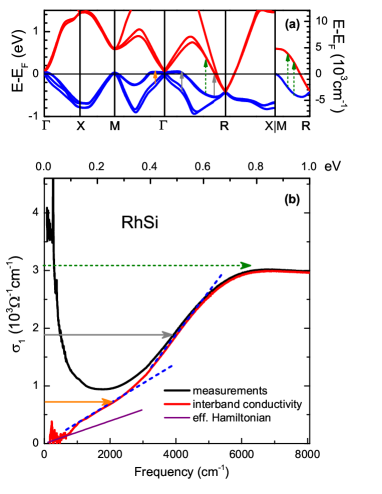
To establish a better connection between the features observed in the most interesting, low-energy, part of the experimental conductivity and the interband optical transitions, in Fig. 12 we show from Ref. Maulana et al. (2019) together with the low-energy band structure of RhSi. Additionally, the interband contribution to the optical conductivity, , from this reference, is presented. At the lowest frequencies (below approximately 2500 cm-1), the interband conductivity is entirely caused by transitions in the vicinity of the point. No other interband optical transitions are possible (either the direct gap between the bands is too large, or the transitions are Pauli blocked). The bands near the point are all roughly linear (two of them are basically flat); thus, a linear-in-frequency interband conductivity is expected Sánchez-Martínez et al. (2019). Indeed, is proportional to frequency in this range (cf. the orange arrows in both panels of Fig. 12). At somewhat higher frequencies ( cm-1), the flat bands start to disperse downward; thus, the linearity of is not expected anymore. However, the interband contributions in the vicinity of the points become allowed at roughly the same energy (see the grey arrows in panel (a)). These transitions provide a dominating contribution to conductivity, and the linear-in-frequency increase of is restored with a larger slope (the grey arrow in panel (b)). At frequencies above cm-1, the optical conductivity flattens out, forming a broad flat maximum. It can be attributed to the transitions between the almost (but not exactly) parallel bands along the – line, which are shown as dotted green arrows. The maximum is not sharp because other transitions with comparable energies also contribute at these frequencies; see, e.g., the dotted green arrow between the and R points. In Fig. 12, we also show the results of effective-Hamiltonian calculations Sánchez-Martínez et al. (2019) for the contributions near the point. An extrapolation of these calculations (originally performed for frequencies below cm-1) to higher frequencies is shown as a solid purple line. The experimental is generally steeper than the results of these calculations. The mismatch can be related to deviations of the bands from linearity even at low energies Li et al. (2019); Chang et al. (2017); Tang et al. (2017). This can be clarified in more advanced band-structure-based optical-conductivity calculations. In any case, the predicted linear run of is experimentally confirmed for a multifold semimetal.
III.6 Linear-in-frequency conductivity in other materials
The fact that 3D Dirac and Weyl semimetals were predicted to demonstrate a quite unusual (linear-in-frequency) optical conductivity, stimulated experimental efforts in finding such in different materials and in making proposals based on these observations. For example, Timusk et al. Timusk et al. (2013) reported a linear in a number of quasicrystals and suggested the presence of 3D Dirac fermions in these materials. To our knowledge, this proposition remains to be confirmed by other experimental methods, as well as by theory. The original forecasts of a Weyl state in pyrochlore iridates Wan et al. (2011) stimulated an optical study of Eu2Ir2O7, where linear was observed in a limited range at low energies Sushkov et al. (2015). Up to now, no firm confirmations of a Weyl state in this or other pyrochlore iridates are reported; they are currently believed to be trivial antiferromagnetic insulators with important role of electron correlations Nakayama et al. (2016); Wang et al. (2017a, b). Interestingly to note that linear in a broad frequency range was observed in BaCoS2, another material with strong electron correlations Santos-Cottin et al. (2018). This linearity was not attributed to 3D conical bands (which actually do not exist in this compound), but to an effect of electron correlations. These examples, as well as the case of GdPtBi discussed above, demonstrate once again that interpretations of linear should always be made with care and theory output is essential for such interpretations.
IV Conclusions
When graphene shifted in the focus of condensed matter physics, its constant in frequency conductivity appeared as a peculiarity at first glance. Soon it became clear that this was the tip of an iceberg: materials with interesting band structure and topology are predicted and discovered at a rapid pace since. The Dirac cones in graphene are just a particular case of a class of systems that is not restricted to two dimensions. Different nodal semimetals, possessing conical bands in their bulk, are currently at the center of studies, and conductivity of these materials is directly related to the electronic band dispersion and dimensionality. Albeit ARPES is surely the most proper method to study the band structure and Fermi surface, its severe restriction to the sample surface often causes problems that can be overcome by optical methods, as a genuine bulk sensitive technique. In this brief survey, we considered a representative selection of recent experimental results on optical studies of different nodal semimetals. The presented examples demonstrate the abilities, as well as limitations, of linear optics to reveal the bulk band structure at low energies.
Acknowledgements.
We thank the Deutsche Forschungsgemeinschaft (DFG) for financial support.References
- Murakami (2007) S. Murakami, New J. Phys. 9, 356 (2007).
- Kobayashi et al. (2007) A. Kobayashi, S. Katayama, Y. Suzumura, and H. Fukuyama, J. Phys. Soc. Jpn. 76, 034711 (2007).
- Wan et al. (2011) X. Wan, A. M. Turner, A. Vishwanath, and S. Y. Savrasov, Phys. Rev. B 83, 205101 (2011).
- Burkov and Balents (2011) A. A. Burkov and L. Balents, Phys. Rev. Lett. 107, 127205 (2011).
- Burkov et al. (2011) A. A. Burkov, M. D. Hook, and L. Balents, Phys. Rev. B 84, 235126 (2011).
- Park et al. (2011) J. Park, G. Lee, F. Wolff-Fabris, Y. Y. Koh, M. J. Eom, Y. K. Kim, M. A. Farhan, Y. J. Jo, C. Kim, J. H. Shim, and J. S. Kim, Phys. Rev. Lett. 107, 126402 (2011).
- Mañes (2012) J. L. Mañes, Phys. Rev. B 85, 155118 (2012).
- Wang et al. (2012) Z. Wang, Y. Sun, X.-Q. Chen, C. Franchini, G. Xu, H. Weng, X. Dai, and Z. Fang, Phys. Rev. B 85, 195320 (2012).
- Wang et al. (2013) Z. Wang, H. Weng, Q. Wu, X. Dai, and Z. Fang, Phys. Rev. B 88, 125427 (2013).
- Liu et al. (2014) Z. K. Liu, J. Jiang, B. Zhou, Z. J. Wang, Y. Zhang, H. M. Weng, D. Prabhakaran, S.-K. Mo, H. Peng, P. Dudin, T. Kim, M. Hoesch, Z. Fang, X. Dai, Z. X. Shen, D. L. Feng, Z. Hussain, and Y. L. Chen, Nature Mater. 13, 677 (2014).
- Borisenko et al. (2014) S. Borisenko, Q. Gibson, D. Evtushinsky, V. Zabolotnyy, B. Büchner, and R. J. Cava, Phys. Rev. Lett. 113, 027603 (2014).
- Neupane et al. (2014) M. Neupane, S.-Y. Xu, R. Sankar, N. Alidoust, G. Bian, C. Liu, I. Belopolski, T.-R. Chang, H.-T. Jeng, H. Lin, A. Bansil, F. Chou, and M. Z. Hasan, Nat. Commun. 5, 3786 (2014).
- Vafek and Vishwanath (2014) O. Vafek and A. Vishwanath, Annu. Rev. Condens. Matter Phys. 5, 83 (2014).
- Lv et al. (2015) B. Q. Lv, H. M. Weng, B. B. Fu, X. P. Wang, H. Miao, J. Ma, P. Richard, X. C. Huang, L. X. Zhao, G. F. Chen, Z. Fang, X. Dai, T. Qian, and H. Ding, Phys. Rev. X 5, 031013 (2015).
- Huang et al. (2015) S.-M. Huang, S.-Y. Xu, I. Belopolski, C.-C. Lee, G. Chang, B. Wang, N. Alidoust, G. Bian, M. Neupane, C. Zhang, S. Jia, A. Bansil, H. Lin, and M. Z. Hasan, Nat. Commun. 6, 7373 (2015).
- Shekhar et al. (2015) C. Shekhar, A. K. Nayak, Y. Sun, M. Schmidt, M. Nicklas, I. Leermakers, U. Zeitler, Y. Skourski, J. Wosnitza, Z. Liu, Y. Chen, W. Schnelle, H. Borrmann, Y. Grin, C. Felser, and B. Yan, Nat. Phys. 11, 645 (2015).
- Weng et al. (2015) H. Weng, C. Fang, Z. Fang, B. A. Bernevig, and X. Dai, Phys. Rev. X 5, 011029 (2015).
- Xu et al. (2015a) S.-Y. Xu, I. Belopolski, N. Alidoust, M. Neupane, G. Bian, C. Zhang, R. Sankar, G. Chang, Z. Yuan, C.-C. Lee, S.-M. Huang, H. Zheng, J. Ma, D. S. Sanchez, B. Wang, A. Bansil, F. Chou, P. P. Shibayev, H. Lin, S. Jia, and M. Z. Hasan, Science 349, 613 (2015a).
- Xu et al. (2015b) D.-F. Xu, Y.-P. Du, Z. Wang, Y.-P. Li, X.-H. Niu, Q. Yao, P. Dudin, Z.-A. Xu, X.-G. Wan, and D.-L. Feng, Chin. Phys. Lett. 32, 107101 (2015b).
- Wang et al. (2016) Z. Wang, Y. Zheng, Z. Shen, Y. Lu, H. Fang, F. Sheng, Y. Zhou, X. Yang, Y. Li, C. Feng, and Z.-A. Xu, Phys. Rev. B 93, 121112 (2016).
- Chiu et al. (2016) C.-K. Chiu, J. C. Y. Teo, A. P. Schnyder, and S. Ryu, Rev. Mod. Phys. 88, 035005 (2016).
- Zhu et al. (2016) Z. Zhu, G. W. Winkler, Q. Wu, J. Li, and A. A. Soluyanov, Phys. Rev. X 6, 031003 (2016).
- Bradlyn et al. (5037) B. Bradlyn, J. Cano, Z. Wang, M. G. Vergniory, C. Felser, R. J. Cava, and B. A. Bernevig, Science 353, 2016 (aaf5037).
- Armitage et al. (2018) N. P. Armitage, E. J. Mele, and A. Vishwanath, Rev. Mod. Phys. 90, 015001 (2018).
- Wehling et al. (2014) T. O. Wehling, A. M. Black-Schaffer, and A. V. Balatsky, Adv. Phys. 63, 1 (2014).
- Schilling et al. (2017a) M. B. Schilling, L. M. Schoop, B. V. Lotsch, M. Dressel, and A. V. Pronin, Phys. Rev. Lett. 119, 187401 (2017a).
- Neubauer et al. (2018) D. Neubauer, A. Yaresko, W. Li, A. Löhle, R. Hübner, M. B. Schilling, C. Shekhar, C. Felser, M. Dressel, and A. V. Pronin, Phys. Rev. B 98, 195203 (2018).
- Hütt et al. (2018) F. Hütt, A. Yaresko, M. B. Schilling, C. Shekhar, C. Felser, M. Dressel, and A. V. Pronin, Phys. Rev. Lett. 121, 176601 (2018).
- Witczak-Krempa et al. (2014) W. Witczak-Krempa, G. Chen, Y. B. Kim, and L. Balents, Annu. Rev. Condens. Matter Phys. 5, 57 (2014).
- Dzero et al. (2016) M. Dzero, J. Xia, V. Galitski, and P. Coleman, Annu. Rev. Condens. Matter Phys. 7, 249 (2016).
- Liu et al. (2016) D. Liu, K. Ishikawa, R. Takehara, K. Miyagawa, M. Tamura, and K. Kanoda, Phys. Rev. Lett. 116, 226401 (2016).
- Fujioka et al. (2017) J. Fujioka, T. Okawa, A. Yamamoto, and Y. Tokura, Phys. Rev. B 95, 121102 (2017).
- Ye et al. (2018) L. Ye, M. Kang, J. Liu, F. von Cube, C. R. Wicker, T. Suzuki, C. Jozwiak, A. Bostwick, E. Rotenberg, D. C. Bell, L. Fu, R. Comin, and J. G. Checkelsky, Nature 555, 638 (2018).
- P. Rinkel et al. (2017) P. P. Rinkel, P. L. S. Lopes, and I. Garate, Phys. Rev. Lett. 119, 107401 (2017).
- Hui et al. (2019) A. Hui, Y. Zhang, and E.-A. Kim, Phys. Rev. B 100, 085144 (2019).
- Corasaniti et al. (2019) M. Corasaniti, R. Yang, A. Pal, M. Chinotti, L. Degiorgi, A. Wang, and C. Petrovic, Phys. Rev. B 100, 041107 (2019).
- Xu et al. (2017) B. Xu, Y. M. Dai, L. X. Zhao, K. Wang, R. Yang, W. Zhang, J. Y. Liu, H. Xiao, G. F. Chen, S. A. Trugman, J.-X. Zhu, A. J. Taylor, D. A. Yarotski, R. P. Prasankumar, and X. G. Qiu, Nat. Commun. 8, 14933 (2017).
- Maulana et al. (2019) L. Z. Maulana, K. Manna, E. Uykur, C. Felser, M. Dressel, and A. V. Pronin, arXiv:1911.11538 (2019).
- Ashby and Carbotte (2014) P. E. C. Ashby and J. P. Carbotte, Phys. Rev. B 89, 245121 (2014).
- Carbotte (2016) J. P. Carbotte, Phys. Rev. B 94, 165111 (2016).
- Tabert et al. (2016) C. J. Tabert, J. P. Carbotte, and E. J. Nicol, Phys. Rev. B 93, 085426 (2016).
- Tabert and Carbotte (2016) C. J. Tabert and J. P. Carbotte, Phys. Rev. B 93, 085442 (2016).
- Carbotte (2017) J. P. Carbotte, J. Phys.: Condens. Matter 29, 045301 (2017).
- Mukherjee and Carbotte (2017a) S. P. Mukherjee and J. P. Carbotte, Phys. Rev. B 95, 214203 (2017a).
- Mukherjee and Carbotte (2017b) S. P. Mukherjee and J. P. Carbotte, J. Phys.: Condens. Matter 29, 425301 (2017b).
- Mukherjee and Carbotte (2018) S. P. Mukherjee and J. P. Carbotte, Phys. Rev. B 97, 045150 (2018).
- Carbotte et al. (2019) J. P. Carbotte, K. R. Bryenton, and E. J. Nicol, Phys. Rev. B 99, 115406 (2019).
- Carbotte and Nicol (2019) J. P. Carbotte and E. J. Nicol, Phys. Rev. B 100, 035441 (2019).
- Hosur et al. (2012) P. Hosur, S. A. Parameswaran, and A. Vishwanath, Phys. Rev. Lett. 108, 046602 (2012).
- Bácsi and Virosztek (2013) A. Bácsi and A. Virosztek, Phys. Rev. B 87, 125425 (2013).
- Dressel and Grüner (2002) M. Dressel and G. Grüner, Electrodynamics of Solids (Cambridge University Press, Cambridge, 2002).
- Soluyanov et al. (2015) A. A. Soluyanov, D. Gresch, Z. Wang, Q. Wu, M. Troyer, X. Dai, and B. A. Bernevig, Nature 527, 495 (2015).
- Xu et al. (2015c) Y. Xu, F. Zhang, and C. Zhang, Phys. Rev. Lett. 115, 265304 (2015c).
- Xu et al. (2011) G. Xu, H. Weng, Z. Wang, X. Dai, and Z. Fang, Phys. Rev. Lett. 107, 186806 (2011).
- Fang et al. (2012) C. Fang, M. J. Gilbert, X. Dai, and B. A. Bernevig, Phys. Rev. Lett. 108, 266802 (2012).
- Huang et al. (2016) S.-M. Huang, S.-Y. Xu, I. Belopolski, C.-C. Lee, G. Chang, T.-R. Chang, B. Wang, N. Alidoust, G. Bian, M. Neupane, D. Sanchez, H. Zheng, H.-T. Jeng, A. Bansil, T. Neupert, H. Lin, and M. Z. Hasan, PNAS 113, 1180 (2016).
- Singh et al. (2018) B. Singh, G. Chang, T.-R. Chang, S.-M. Huang, C. Su, M.-C. Lin, H. Lin, and A. Bansil, Sci. Rep. 8, 10540 (2018).
- Sánchez-Martínez et al. (2019) M.-A. Sánchez-Martínez, F. de Juan, and A. G. Grushin, Phys. Rev. B 99, 155145 (2019).
- Ahn et al. (2017a) S. Ahn, E. J. Mele, and H. Min, Phys. Rev. B 95, 161112 (2017a).
- Ando et al. (2002) T. Ando, Y. Zheng, and H. Suzuura, J. Phys. Soc. Japan 71, 1318 (2002).
- Mak et al. (2008) K. F. Mak, M. Y. Sfeir, Y. Wu, C. H. Lui, J. A. Misewich, and T. F. Heinz, Phys. Rev. Lett. 101, 196405 (2008).
- Kuzmenko et al. (2008) A. B. Kuzmenko, E. van Heumen, F. Carbone, and D. van der Marel, Phys. Rev. Lett. 100, 117401 (2008).
- Ahn et al. (2017b) S. Ahn, E. J. Mele, and H. Min, Phys. Rev. Lett. 119, 147402 (2017b).
- Chaudhuri et al. (2017) D. Chaudhuri, B. Cheng, A. Yaresko, Q. D. Gibson, R. J. Cava, and N. P. Armitage, Phys. Rev. B 96, 075151 (2017).
- Ueda et al. (2012) K. Ueda, J. Fujioka, Y. Takahashi, T. Suzuki, S. Ishiwata, Y. Taguchi, and Y. Tokura, Phys. Rev. Lett. 109, 136402 (2012).
- Timusk et al. (2013) T. Timusk, J. P. Carbotte, C. C. Homes, D. N. Basov, and S. G. Sharapov, Phys. Rev. B 87, 235121 (2013).
- Chen et al. (2015) R. Y. Chen, S. J. Zhang, J. A. Schneeloch, C. Zhang, Q. Li, G. D. Gu, and N. L. Wang, Phys. Rev. B 92, 075107 (2015).
- Sushkov et al. (2015) A. B. Sushkov, J. B. Hofmann, G. S. Jenkins, J. Ishikawa, N. Nakatsuji, S. Das Sarma, and H. D. Drew, Phys. Rev. B 92, 241108 (2015).
- Xu et al. (2016) B. Xu, Y. M. Dai, L. X. Zhao, K. Wang, R. Yang, W. Zhang, J. Y. Liu, H. Xiao, G. F. Chen, A. J. Taylor, D. A. Yarotski, R. P. Prasankumar, and X. G. Qiu, Phys. Rev. B 93, 121110 (2016).
- Chinotti et al. (2016) M. Chinotti, A. Pal, W. J. Ren, C. Petrovic, and L. Degiorgi, Phys. Rev. B 94, 245101 (2016).
- Neubauer et al. (2016) D. Neubauer, J. P. Carbotte, A. A. Nateprov, A. Löhle, M. Dressel, and A. V. Pronin, Phys. Rev. B 93, 121202 (2016).
- Schilling et al. (2017b) M. B. Schilling, A. Löhle, D. Neubauer, C. Shekhar, C. Felser, M. Dressel, and A. V. Pronin, Phys. Rev. B 95, 155201 (2017b).
- Qiu et al. (2018) Z. Qiu, C. Le, Y. Dai, B. Xu, J. B. He, R. Yang, G. Chen, J. Hu, and X. Qiu, Phys. Rev. B 98, 115151 (2018).
- Kemmler et al. (2018) R. Kemmler, R. Hübner, A. Löhle, D. Neubauer, I. Voloshenko, L. M. Schoop, M. Dressel, and A. V. Pronin, J. Phys.: Condens. Matter 30, 485403 (2018).
- Xu et al. (2018) B. Xu, L. X. Zhao, P. Marsik, E. Sheveleva, F. Lyzwa, Y. M. Dai, G. F. Chen, X. G. Qiu, and C. Bernhard, Phys. Rev. Lett. 121, 187401 (2018).
- Martino et al. (2019) E. Martino, I. Crassee, G. Eguchi, D. Santos-Cottin, R. D. Zhong, G. D. Gu, H. Berger, Z. Rukelj, M. Orlita, C. C. Homes, and A. Akrap, Phys. Rev. Lett. 122, 217402 (2019).
- Qiu et al. (2019a) Z. Qiu, C. Le, Z. Liao, B. Xu, R. Yang, J. Hu, Y. Dai, and X. Qiu, Phys. Rev. B 100, 125136 (2019a).
- Qiu et al. (2019b) Z.-Y. Qiu, Z.-Y. Liao, and X.-G. Qiu, Chin. Phys. B 28, 047801 (2019b).
- Grassano et al. (2018a) D. Grassano, F. Bechstedt, and O. Pulci, J. Appl. Phys. 124, 205110 (2018a).
- Grassano et al. (2018b) D. Grassano, O. Pulci, A. M. Conte, and F. Bechstedt, Sci. Rep. 8, 3534 (2018b).
- Habe and Koshino (2018) T. Habe and M. Koshino, Phys. Rev. B 98, 125201 (2018).
- Habe (2019) T. Habe, Phys. Rev. B 100, 245131 (2019).
- Li et al. (2019) Z. Li, T. Iitaka, H. Zeng, and H. Su, Phys. Rev. B 100, 155201 (2019).
- Ebad-Allah et al. (2019a) J. Ebad-Allah, J. F. Afonso, M. Krottenmüller, J. Hu, Y. L. Zhu, Z. Q. Mao, J. Kuneš, and C. A. Kuntscher, Phys. Rev. B 99, 125154 (2019a).
- Shao et al. (2019) Y. Shao, Z. Sun, Y. Wang, C. Xu, R. Sankar, A. J. Breindel, C. Cao, M. M. Fogler, A. J. Millis, F. Chou, Z. Li, T. Timusk, M. B. Maple, and D. N. Basov, PNAS 116, 1168 (2019).
- Schoop et al. (2016) L. M. Schoop, M. N. Ali, C. Straßer, A. Topp, A. Varykhalov, D. Marchenko, V. Duppel, S. S. P. Parkin, B. V. Lotsch, and C. R. Ast, Nat. Comm. 7, 11696 (2016).
- Neupane et al. (2016) M. Neupane, I. Belopolski, M. M. Hosen, D. S. Sanchez, R. Sankar, M. Szlawska, S.-Y. Xu, K. Dimitri, N. Dhakal, P. Maldonado, P. M. Oppeneer, D. Kaczorowski, F. Chou, M. Z. Hasan, and T. Durakiewicz, Phys. Rev. B 93, 201104 (2016).
- Ebad-Allah et al. (2019b) J. Ebad-Allah, M. Krottenmüller, J. Hu, Y. L. Zhu, Z. Q. Mao, and C. A. Kuntscher, Phys. Rev. B 99, 245133 (2019b).
- Uykur et al. (2019) E. Uykur, L. Z. Maulana, L. M. Schoop, B. V. Lotsch, M. Dressel, and A. V. Pronin, Phys. Rev. Research 1, 032015 (2019).
- Yang et al. (2015) L. X. Yang, Z. K. Liu, Y. Sun, H. Peng, H. F. Yang, T. Zhang, B. Zhou, Y. Zhang, Y. F. Guo, M. Rahn, D. Prabhakaran, Z. Hussain, S.-K. Mo, C. Felser, B. Yan, and Y. L. Chen, Nat. Phys. 11, 728 (2015).
- Lee et al. (2015) C.-C. Lee, S.-Y. Xu, S.-M. Huang, D. S. Sanchez, I. Belopolski, G. Chang, G. Bian, N. Alidoust, H. Zheng, M. Neupane, B. Wang, A. Bansil, M. Z. Hasan, and H. Lin, Phys. Rev. B 92, 235104 (2015).
- Kimura et al. (2017) S.-i. Kimura, H. Yokoyama, H. Watanabe, J. Sichelschmidt, V. Süß, M. Schmidt, and C. Felser, Phys. Rev. B 96, 075119 (2017).
- Crassee et al. (2018a) I. Crassee, E. Martino, C. C. Homes, O. Caha, J. Novák, P. Tückmantel, M. Hakl, A. Nateprov, E. Arushanov, Q. D. Gibson, R. J. Cava, S. M. Koohpayeh, K. E. Arpino, T. M. McQueen, M. Orlita, and A. Akrap, Phys. Rev. B 97, 125204 (2018a).
- Polatkan et al. (2019) S. Polatkan, M. O. Goerbig, J. Wyzula, R. Kemmler, L. Z. Maulana, B. A. Piot, I. Crassee, A. Akrap, C. Shekhar, C. Felser, M. Dressel, A. V. Pronin, and M. Orlita, arXiv:1912.07327 (2019).
- Levy et al. (2020) A. L. Levy, A. B. Sushkov, F. Liu, B. Shen, N. Ni, H. D. Drew, and G. S. Jenkins, Phys. Rev. B 101, 125102 (2020).
- Jeon et al. (2014) S. Jeon, B. B. Zhou, A. Gyenis, B. E. Feldman, I. Kimchi, A. C. Potter, Q. D. Gibson, R. J. Cava, A. Vishwanath, and A. Yazdani, Nature Mater. 13, 851 (2014).
- Jenkins et al. (2016) G. S. Jenkins, C. Lane, B. Barbiellini, A. B. Sushkov, R. L. Carey, F. Liu, J. W. Krizan, S. K. Kushwaha, Q. Gibson, T.-R. Chang, H.-T. Jeng, H. Lin, R. J. Cava, A. A. Bansil, and H. D. Drew, Phys. Rev. B 94, 085121 (2016).
- Akrap et al. (2016) A. Akrap, M. Hakl, S. Tchoumakov, I. Crassee, J. Kuba, M. O. Goerbig, C. C. Homes, O. Caha, J. Novák, F. Teppe, W. Desrat, S. Koohpayeh, L. Wu, N. P. Armitage, A. Nateprov, E. Arushanov, Q. D. Gibson, R. J. Cava, D. van der Marel, B. A. Piot, C. Faugeras, G. Martinez, M. Potemski, and M. Orlita, Phys. Rev. Lett. 117, 136401 (2016).
- Uykur et al. (2018) E. Uykur, R. Sankar, D. Schmitz, and C. A. Kuntscher, Phys. Rev. B 97, 195134 (2018).
- Crassee et al. (2018b) I. Crassee, R. Sankar, W.-L. Lee, A. Akrap, and M. Orlita, Phys. Rev. Materials 2, 120302 (2018b).
- Kane (1957) E. O. Kane, J. Phys. Chem. Solids 1, 249 (1957).
- Bodnar (1978) J. Bodnar, in “Physics of narrow gap semiconductors: proceedings of the III international conference, Warszawa, September 12-15, 1977”, edited by J. Raułuszkiewicz, M. Górska, and E. Kaczmarek (Elsevier, Amsterdam, New York, 1978) p. 311.
- (103) J. Bodnar, arXiv:1709.05845 .
- Beyer et al. (2016) R. Beyer, A. Dengl, T. Peterseim, S. Wackerow, T. Ivek, A. V. Pronin, D. Schweitzer, and M. Dressel, Phys. Rev. B 93, 195116 (2016).
- Frenzel et al. (2017) A. J. Frenzel, C. C. Homes, Q. D. Gibson, Y. M. Shao, K. W. Post, A. Charnukha, R. J. Cava, and D. N. Basov, Phys. Rev. B 95, 245140 (2017).
- Kimura et al. (2019) S.-i. Kimura, Y. Nakajima, Z. Mita, R. Jha, R. Higashinaka, T. D. Matsuda, and Y. Aoki, Phys. Rev. B 99, 195203 (2019).
- Chadov et al. (2010) S. Chadov, X. Qi, J. Kübler, G. H. Fecher, C. Felser, and S. C. Zhang, Nat. Mater. 9, 541 (2010).
- Lin et al. (2010) H. Lin, L. A. Wray, Y. Xia, S. Xu, S. Jia, R. J. Cava, A. Bansil, and M. Z. Hasan, Nat. Mater. 9, 546 (2010).
- Canfield et al. (2016) P. C. Canfield, J. D. Thompson, W. P. Beyermann, A. Lacerda, M. F. Hundley, E. Peterson, and Z. Fisk, J. Appl. Phys. 70, 1991 (2016).
- Chang et al. (2018) G. Chang, B. J. Wieder, F. Schindler, D. S. Sanchez, I. Belopolski, S.-M. Huang, B. Singh, D. Wu, T.-R. Chang, T. Neupert, S.-Y. Xu, H. Lin, and M. Z. Hasan, Nat. Mater. 17, 978 (2018).
- Chang et al. (2017) G. Chang, S.-Y. Xu, B. J. Wieder, D. S. Sanchez, S.-M. Huang, I. Belopolski, T.-R. Chang, S. Zhang, A. Bansil, H. Lin, and M. Z. Hasan, Phys. Rev. Lett. 119, 206401 (2017).
- Tang et al. (2017) P. Tang, Q. Zhou, and S.-C. Zhang, Phys. Rev. Lett. 119, 206402 (2017).
- Sanchez et al. (2019) D. S. Sanchez, I. Belopolski, T. A. Cochran, X. Xu, J.-X. Yin, G. Chang, W. Xie, K. Manna, V. Süß, C.-Y. Huang, N. Alidoust, D. Multer, S. S. Zhang, N. Shumiya, X. Wang, G.-Q. Wang, T.-R. Chang, C. Felser, S.-Y. Xu, S. Jia, H. Lin, and M. Z. Hasan, Nature 567, 500 (2019).
- Rao et al. (2019) Z. Rao, H. Li, T. Zhang, S. Tian, C. Li, B. Fu, C. Tang, L. Wang, Z. Li, W. Fan, J. Li, Y. Huang, Z. Liu, Y. Long, C. Fang, H. Weng, Y. Shi, H. Lei, Y. Sun, T. Qian, and H. Ding, Nature 567, 496 (2019).
- Schröter et al. (2019) N. B. M. Schröter, D. Pei, M. G. Vergniory, Y. Sun, K. Manna, F. de Juan, J. A. Krieger, V. Süss, M. Schmidt, P. Dudin, B. Bradlyn, T. K. Kim, T. Schmitt, C. Cacho, C. Felser, V. N. Strocov, and Y. Y. Chen, Nat. Phys. 15, 759 (2019).
- Takane et al. (2019) D. Takane, Z. Wang, S. Souma, K. Nakayama, T. Nakamura, H. Oinuma, Y. Nakata, H. Iwasawa, C. Cacho, T. Kim, K. Horiba, H. Kumigashira, T. Takahashi, Y. Ando, and T. Sato, Phys. Rev. Lett. 122, 076402 (2019).
- de Juan et al. (2017) F. de Juan, A. G. Grushin, T. Morimoto, and J. E. Moore, Nat. Commun. 8, 15995 (2017).
- (118) D. Rees, K. Manna, B. Lu, T. Morimoto, H. Borrmann, C. Felser, J. E. Moore, D. H. Torchinsky, and J. Orenstein, arXiv:1902.03230 .
- Nakayama et al. (2016) M. Nakayama, T. Kondo, Z. Tian, J. J. Ishikawa, M. Halim, C. Bareille, W. Malaeb, K. Kuroda, T. Tomita, S. Ideta, K. Tanaka, M. Matsunami, S. Kimura, N. Inami, K. Ono, H. Kumigashira, L. Balents, S. Nakatsuji, and S. Shin, Phys. Rev. Lett. 117, 056403 (2016).
- Wang et al. (2017a) R. Wang, A. Go, and A. J. Millis, Phys. Rev. B 95, 045133 (2017a).
- Wang et al. (2017b) Y. Wang, H. Weng, L. Fu, and X. Dai, Phys. Rev. Lett. 119, 187203 (2017b).
- Santos-Cottin et al. (2018) D. Santos-Cottin, Y. Klein, P. Werner, T. Miyake, L. de’ Medici, A. Gauzzi, R. P. S. M. Lobo, and M. Casula, Phys. Rev. Materials 2, 105001 (2018).