Exciton localization in tubular molecular aggregates: size effects and optical response
Abstract
We study the exciton localization and resulting optical response for disordered tubular aggregates of optically active molecules. It has been shown previously that such tubular structures allow for excitons delocalized over more than a thousand molecules, owing to the combined effects of long-range dipole-dipole interactions and the higher-dimensional (not truly one-dimensional) nature of the aggregate. Such large delocalization sizes prompt the question to what extent in experimental systems the delocalization may still be determined by the aggregate size (diameter and length) and how this affects the aggregate’s optical response and dynamics. We perform a systematic study of the size effects on the localization properties, using numerical simulations of the exciton states in a cylindrical model structure inspired by the previously derived geometry of a cylindrical aggregate of cyanine dye molecules (C8S3). To characterize the exciton localization, we calculate the participation ratio and the autocorrelation function of the exciton wave function. Also, we calculate the density of states and absorption spectrum. We find strong effects of the tube’s radius on the localization and optical properties in the range of parameters relevant to experiment. In addition, surprisingly, we find that even for tubes as long as 750 nm, the localization size is limited by the tube’s length for disorder values that are relevant to experimental circumstances, while observable effects of the tube’s length in the absorption spectrum still occur for tube lengths up to about 150 nm. The latter may explain changes in the optical spectra observed during the aging process of bromine-substituted C8S3 aggregates. For weak disorder, the exciton wave functions exhibit a scattered, fractal-like nature, similar to the quasi-particles in two-dimensional disordered systems.
I Introduction
Self-assembled aggregates of molecules with strong optical transitions have been studied abundantly for more than 80 years now Jelley (1936, 1937); Scheibe (1937). The close packing of molecules within such aggregates gives rise to collective optically allowed excited states, Frenkel excitons, that are shared by a number of molecules and that give rise to interesting optical phenomena. Examples are exchange narrowing of spectral lineshapes Knapp (1984); Malyshev and Domınguez-Adame (1999), collective spontaneous emission De Boer and Wiersma (1990); Fidder, Knoester, and Wiersma (1990), a Pauli-exclusion gap measured in pump-probe spectroscopy Fidder, Knoester, and Wiersma (1993); Juzeliunas (1988), and enhanced nonlinear optical properties Spano and Mukamel (1989a); Knoester (1993). Typically, such aggregates also exhibit fast excitation energy transport, reflected, for instance, in very high exciton-exciton annihilation efficiencies Scheblykin et al. (2001). Synthetic dye aggregates consisting of many thousands of molecules, in particular those prepared from cyanine dye molecules, have played a crucial role in the development of color photography and xerography Tani (1995); Herz (1977); Mees (1942). On the other hand, natural aggregates consisting of optically active biomolecules also have received much attention lately, in particular in the context of light-harvesting antenna complexes in the photosynthetic systems of bacteria, algae, and higher plants Scholes et al. (2011); Orf and Blankenship (2013); Schulze et al. (2016); Jang and Mennucci (2018). Such aggregates, mainly consisting of (bacterio)chlorophyll molecules, usually stabilized in a protein scaffold, have the purpose of absorbing the energy of the sunlight, thereby converting it into an electronic excitation, which subsequently is transported with high efficiency (quantum efficiencies over 90%) to the photosynthetic reaction center to trigger the first step in the photochemical reaction. The extent to which delocalized and quantum coherent excitons play a role in natural antenna systems has been a topic of much interest during the past 20 years van Oijen et al. (1999); Jang, Dempster, and Silbey (2001); Reineker et al. (2003); Engel et al. (2007); Wu et al. (2012); Cleary and Cao (2013); Tempelaar, Jansen, and Knoester (2014); Scholes et al. (2017); Duan et al. (2017); Jang and Mennucci (2018); Thyrhaug et al. (2018); Gullì et al. (2019); Celardo et al. (2019).
The role of collective effects in the optical response and excited state dynamics of molecular aggregates depends on how many molecules share an excitation, a quantity known as the exciton delocalization size. In ideal, nicely ordered aggregates of identical molecules, in principle the excitations are shared by all molecules. In practice, however, disorder in the transition energies of individual molecules imposed by an inhomogeneous host medium and disorder in the excitation transfer interactions between molecules, resulting from structural fluctuations, limit the exciton delocalization to much smaller numbers. In the prototypical aggregates of the synthetic dye molecule pseudo-isocyanine (PIC), the delocalization size at low temperatures is in the order of 50-70 molecules Fidder, Knoester, and Wiersma (1991, 1993), which is large enough to see strong collective effects, but still considerably smaller than the many thousands of molecules that make up these aggregates. The strong localization effect results from the one-dimensional character of PIC aggregates.
During the past 15 years, a large number of tubular molecular aggregates have been studied, both synthetic Spitz et al. (2002); Spitz and Daehne (2006); Gandini et al. (2003); Vlaming et al. (2009); Pawlik et al. (1997); Didraga et al. (2004); Eisele et al. (2012); Clark, Cone, and Vanden Bout (2013); Sperling et al. (2010); Abramavicius et al. (2012); Yuen-Zhou et al. (2014); Lang et al. (2005); Sengupta et al. (2012); v. Berlepsch and Böttcher (2013); Sorokin et al. (2010); Womick, Miller, and Moran (2009a, b); Doria et al. (2018); Caram et al. (2016); Kriete et al. (2019), semi-synthetic Sengupta et al. (2012); Löhner et al. (2019) and natural Holzwarth and Schaffner (1994); Ganapathy et al. (2009); Tian et al. (2011); Günther et al. (2016) ones. These systems typically have diameters in the order of 10 nm and lengths of 100 nanometer up to microns. This renders them quasi-one-dimensional systems from a geometrical point of view, that might, for instance, serve as excitation energy transport wires. However, it has been shown that the extra dimension (the tube’s circumference) in combination with the long-range (dipolar) intermolecular excitation transfer interactions leads to much weaker exciton localization than in truly one-dimensional systems Bloemsma et al. (2015). This explains experiments on a variety of tubular aggregates, demonstrating strong dependence of the optical properties on the polarization direction of the absorbed or emitted light relative to the tube’s axis Spitz et al. (2002); Spitz and Daehne (2006); Didraga et al. (2004); Clark, Cone, and Vanden Bout (2013); Günther et al. (2016). In fact, the delocalization size in tubular aggregates of the dye C8S3 was estimated to be in the order of a thousand molecules, even in the optically dominant energy region near the exciton band edge, where localization properties are strongest Bloemsma et al. (2015).
The large exciton delocalization sizes in tubular aggregates are of direct relevance to their optical and excitation transport properties. For instance, it has been shown that the exciton diffusion constant in tubular model aggregates is a universal function of the ratio of the exciton localization length and the cylinder’s circumference Chuang et al. (2016). This becomes all the more interesting, because recently some degree of control of the radius of tubular aggregate of cyanine molecules has been reportedKriete et al. (2017). Moreover, given the large delocalization sizes obtained in numerical simulations, the question arises to what extent the system size still plays a role in their value, both in the calculation and in experiment. Thus far, a systematic study of size effects in the localization properties, and hence the optical properties, has not been performed.
In this work, we numerically investigate the dependence of the exciton localization properties and absorption spectrum on both the radius and the length of tubular molecular aggregates. We employ a Frenkel exciton model with Gaussian site disorder on an experimentally relevant tubular aggregate structure. The findings confirm that under experimental conditions, it is possible that the delocalization is not solely determined by the ratio of the strength of the disorder and the width of the exciton band, but also by the aggregate size. We also show that this does not imply that the excitons are spread over the entire system in the same way as the excitons in a homogeneous tubular aggregate are; rather the wave functions seem to be spread in a highly irregular way, resembling fractal behavior Schreiber and Grussbach (1991).
The outline of this paper is as follows. In Sec. II, we describe the details of the model used in our study and the approach; in particular, we define the various quantities studied in our analysis. Next, in Sec. III, we present our results, followed by a discussion. Finally, in Sec. IV, we conclude. In the appendix several details are presented that characterize the exciton band as a function of system size.
II Model and Approach
II.1 Structural model
Throughout this paper, we use as model system the extended herringbone model introduced in Ref. 39 to describe the inner wall of the frequently studied double-walled tubular molecular aggregates of the dye C8S3 (3,3′-bis(2-sulfopropyl)-5,5′,6,6′-tetrachloro-1,1′-dioctylbenzimidacarbocyanine). This model describes a single-walled tubular aggregate with two identical molecules per unit cell, which only differ from each other by their position in the unit cell and their orientation in the local frame of the tube. For the purpose of describing the optical properties, all molecules are considered two-level systems with an optical transition dipole between the ground state and the excited state that is fixed to the molecular frame. The model may be considered as a perpendicular stack of equidistant rings, separated by a distance , where on each ring the positions of equidistant unit cells are located. Neighboring rings are rotated relative to each other over a helical angle .
The above described packing is realized by wrapping a planar two-dimensional lattice with two molecules per unit cell (which are tilted out of the plane) on a cylindrical surface. This wrapping is fully dictated by the length and direction of the vector over which the lattice is rolled; the length of the rolling vector gives the circumference of the cylinder (and hence dictates the radius of the tube). The parameter only depends on the orientation of the rolling vector and the lattice constants, while both and also depend on its length. Throughout this work, the orientation of the rolling vector was kept fixed and equal to the one used for the inner wall in Ref. 39 to fit the experimental spectrum of C8S3 tubes, leading to a fixed value of nm. In order to allow us to investigate the dependence of the tube’s localization and optical properties on its radius, the length of the rolling vector was varied. This means that only a discrete set of radii can be considered, because after wrapping the two-dimensional lattice on the cylinder, the molecule where the rolling vector starts should coincide with the one where it ends (seamless wrapping). For further details of creating the structural model, in particular the lattice parameters, the tilt angles, and the orientation of the rolling vector, we refer to Refs. 39 and 60.
The variation of radii considered in our calculations is such that takes all integer values in the range . Within the model considered here, the inner tube of the C8S3 aggregates has , while the inner wall of the wider bromine-substituted C8S3 (3,3′-bis(2-sulfopropyl)-5,5′,6,6′-tetrabromo-1,1′-dioctylbenzimidacarbocyanine) aggregates has , both values that fall inside the range studied here. When investigating the radius dependence, the length was kept fixed at , which agrees with a physical length of 196.9 nm. When studying the length dependence, the radius was kept fixed at 3.5505 nm, which agrees with a ring of unit cells, the value that applies to the inner wall of unsubstituted C8S3. We then considered 11 different values for the length lying between and , i.e., a physical length between 50 nm and nm, which is an experimentally relevant range. The total number of molecules in the aggregate thus ranges from 1332 to 46,620 for the smallest and largest radii, respectively.
II.2 Model Hamiltonian
The collective optical (charge neutral) excited states of the aggregate are described by the Frenkel exciton Hamiltonian,
| (1) |
where and run over all molecules, and denotes the state where molecule is excited and all other molecules are in their ground state. Throughout this paper, we use open boundary conditions at the top and bottom rings of the cylinder (i.e., the cylinder is not folded into a torus).
The first term in Eq. (1) describes the molecular excited state energy (), where gives the mean value, which is taken to be 18,868 cm-1 Eisele et al. (2012), and the offset describes the energy disorder that gives rise to localization. We will model the disorder by randomly choosing the from a Gaussian distribution with mean zero and standard deviation ; the disorder offsets on different molecules are assumed to be uncorrelated from each other. The second term in Eq. (1) describes the intermolecular excitation transfer interactions, which are described by extended dipole-dipole interactions between all molecules, using and nm, respectively, for the point charges and length of the vector connecting them Eisele et al. (2012). No disorder in the interactions is considered in this paper, i.e., we do not take into account structural disorder. The interactions promote the delocalization of the excitation over the aggregate. For the structure considered here, the interactions are strong, owing to the fact that the C8S3 molecules have a large transition dipole (11.4 Debye) Eisele et al. (2012) and have small separations between each other. Based on this, the strongest four interactions have an absolute value between 1000 cm-1 and 1500 cm-1, while the next three largest interactions all are in the order of cm-1.
In order to study the localization and optical properties of the aggregate, we first numerically diagonalize the Hamitonian for a particular disorder realization, which provides us with the eigenstate and its energy , where and denote the eigenvectors (normalized to unity) and eigenvalues, respectively, of the matrix . From these quantities all properties we are interested in follow. Specifically, the exciton density of states (DOS) is given by
| (2) |
where the angular brackets denote an average over disorder realizations. Similarly, the absorption spectrum is given by
| (3) |
where denotes the electric polarization vector of the light used to take the spectrum and is the transition dipole between the aggregate’s ground state (all molecules in their ground state) and the exciton state , with denoting the transition dipole vector of molecule .
II.3 Wavefunction characterization
To characterize the exciton localization properties, we study two quantities. The first one is the inverse participation ratio, defined as Thouless (1974); Schreiber and Toyozawa (1982a)
| (4) |
The inverse participation ratio equals 1 for states localized on one molecule only, while for states that are equally shared by all molecules of the aggregate, its value equals , where is the total number of molecules. Alternatively, the reciprocal of the inverse participation ratio, also known as the participation ratio, , is generally accepted as a quantity that characterizes how many molecules take part in (share) the collective excitations at energy . Depending on the disorder strength and the exciton energy, this value may be anywhere between unity (totally localized state) and (totally delocalized state), where is a constant in the order of unity, which depends on whether open or closed boundary conditions are used. In general, the localization properties depend on energy , as is made explicit in the above notation.
The second quantity that we will use to investigate the extended nature of the exciton states is the autocorrelation function of the exciton wave functionDidraga and Knoester (2004), derived from
| (5) |
where a two-dimensional vector notation has been introduced to indicate the position of the unit cell and and can both take on the values 1 and 2 in order to label the different molecules within the unit cell. Thus, , with labeling the ring on which the unit cell resides and indicating its position in the ring. Because the aggregate has open boundary conditions in the direction, the number of terms in the summation over is limited by the value of . This would possibly result in an artificial fast drop of the correlation function with growing ; in order to account for this, the correction factor has been added. A similar correction is not needed for the summation, as in the ring direction periodic boundary conditions are inherently included in the system, always allowing for terms in the summation over .
defined above is a matrix, whose elements show an overall similar decay behavior for localized states. In order to just present one quantity, we have chosen to focus on one specific correlation function defined through the trace of the matrix:
| (6) |
which has the nice property that its value at the origin is normalized to unity at all energies: . From the autocorrelation function, we may extract another localization measure as a function of energy as the number of molecules for which Didraga and Knoester (2004). We also will be particularly interested in the autocorrelation function along the tube’s axis and define the correlation length as the number of rings for which . is a measure of the number of rings over which the exciton wave functions are delocalized.
In the results presented in the next section, the number of disorder realizations used to evaluate the disorder average was taken to be 150.
III Results and Discussion
III.1 Absorption spectra
We start from studying how optical properties depend on the tube’s size (length and radius) and on the disorder. A typical absorption spectrum of the tubular aggregate studied here is shown in Fig. 1(a) for a structure with length and radius . The stick spectrum of the homogeneous structure features four J bands: two bands polarized parallel to the tube’s axes (red lines) and two bands polarized perpendicular to it (blue lines). These bands originate from the selection rules dictated by the cylindrical symmetry of the structure Didraga, Klugkist, and Knoester (2002).
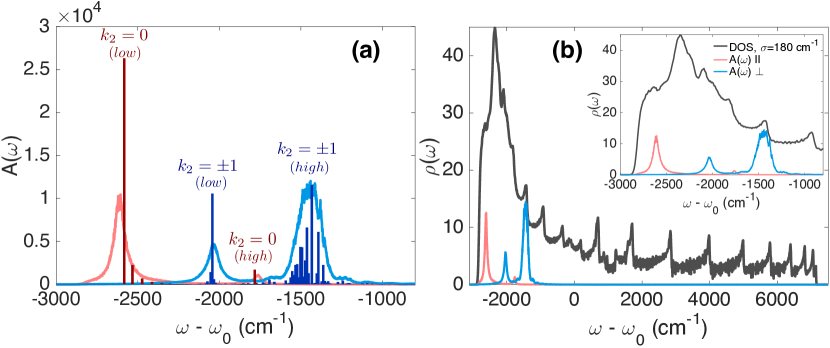
The eigenstates of the homogeneous tubular aggregate have Bloch character in the ring direction characterized by a transverse quantum number Didraga, Klugkist, and Knoester (2002). The optically allowed states occur in the bands of states with (polarized parallel to the tube’s axis) and those with (degenerate and polarized perpendicular to the axis). Moreover, the lattice with two molecules per unit cell used in this study gives rise to a Davydov splitting, resulting in the four optical bands observed in Fig. 1(a). Our main interest is the low-energy Davydov component of the band, as this optical band lies close to the bottom of the exciton band (see Fig. 1(b)) and, therefore, has a linewidth that is primarily determined by static disorder.
Disorder gives rise to broadening and an energy shift of the optical bands compared to the homogeneous stick spectrum. This is shown in Fig. 1(a) where light red and light blue lines show the spectrum in both polarization directions for tubes with (weak) disorder strength given by cm-1. The disorder strength of 180 cm-1 is used, as in the model considered here this explains the broadening of the lowest-energy J band for bromine-substituted C8S3 aggregates observed in experiment Kriete et al. (2017). The broadening and energy shift are a result of the breaking of the selection rules by the disorder and the resulting mixing of states with different values.The density of states for this system is shown in Fig. 1(b) together with the absorption spectrum. The exciton band exhibits a marked asymmetry around its center as a result of the inclusion of long-range interactions Fidder, Knoester, and Wiersma (1991). The lowest-energy optical band lies slightly above the lower exciton band edge. The energy dependence of the density of states reflects sharp peaks due to the one-dimensional sub-bands for different values, which persist for the weak disorder value of cm-1.
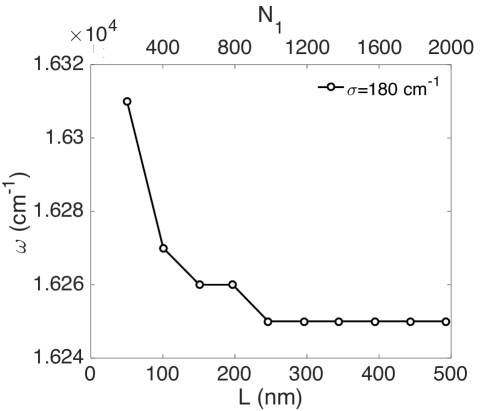
Length dependence. We first examine the effect of the tube’s length on the absorption spectrum. Fig. 2 displays the calculated position of the lowest-energy optical band as a function of the tube’s length in the presence of disorder. This figure suggests that observable changes in the position of this band occur for tubes with lengths up to 150 nm (). Specifically, a red shift of 50 cm-1 arises between the tubes with and , corresponding to an increase of the length from 50 nm to 150 nm. For , the calculated energy position of the optical bands essentially does not change. Our theoretical calculations are in qualitative agreement with the experimentally observed red shift of the parallel polarized band during the aging process of bromine-substituted C8S3 aggregate solutions: using cryo-TEM imaging, the tube’s length was seen to grow while aging. Kri .
Next, we examine the overall line shape of the absorption spectra of large tubes in the presence of disorder. Figs. 3(a) and 3(b) present the absorption spectra of two tubes with the same radius () but different lengths, decomposed in parallel (red) and perpendicular (blue) bands. The two tubes have a length of (L1) and (L2) and are shown in darker and lighter colors, respectively. Absorption spectra of the tubes with weak ( cm-1, Fig. 3(a)) and strong ( cm-1, Fig. 3(b)) disorder are shown together with the stick spectra in the absence of disorder. As can be seen, both for weak and strong disorder the width and energy position of parallel and perpendicular bands do not change anymore with increasing length in this region. This is somewhat surprising in the light of the fact observed later on (Sec. III.2) that at least for cm-1, the exciton delocalization size still grows with the tube’s length in this region. This implies that exchange narrowing of the absorption bands—the effect that the absorption band width is inversely proportional to the square root of the delocalization size, common for one-dimensional aggregates with uncorrelated Gaussian disorder Knapp (1984); Fidder, Knoester, and Wiersma (1991)—does not occur here. This may be related to the special character of the exciton states discussed later on (Sec. III.4) and the very high density of states in the optically relevant region of the spectrum, where bands with different values are easily mixed by disorder.
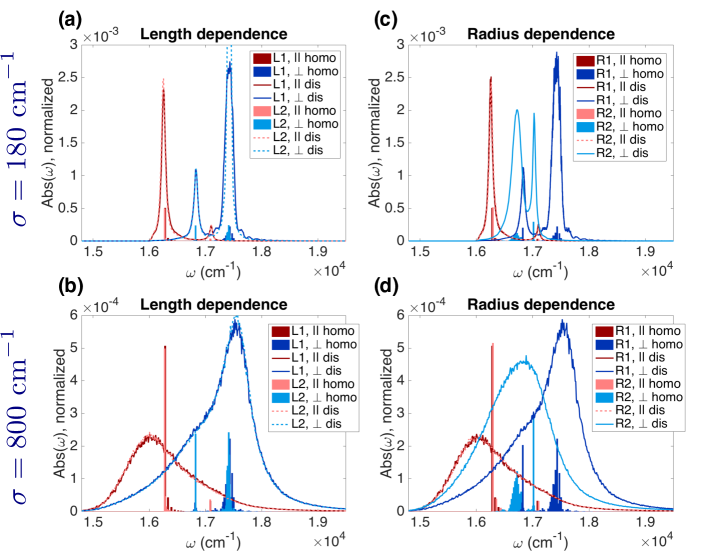
Radius dependence. Next, we study the effect of the tube’s radius on the absorption spectrum. Figs. 3(c) and 3(d) present the parallel (red) and perpendicular (blue) polarized contributions of the absorption spectra of tubes of the same length () and different radii; darker and lighter colors correspond to tubes with (R1) and (R2), respectively. Increasing the tube’s radius gives rise to considerable changes in the absorption spectra, which primarily originates from the radius dependence of the energy position of the perpendicular polarized optical bands Didraga, Klugkist, and Knoester (2002). The width and position of the lowest-energy optical band is hardly sensitive to the radius. This is true for both values of the disorder, cm-1 (Fig. 3(c)) and cm-1 (Fig. 3(d)). The dependence of the energy position of the perpendicular polarized band on the tube’s radius is the main cause of the changes in the absorption spectrum experimentally observed when replacing four chlorine atoms by bromine atoms in C8S3 molecules, which leads to larger radii of the self-assembled nanotubes. Kriete et al. (2017).
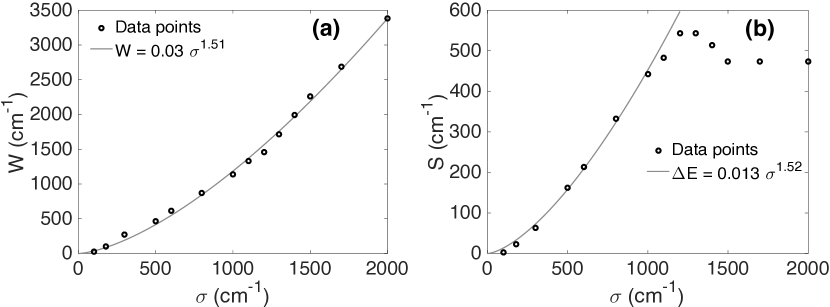
Disorder scaling of absorption band width and position. Next, we examine the disorder dependence of the optical band width, , and red shift, , of the lowest-energy J band. To this end, we first fit the absorption spectrum to a sum of Gaussian line shapes in order to isolate this J band. Then, we take the full width at half maximum of the corresponding Gaussian as . For , we use the difference between the mean value of the corresponding Gaussian and the energy position of the lowest-energy peak in the stick spectrum. The obtained results for and are presented in Figs. 4(a) and 4(b), respectively, as a function of the disorder strength. Both dependencies may be fitted well by a power law (curves in Fig. 4), as is common for a variety of molecular aggregates Schreiber and Toyozawa (1982b); Boukahil and Huber (1990); Köhler, Jayannavar, and Reineker (1989); Fidder, Knoester, and Wiersma (1991); Malyshev and Moreno (1995); Bloemsma et al. (2015). For the width, the best fit according to yields (Fig. 4(a)). The obtained exponent is higher than the value of 1.34 obtained for one-dimensional J aggregates Fidder, Knoester, and Wiersma (1991); Köhler, Jayannavar, and Reineker (1989); Schreiber and Toyozawa (1982b); Boukahil and Huber (1990). However, it is considerably smaller than the value of 2.83 obtained from a previous study on tubular aggregates Bloemsma et al. (2015). The strong difference with Ref. 58 can be explained from differences in the exciton density of states at the position of the lowest-energy J band, which in turn can be traced back to differences in the lattice structure. In the case of Ref. 58, a tube with one molecule per unit cell was considered with a lattice structure which near the lower band-edge gives rise to a low density of states, scaling with the square-root of energy; in our case, the density of states is rather high already at the position of the lowest-energy band and does not seem to depend strongly on energy (Fig. 1(b)). The result is a scaling of with disorder that is much closer to the one-dimensional case.
The results for the scaling of the energy shift with disorder (Fig. 4(b)) show similar behavior as the absorption band width. The value of 1.52 for the exponent in the corresponding power law fit is somewhat larger than the value of 1.35 found for the one-dimensional system Fidder, Knoester, and Wiersma (1991). The increase of the red shift reaches a maximum at cm-1, and then starts to decrease again. This may be explained from the fact that for disorder values larger than the exciton bandwidth, the interactions are relatively unimportant and the spectrum should tend to a very broad peak, centered at the monomer transition frequency.
III.2 Degree of localization: participation number
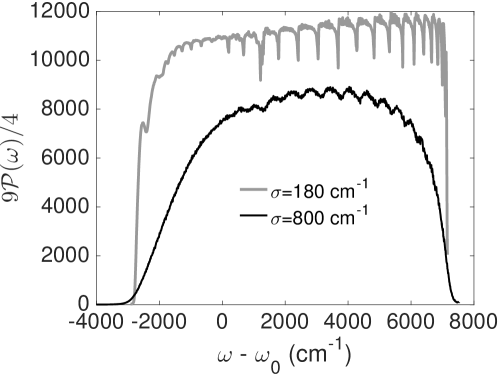
In this section, we establish the behavior of the degree of localization of the eigenstates obtained from the participation number calculated using Eq. (4). The energy dependence of this quantity multiplied by is shown in Fig. 5 for cm-1 and cm-1, where the factor was introduced to ensure that in the homogeneous limit ( cm-1), this number tends to the system size Didraga and Knoester (2004) (the factor of 2 stems from the fact that we deal with tubes with 2 molecules per unit cell). Clearly, with growing disorder, for each energy the states become more localized; furthermore, the localization is stronger near the band edges than at the band center, as is common for disordered systems Anderson (1958); Fidder, Knoester, and Wiersma (1991). Inside the exciton band, most clearly for cm-1, the participation number exhibits a structure with dips occurring at discrete energy positions. This is similar to the dip found in one-dimensional disordered systems Fidder, Knoester, and Wiersma (1991) and reflects the persistence of the quasi-one dimensional exciton sub-bands characterized by the quantum number for weak disorder. For cm-1, the value of the participation number (scaled by the factor ) inside the exciton band indeed reflects the participation of almost all 14,652 molecules in the exciton wave functions, i.e., practically complete delocalization.
Next, we investigate the dependence of the participation number on the tube’s size (length and radius). We are mainly interested in the eigenstates in the optically relevant region of the low-energy absorption band, where localization effects are strong. To this end, we calculate the average participation number of the exciton states in the region of cm-1 around the peak position of the lowest-energy J band of the homogeneous aggregate, cm-1 (the exact numbers for each system are given in the Appendix, Table 1 and 2) denoted as .
Fig. 6 (top panels) shows as a function of the tube’s length and radius for the homogeneous system (green) and for two values of the disorder: cm-1 (blue) and cm-1 (red). For the length dependence, the radius of the tubes is fixed at and the length increases from to . In the case of the radius dependence, the length is fixed at and the radius increases from to . In the homogeneous limit, the participation number (corrected by the factor ) correctly is seen to grow linearly with the system size and to be basically equal to this size (in this case ), reflecting complete delocalization. Disorder suppresses the exciton delocalization and, therefore, decreases the participation number. For cm-1, the participation number still increases with system size over the entire region of the length and radius considered, meaning that the delocalization size, even for the largest sizes considered, still is limited by the system size and not by the disorder. This clearly reflects the weak character of the exciton localization due to the higher-dimensional character of the tubes. The radius dependence persists longer than the length dependence, which for starts to saturate around a length of 1500 rings. This also is seen for the stronger value of the disorder, cm-1, where the length dependence is quite weak for , implying that the delocalization of the exciton states along the tube’s axis is not limited by its length for this disorder strength, while the delocalization size grows for growing radius over the entire domain studied.
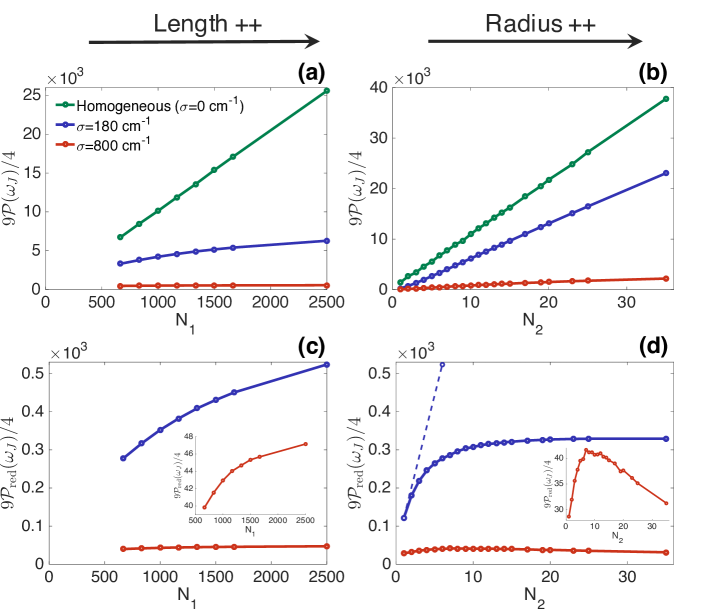
The strong radius dependence of the delocalization sizes prompted us to introduce the reduced participation number, defined by the participation number divided by the number of molecules per ring: . For states that are completely delocalized around the circumference of the tube, is expected to be constant as a function of . This number may then be interpreted as the number of rings along the tube over which the exciton states are delocalized. The reduced participation number as a function of length and radius is shown in the bottom panels of Fig. 6, again for cm-1 and 800 cm-1. We first discuss the data for cm-1. It is clearly seen that for small values, up to about , is not a constant, but grows strongly with . This means that not only are the states fully delocalized around the rings, but that, moreover, the number of rings over which the states are delocalized grows with increasing radius. This supralinear dependence of the total participation number on the radius finds its origin in intra-ring exchange narrowing of the disorder: states that are completely delocalized around each ring, have states whose energy distribution imposed by the disorder does not have a width given by , but rather by . In a perturbative picture, for each value this leads to an effective one-dimensional chain (of rings) with effective energy disorder strength , i.e., an effective disorder strength that diminishes with growing radius. This explains that the exciton delocalization along the tube’s axis can grow with increasing radius. Using the disorder scaling of the delocalization size in linear chains found in Ref. 32, the number of rings that participate in the wave functions is expected to scale as . The actual scaling deduced from the first 4 data points for for cm-1 are best fit to a scaling relation . Given the difficulty to deduce a good power-law fit from just 4 data points and the fact that the perturbative arguments used here are bound to break down quite easily for the high density of states in the system considered, the differences of the two exponents is not unreasonable. Beyond , for cm-1 starts to saturate towards a constant: the number of rings that participate in the exciton wave functions hardly grows anymore. Closer inspection shows that this saturation is governed by the tube’s length, i.e., the delocalization size for is strongly limited by the tube’s length. This is made explicit by the additional data point in the lower-right panel of Fig. 6, which indicates for and .
For the stronger disorder value considered ( cm-1), intra-ring exchange narrowing also seems to occur for small radii, but much less pronounced than for the case of weak disorder (see inset in lower-right panel of Fig. 6 for details). Moreover, following the saturation around , starts to diminish with growing radius, implying that the states are no longer fully delocalized around the tube’s circumference. The delocalization for this disorder strength is not limited by the chain length of rings, not even for the largest radii.
III.3 Extent of the wave function from its autocorrelation function
As mentioned in Sec. II, an alternative measure of the degree of delocalization is the auto-correlation function of the exciton wave function, which has the advantage that for higher-dimensional systems is also gives directional information. In this section, we use the auto-correlation function defined in Eq. (6) and we will be particularly interested in its dependence along the direction of the tube’s axis, i.e., in as a function of the relative separation between two rings. As before, we will be particularly interested in the energy region around the lowest-energy J band.
Fig. 7 shows the typical autocorrelation function for a homogeneous tube with and (Fig. 7(a)), and the same tube in the presence of strong disorder cm-1 (Fig. 7(b)). As can be seen from the 3D correlation plot, the exciton wave function of the homogeneous system (Fig. 7(a)) is extended over the whole aggregate, with a steep drop of the correlation function at the edges of the tube due to the open boundary conditions. In the direction, such drop does not occur, because of the circular nature of this coordinate. For the disordered system (Fig. 7(b)), the autocorrelation function at shows a peak with maximum value 1 at the origin, , and a drop in both (longitudinal) and (circumferential) directions. It can be seen, though, that a high correlation along is preserved, which supports the idea that the states at still are quite strongly delocalized along the rings for this circumference, even for cm-1. As we are particularly interested in the direction of the tube’s axis, we study the decay of the correlation function , highlighted by the red line in Fig. 7(b). Initially, the correlation function follows a power-law decay, which only is important for a few rings close to the origin, while at larger distances the decay is exponential. This is in agreement with a previous numerical study of 1D, 2D, and 3D disordered electronic systems Schreiber (1985), where it was concluded that a power-law decay of the wave functions mediates between extended states and strongly localized states with exponential decay.
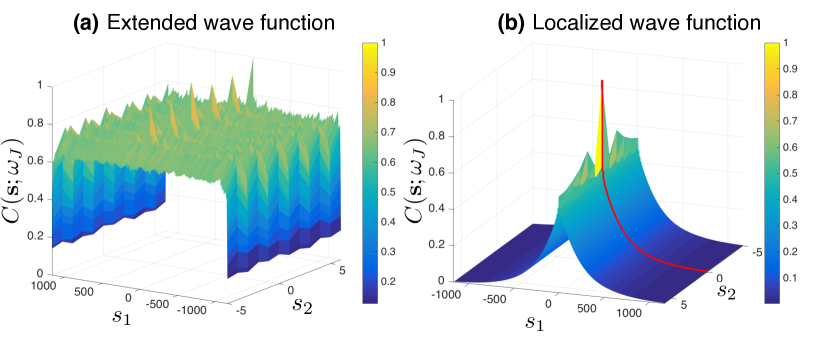
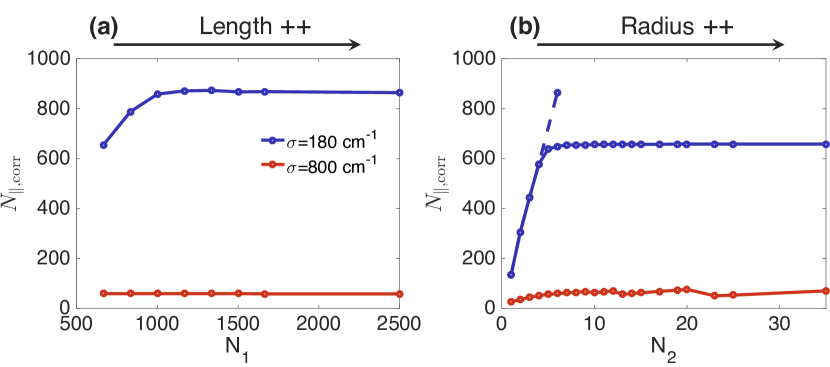
Fig. 8 shows the correlation length in the longitudinal direction (defined above in Eq. (6)) as a function of the tube’s length and radius. In Fig. 8(a) it is seen that for weak disorder ( cm-1), grows with the tube’s length up to a length of about , after which it reaches a plateau with . This means that for tubes with and shorter than about 1000 rings, the physical size is the limiting factor for the correlation length. This matches the saturation of the increase of the participation number seen in Fig. 6(a) around . As can be seen in Fig. 7(a), for cm-1 the disorder is the limiting factor for , which again matches the behavior seen in Fig. 6(a).
As is seen in Fig. 8(b), for weak disorder, grows linearly with the radius for small values of , while a plateau is observed for values of . This plateau results from a physical limitation, namely the length of the tubes considered in case we study the radius dependence. This is confirmed by also calculating the correlation length for =1000 and =6 (additional data point in Fig. 8(b) connection by a dashed line). The linear dependence of the correlation length on appears to persist till . This behavior is in agreement with the fact that the reduced participation ratio in Fig. 6(d) initially grows with the radius, albeit that there the increase was not found to be linear. Again, the increase of the correlation length with the increase of the tube’s radius results from the intra-ring exchange narrowing effect. For cm-1, the radius dependence of the correlation length closely matches that of the reduced participation number found in Fig. 6d.
III.4 Character of the exciton wave function
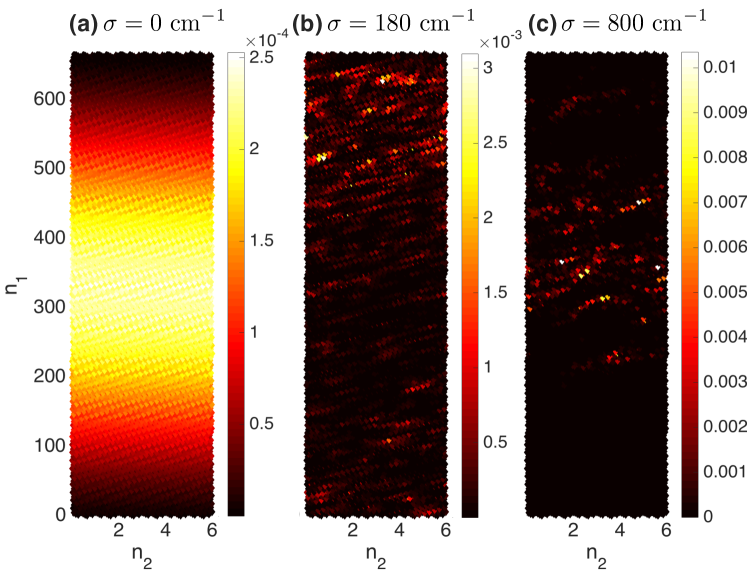
The participation number and autocorrelation function give statistical information on characteristics of the exciton wave functions. It is also interesting, though, to consider examples of typical wave functions for a specific realization of the disorder. To this end, we show in Fig. 9 the probability density on the unwrapped surface of the cylinder for typical exciton states near the lowest-energy J band for tubes with and with cm-1, 180 cm-1, and 800 cm-1. For a homogeneous tube (Fig. 9a), the exciton state has equal amplitude on all unit cells within the same ring, while along the tube’s axis the probability density resembles the lowest exciton state in a linear J-aggregate, having a maximum at the center of the tube’s axis and decaying towards the edges. The alternating pattern, observed most clearly in the homogeneous case, is due to the presence of two molecules in each unit cell. The chirality observed follows the direction of the strongest interaction between neighboring rings. For weak disorder (Fig. 9b), the probability density is extended over the whole tube, however, in a quite scattered way, similar to the fractal character of quasi-particle states reported in disordered two-dimensional systems Schreiber and Grussbach (1991); Aoki (1983). For stronger disorder (Fig. 9c), the probability density of the wave function is more concentrated (localized) on a specific part of the cylinder (here the center). The specific, fractal-like nature of the exciton wave functions at weak disorder strengths may be responsible for the large values of both the correlation lengths and the reduced participation numbers found for cm-1 described in Sec. III.2 and III.3.
IV Conclusions
In this paper, we systematically examined the dependence of the exciton localization and optical properties on both the radius and the length of tubular molecular aggregates. As a specific model, we used the structure previously reported to model the inner wall of C8S3 aggregates, described by an extended herringbone model with two molecules per unit cell. We numerically calculated the absorption spectra in the presence of Gaussian diagonal disorder for tubes of various lengths (up to 740 nm) and radii (up to 20.7 nm). We found that the effect of the tube’s length, observed as a red-shift of the lowest-energy band with increasing length, is still visible for tubes as long as 150 nm. The effect of the radius is much more pronounced, due to the strong dependence of the higher-energy bands polarized perpendicular to the tube’s axis on its radius.
We used two quantities to study the localization behavior as a function of the length and radius: the (reduced) participation number that gives a measure for the typical number of molecules participating in the exciton states at a particular energy, and the autocorrelation function of the exciton wave function that gives statistical information on the extent and the directionality of the exciton wave functions. The obtained results suggest that the physical size rather than the disorder is the limiting factor for the delocalization of the exciton states of C8S3 cyanine aggregates, at least for aggregates shorter than about 1 micron. It should be noted that the length dependence of the localization size does not seem to affect the absorption spectrum, except for lengths smaller than 150 nm. In general, we found that for the disorder value relevant to C8S3 aggregates ( cm-1), the exciton wave functions in the optically important region of the lowest-energy J band are fully delocalized around the circumference of the tubes, which is consistent with the strong polarization properties found in the experimental absorption spectrum of these aggregates Didraga et al. (2004). Moreover, this circumferential delocalization persists up to large radii, even larger than those considered in our calculations. This, inter alia, gives rise to the interesting effect of intra-ring exchange narrowing of disorder, which ultimately results in the growth of the delocalization length along the axis direction of the aggregate with growing radius. The excitonic states in the middle of the exciton band are hardly affected by static disorder, even for strong disorder values of more than 1000 cm-1. Conversely, states at the lower edge of the exciton band (close to the lowest-energy J band) as well as the upper edge, show stronger localization effects than those in the optically dominant region, but they still are very delocalized.
The properties of the exciton states found here are of interest in their own right, in the realm of localization problems, and for the optical absorption of the system, namely to identify the character of the states that are responsible for the absorption process. They may also have a bearing on dynamic processes, such as exciton transport, which was shown to occur with a higher diffusion constant for larger delocalization lengths Chuang et al. (2016). In that case, however, a more in-depth study is needed to also assess the importance of dynamic disorder, giving rise to dephasing, which over time may destroy coherences between different molecules, in particular distant ones. In addition, we note that in this work, we have restricted ourselves to near-field dipolar interactions. For the longest aggregates considered here, the inclusion of the radiative corrections to these interactions may affect our results Spano and Mukamel (1989b); Gullì et al. (2019); Celardo et al. (2019), which would be interesting to explore further in a future systematic study.
Appendix: Additional information about modeled structures
Length distribution. For the length dependence studies, the radius of the tubes was kept fixed, while the length was varied from 50 nm up to 740 nm (see Table 1). The radius was chosen to be equal to 3.5505 nm, which corresponds to =6 unit cells in the ring, as is the case for the inner wall of C8S3 aggregates Eisele et al. (2012).
| , nm | Bandwidth, cm-1 | (), cm-1 | ||
|---|---|---|---|---|
| 170 | 50.3 | 2040 | 16,113.2 - 25,991.8 | 16,339 |
| 340 | 100.5 | 4080 | 16,111.8 - 25,995.0 | 16,299 |
| 510 | 150.8 | 6120 | 16,111.5 - 25,995.6 | 16,288 |
| 666 | 196.9 | 7992 | 16,111.4 - 25,995.8 | 16,283 |
| 833 | 246.2 | 9996 | 16,111.4 - 25,995.9 | 16,281 |
| 1000 | 295.6 | 12,000 | 16,111.3 - 25,995.9 | 16,279 |
| 1166 | 344.7 | 13,992 | 16,111.3 - 25,996.0 | 16,278 |
| 1333 | 394.0 | 15,996 | 16,111.3 - 25,996.0 | 16,277 |
| 1500 | 443.4 | 18,000 | 16,111.3 - 25,996.0 | 16,277 |
| 1666 | 492.5 | 19,992 | 16,111.3 - 25,996.0 | 16,276 |
| 2500 | 739.0 | 30,000 | 16,111.3 - 25,996.0 | 16,275 |
Radius distribution. For the modeling of the radius dependence, the same lattice of the inner wall of C8S3 was used, where the radius was defined by the number of unit cells on the rolling vector (in order to preserve the rolling angle, only specific radii can be taken, namely when the end point of the rolling vector coincides with a lattice point). The radii considered are given in Table 2. The length of the tubes was then kept fixed at 196.9 nm.
As mentioned in the main text, the radius of the tube with corresponds to the inner wall of C8S3 aggregate, while the one with agrees with the inner wall of bromine-substituted C8S3 aggregate (without adjusting the other structural parameters) Eisele et al. (2012); Kriete et al. (2017).
| , nm | Bandwidth, cm-1 | (), cm-1 | ||
|---|---|---|---|---|
| 1 | 0.5918 | 1332 | 15,950.2 - 24,885.7 | 16,355 |
| 2 | 1.1835 | 2664 | 16,080.7 - 25,900.1 | 16,273 |
| 3 | 1.7753 | 3996 | 16,103.4 - 25,878.2 | 16,276 |
| 4 | 2.3670 | 5328 | 16,109.1 - 25,980.4 | 16,279 |
| 5 | 2.9588 | 6660 | 16,110.6 - 25,961.4 | 16,281 |
| 6 | 3.5505 | 7992 | 16,111.4 - 25,995.8 | 16,283 |
| 7 | 4.1423 | 9324 | 16,112.0 - 25,984.3 | 16,284 |
| 8 | 4.7340 | 10,656 | 16,112.4 - 26,001.2 | 16,286 |
| 9 | 5.3258 | 11,988 | 16,112.8 - 25,993.8 | 16,287 |
| 10 | 5.9175 | 13,320 | 16,113.0 - 26,003.7 | 16,287 |
| 11 | 6.5093 | 14,652 | 16,113.3 - 25,998.6 | 16,288 |
| 12 | 7.1011 | 15,984 | 16,113.4 - 26,005.1 | 16,289 |
| 13 | 7.6928 | 17,316 | 16,113.6 - 26,001.3 | 16,290 |
| 14 | 8.2846 | 18,648 | 16,113.7 - 26,005.9 | 16,290 |
| 15 | 8.8763 | 19,980 | 16,113.8 - 26,003.0 | 16,291 |
| 17 | 10.06 | 22,644 | 16,114.0 - 26,004.2 | 16,292 |
| 19 | 11.243 | 25,308 | 16,114.1 - 26,005.0 | 16,293 |
| 20 | 11.835 | 26,640 | 16,114.2 - 26,007.1 | 16,293 |
| 23 | 13.61 | 30,636 | 16,114.3 - 26,006.0 | 16,294 |
| 25 | 14.794 | 33,300 | 16,114.3 - 26,006.4 | 16,295 |
| 35 | 20.711 | 46,620 | 16,114.4 - 26,007.3 | 16,297 |
Acknowledgements.
We gratefully acknowledge discussions with M. S. Pshenichnikov and B. Kriete.References
- Jelley (1936) E. E. Jelley, Nature 138, 1009 (1936).
- Jelley (1937) E. E. Jelley, Nature 139, 631 (1937).
- Scheibe (1937) G. Scheibe, Angew. Chem. 50, 212 (1937).
- Knapp (1984) E. W. Knapp, Chem. Phys. 85, 73 (1984).
- Malyshev and Domınguez-Adame (1999) V. A. Malyshev and F. Domınguez-Adame, Chem. Phys. Lett. 313, 255 (1999).
- De Boer and Wiersma (1990) S. De Boer and D. A. Wiersma, Chem. Phys. Lett. 165, 45 (1990).
- Fidder, Knoester, and Wiersma (1990) H. Fidder, J. Knoester, and D. A. Wiersma, Chem. Phys. Lett. 171, 529 (1990).
- Fidder, Knoester, and Wiersma (1993) H. Fidder, J. Knoester, and D. A. Wiersma, J. Chem. Phys. 98, 6564 (1993).
- Juzeliunas (1988) G. Juzeliunas, Z. Phys. D Atoms, Molecules and Clusters 8, 379 (1988).
- Spano and Mukamel (1989a) F. C. Spano and S. Mukamel, Phy. Rev. A 40, 5783 (1989a).
- Knoester (1993) J. Knoester, Chem. Phys. Lett. 203, 371 (1993).
- Scheblykin et al. (2001) I. Scheblykin, O. Y. Sliusarenko, L. Lepnev, A. Vitukhnovsky, and M. Van der Auweraer, J. Phys. Chem. B 105, 4636 (2001).
- Tani (1995) T. Tani, Photographic sensitivity: theory and mechanisms, 8 (Oxford University Press on Demand, 1995).
- Herz (1977) A. Herz, Advances in Colloid and Interface Science 8, 237 (1977).
- Mees (1942) C. E. K. Mees, The theory of the photographic process (Macmillan Co., New York, 1942).
- Scholes et al. (2011) G. D. Scholes, G. R. Fleming, A. Olaya-Castro, and R. van Grondelle, Nat. Chem. 3, 763 (2011).
- Orf and Blankenship (2013) G. S. Orf and R. E. Blankenship, Photosynth. Res. 116, 315 (2013).
- Schulze et al. (2016) M. Schulze, V. Kunz, P. D. Frischmann, and F. Würthner, Nat. Chem. 8, 576 (2016).
- Jang and Mennucci (2018) S. J. Jang and B. Mennucci, Rev. Mod. Phys. 90, 035003 (2018).
- van Oijen et al. (1999) A. M. van Oijen, M. Ketelaars, J. Köhler, T. J. Aartsma, and J. Schmidt, Science 285, 400 (1999).
- Jang, Dempster, and Silbey (2001) S. Jang, S. E. Dempster, and R. J. Silbey, J. Phys. Chem. B 105, 6655 (2001).
- Reineker et al. (2003) P. Reineker, C. Warns, C. Supritz, and I. Barvík, J. Lumin. 102, 802 (2003).
- Engel et al. (2007) G. S. Engel, T. R. Calhoun, E. L. Read, T.-K. Ahn, T. Mančal, Y.-C. Cheng, R. E. Blankenship, and G. R. Fleming, Nature 446, 782 (2007).
- Wu et al. (2012) J. Wu, F. Liu, J. Ma, R. J. Silbey, and J. Cao, J. Chem. Phys. 137, 174111 (2012).
- Cleary and Cao (2013) L. Cleary and J. Cao, New J. Phys. 15, 125030 (2013).
- Tempelaar, Jansen, and Knoester (2014) R. Tempelaar, T. L. Jansen, and J. Knoester, J. Phys. Chem. B 118, 12865 (2014).
- Scholes et al. (2017) G. D. Scholes, G. R. Fleming, L. X. Chen, A. Aspuru-Guzik, A. Buchleitner, D. F. Coker, G. S. Engel, R. Van Grondelle, A. Ishizaki, D. M. Jonas, et al., Nature 543, 647 (2017).
- Duan et al. (2017) H.-G. Duan, V. I. Prokhorenko, R. J. Cogdell, K. Ashraf, A. L. Stevens, M. Thorwart, and R. D. Miller, Proc. Natl. Acad. Sci. 114, 8493 (2017).
- Thyrhaug et al. (2018) E. Thyrhaug, R. Tempelaar, M. J. Alcocer, K. Žídek, D. Bína, J. Knoester, T. L. Jansen, and D. Zigmantas, Nat. Chem. 10, 780 (2018).
- Gullì et al. (2019) M. Gullì, A. Valzelli, F. Mattiotti, M. Angeli, F. Borgonovi, and G. L. Celardo, New Journal of Physics 21, 013019 (2019).
- Celardo et al. (2019) G. Celardo, M. Angeli, T. Craddock, and P. Kurian, New Journal of Physics 21, 023005 (2019).
- Fidder, Knoester, and Wiersma (1991) H. Fidder, J. Knoester, and D. A. Wiersma, J. Chem. Phys. 95, 7880 (1991).
- Spitz et al. (2002) C. Spitz, J. Knoester, A. Ouart, and S. Daehne, Chem. Phys. 275, 271 (2002).
- Spitz and Daehne (2006) C. Spitz and S. Daehne, Int. J. Photoenergy 2006 (2006).
- Gandini et al. (2003) S. Gandini, E. Gelamo, R. Itri, and M. Tabak, Biophys. J. 85, 1259 (2003).
- Vlaming et al. (2009) S. Vlaming, R. Augulis, M. Stuart, J. Knoester, and P. Van Loosdrecht, J. Phys. Chem. B 113, 2273 (2009).
- Pawlik et al. (1997) A. Pawlik, S. Kirstein, U. De Rossi, and S. Daehne, J. Phys. Chem. B 101, 5646 (1997).
- Didraga et al. (2004) C. Didraga, A. Pugzlys, P. R. Hania, H. von Berlepsch, K. Duppen, and J. Knoester, J. Phys. Chem. B 108, 14976 (2004).
- Eisele et al. (2012) D. M. Eisele, C. W. Cone, E. A. Bloemsma, S. M. Vlaming, C. G. F. van der Kwaak, R. J. Silbey, M. G. Bawendi, J. Knoester, J. P. Rabe, and D. A. Vanden Bout, Nat. Chem. 4, 655 (2012).
- Clark, Cone, and Vanden Bout (2013) K. A. Clark, C. W. Cone, and D. A. Vanden Bout, J. Phys. Chem. C 117, 26473 (2013).
- Sperling et al. (2010) J. Sperling, A. Nemeth, J. Hauer, D. Abramavicius, S. Mukamel, H. F. Kauffmann, and F. Milota, J. Phys. Chem. A 114, 8179 (2010).
- Abramavicius et al. (2012) D. Abramavicius, A. Nemeth, F. Milota, J. Sperling, S. Mukamel, and H. F. Kauffmann, Phys. Rev. Lett. 108, 067401 (2012).
- Yuen-Zhou et al. (2014) J. Yuen-Zhou, D. H. Arias, D. M. Eisele, C. P. Steiner, J. J. Krich, M. G. Bawendi, K. A. Nelson, and A. Aspuru-Guzik, ACS nano 8, 5527 (2014).
- Lang et al. (2005) E. Lang, A. Sorokin, M. Drechsler, Y. V. Malyukin, and J. Köhler, Nano Lett. 5, 2635 (2005).
- Sengupta et al. (2012) S. Sengupta, D. Ebeling, S. Patwardhan, X. Zhang, H. von Berlepsch, C. Böttcher, V. Stepanenko, S. Uemura, C. Hentschel, H. Fuchs, F. C. Grozema, L. D. A. Siebbeles, A. R. Holzwarth, L. Chi, and F. Würthner, Angew. Chem. Int. Ed. 51, 6378 (2012).
- v. Berlepsch and Böttcher (2013) H. v. Berlepsch and C. Böttcher, Langmuir 29, 4948 (2013).
- Sorokin et al. (2010) A. V. Sorokin, I. I. Filimonova, R. S. Grynyov, G. Y. Guralchuk, S. L. Yefimova, and Y. V. Malyukin, J. Phys. Chem. C 114, 1299 (2010).
- Womick, Miller, and Moran (2009a) J. M. Womick, S. A. Miller, and A. M. Moran, J. Phys. Chem. A 113, 6587 (2009a).
- Womick, Miller, and Moran (2009b) J. M. Womick, S. A. Miller, and A. M. Moran, J. Phys. Chem. B 113, 6630 (2009b).
- Doria et al. (2018) S. Doria, T. S. Sinclair, N. D. Klein, D. I. Bennett, C. Chuang, F. S. Freyria, C. P. Steiner, P. Foggi, K. A. Nelson, J. Cao, A. Aspuru-Guzik, S. Lloyd, J. R. Caram, and M. G. Bawendi, ACS nano 12, 4556 (2018).
- Caram et al. (2016) J. R. Caram, S. Doria, D. M. Eisele, F. S. Freyria, T. S. Sinclair, P. Rebentrost, S. Lloyd, and M. G. Bawendi, Nano Lett. 16, 6808 (2016).
- Kriete et al. (2019) B. Kriete, J. Lüttig, T. Kunsel, P. Malỳ, T. L. Jansen, J. Knoester, T. Brixner, and M. S. Pshenichnikov, Nat. Commun. 10, 1 (2019).
- Löhner et al. (2019) A. Löhner, T. Kunsel, M. Röhr, T. Jansen, S. Sengupta, F. Würthner, J. Knoester, and J. Köhler, J. Phys. Chem. Lett. 10, 2715 (2019).
- Holzwarth and Schaffner (1994) A. R. Holzwarth and K. Schaffner, Photosynth. Res. 41, 225 (1994).
- Ganapathy et al. (2009) S. Ganapathy, G. T. Oostergetel, P. K. Wawrzyniak, M. Reus, A. G. M. Chew, F. Buda, E. J. Boekema, D. A. Bryant, A. R. Holzwarth, and H. J. de Groot, Proc. Natl. Acad. Sci. U.S.A. 106, 8525 (2009).
- Tian et al. (2011) Y. Tian, R. Camacho, D. Thomsson, M. Reus, A. R. Holzwarth, and I. G. Scheblykin, J. Am. Chem. Soc 133, 17192 (2011).
- Günther et al. (2016) L. M. Günther, M. Jendrny, E. A. Bloemsma, M. Tank, G. T. Oostergetel, D. A. Bryant, J. Knoester, and J. Köhler, J. Phys. Chem. B 120, 5367 (2016).
- Bloemsma et al. (2015) E. A. Bloemsma, S. M. Vlaming, V. A. Malyshev, and J. Knoester, Phys. Rev. Lett. 114, 156804 (2015).
- Chuang et al. (2016) C. Chuang, C. K. Lee, J. M. Moix, J. Knoester, and J. Cao, Phys. Rev. Lett. 116, 196803 (2016).
- Kriete et al. (2017) B. Kriete, A. S. Bondarenko, V. R. Jumde, L. E. Franken, A. J. Minnaard, T. L. C. Jansen, J. Knoester, and M. S. Pshenichnikov, J. Phys. Chem. Lett. 8, 2895 (2017).
- Schreiber and Grussbach (1991) M. Schreiber and H. Grussbach, Phys. Rev. Lett 67, 607 (1991).
- Thouless (1974) D. J. Thouless, Phys. Rep. 13, 93 (1974).
- Schreiber and Toyozawa (1982a) M. Schreiber and Y. Toyozawa, J. Phys. Soc. Jpn. 5, 1537 (1982a).
- Didraga and Knoester (2004) C. Didraga and J. Knoester, J. Chem. Phys. 121, 10687 (2004).
- Didraga, Klugkist, and Knoester (2002) C. Didraga, J. A. Klugkist, and J. Knoester, J. Phys. Chem. B 106, 11474 (2002).
- (66) B. Kriete and M.S. Pshenichnikov, private communication.
- Schreiber and Toyozawa (1982b) M. Schreiber and Y. Toyozawa, J. Phys. Soc. Jpn. 51, 1528 (1982b).
- Boukahil and Huber (1990) A. Boukahil and D. Huber, J. Lumin. 45, 13 (1990).
- Köhler, Jayannavar, and Reineker (1989) J. Köhler, A. Jayannavar, and P. Reineker, Z. Physik B - Conden. Matter 75, 451 (1989).
- Malyshev and Moreno (1995) V. Malyshev and P. Moreno, Phy. Rev. B 51, 14587 (1995).
- Anderson (1958) P. W. Anderson, Phys. Rev. 109, 1492 (1958).
- Schreiber (1985) M. Schreiber, J. Phys. C: Solid State Phys. 18, 2493 (1985).
- Aoki (1983) H. Aoki, J. Phys. C: Solid State Phys. 16, L205 (1983).
- Spano and Mukamel (1989b) F. C. Spano and S. Mukamel, J. Chem. Phys. 91, 683 (1989b).