Td to 1T′ structural phase transition in WTe2 Weyl semimetal
Abstract
Elastic neutron scattering on a single crystal combined with powder X-ray diffraction measurements were carried out to investigate how the crystal structure evolves as a function of temperature in the Weyl semimetal WTe2. A sharp transition from the low-temperature orthorhombic phase (Td) to the high-temperature monoclinic phase (1T′) was observed at ambient pressure in the single crystal near 565 K. Unlike in MoTe2, the solid-solid transition from Td to 1T′ occurs without the cell doubling of the intermediate T phase with AABB (or ABBA) layer stacking. In powders however, the thermal transition from the Td to the 1T′ phase was broadened and a two phase coexistence was observed until 700K, well above the structural transition.
I Introduction
Transition metal dichalcogenides (TMDs) have attracted considerable attention recently because of their intriguing electronic band structure properties that render them hosts to exotic quasiparticles. MoTe2 and WTe2 are reported to be type-II Weyl semimetals in the orthorhombic Td phase Deng et al. (2016); Wu et al. (2016) due to spatial inversion symmetry breaking, and both show a large non-saturating magnetoresistance Yang et al. (2017); Ali et al. (2014); Cai et al. (2015). They are layered structures, held together by van der Waals forces, and can undergo multiple solid-solid transitions through the sliding of layers Clarke et al. (1978); Brown (1966). Upon quenching from high temperatures, the monoclinic phase, 1T′, was first shown to be stabilized in MoTe2, from which the low-temperature orthorhombic phase (Td) emerges. The high-temperature monoclinic phase Clarke et al. (1978) and the low-temperature orthorhombic phase differ in their layer stacking. In WTe2, on the other hand, only the Td phase has been reported at ambient pressure, and the 1T′ phase has been theoretically predicted to be absent up to at least 500 KKim et al. (2017). Application of external pressure, however, leads to a Td to 1T′ phase transition that commences around 6.0 GPa Zhou et al. (2016).
The 1T′ crystal structure is shown in Fig. 1(a), projected in the - plane. Layer stacking follows two possible ordering schemes, with stacking types labeled “A” and “B” (Fig. 1(b)) Schneeloch et al. (2019); Tao et al. (2019). The Td phase is constructed by stacking either AAAA… or BBBB… sequences, while the 1T′ is built by stacking ABAB… or BABA… layers. We recently reported that an intermediate pseudo-orthorhombic T phase appears across the transition boundary between Td and 1T′, with an AABB… (or ABBA…) layer stacking in MoTe2. The T phase is only observed upon warming, while on cooling, diffuse scattering is seen, most likely arising from a frustrated tendency towards the T stacking order. Tao et al. (2019); Dissanayake et al. (2019). Regardless of A- or B-type stacking, all pairs of neighboring layers are positioned relative to each other in essentially the same way, which can be captured by an in-plane displacement parameter Schneeloch et al. (2020), as shown in Fig. 1(a). We define as the distance along the -axis between the midpoints of metal-metal bonds of neighboring layers; this definition is uniquely defined for both 1T′ (where it is related to the angle) and Td.
With W substitution as in Mo1-xWxTe2, the 1T′ to Td structural transition temperature increases up until Yan et al. (2017). However, it is not known at present whether this transition occurs at ambient pressure at the other end of the phase diagram with as in WTe2. A pressure-driven Td–1T′ structural transition has been reported to appear at 4 - 5 GPa Lu et al. (2016), at 8 GPa Xia et al. (2017), and in a broad range from 6.0 to 18.2 GPa, during which a volume collapse with dramatic changes in the lattice constants was observed Zhou et al. (2016). In MoTe2, pressure suppresses the temperature of the 1T′-Td transition, and extinguishes it by 1.2 GPa Qi et al. (2016); Heikes et al. (2018); Dissanayake et al. (2019), though dramatic changes in the lattice constants between the phases have not been reported. Nonetheless, the presence of a transition in WTe2 under pressure, as well as the trend of increasing Td–1T′ transition temperature with W-substitution in the Mo1-xWxTe2 Oliver et al. (2017); Yan et al. (2017); Lv et al. (2017); Rhodes et al. (2017) phase diagram suggest the possibility of an ambient-pressure transition at high temperatures.
Using elastic neutron scattering, we observed the Td–1T′ structural phase transition at ambient pressure in a single crystal of WTe2. The transition is sharp, occurs at 565 K, and proceeds without hysteresis. No intermediate phase is present across the phase boundary in WTe2, in contrast to the T phase seen in MoTe2. From powder X-ray diffraction (XRD) however, the transition appears broad and incomplete up to 700 K, with phase coexistence across a wide temperature range.
II Experimental Details
The WTe2 single crystals were grown out of a Te flux. First, WTe2 powder was prepared from stoichiometric ratios of W and Te powders. The sintering was done in an evacuated quartz silica ampoule at 900 ∘C for 2 days. The sintered powder was then pressed into a pellet and sealed with excess Te in a molar ratio of 1:13. The ampoule was placed horizontally in a tube furnace and heated at a constant temperature of 850 ∘C for 7 days. Excess Te was removed by re-inserting one end of the ampoule into a tube furnace at 900 ∘C and decanting the molten Te towards the cold end. For XRD, powder was sintered as described above.
Resistivity measurements under magnetic fields of 0 and 9 T are shown in Fig. 1(c). The residual resistivity ratio (RRR) from the 0 T data is calculated to be 118(3). Our WTe2 crystals also have a large magnetoresistance, with a magnitude of 51,553% at 2 K under a 9 T magnetic field. These values are reasonably high Lv et al. (2016), though higher values have been reported in the literature, such as an RRR of 370 and a magnetoresistance of 452,700% at 4.5 K in an applied field of 14.7 T Ali et al. (2014).
Elastic neutron scattering was performed on the triple axis spectrometer HB1A, located at the High Flux Isotope Reactor at Oak Ridge National Laboratory (ORNL). The elastic measurements used an incident neutron energy of 14.6 meV and the collimation was 40′-40′-S-40′-80′. The crystal was mounted to an aluminum plate via aluminum wire, and a furnace was used to control the temperature. Powder XRD measurements were collected as a function of temperature between 300 K and 700 K. Rietveld refinement was done using the GSAS-II software Toby and Dreele (2013). In this paper, we use atomic coordinates based on an orthorhombic unit cell (unless otherwise noted) with (i.e., 6.28 Å, Å, and 14.07 Å).
III Results and Discussion
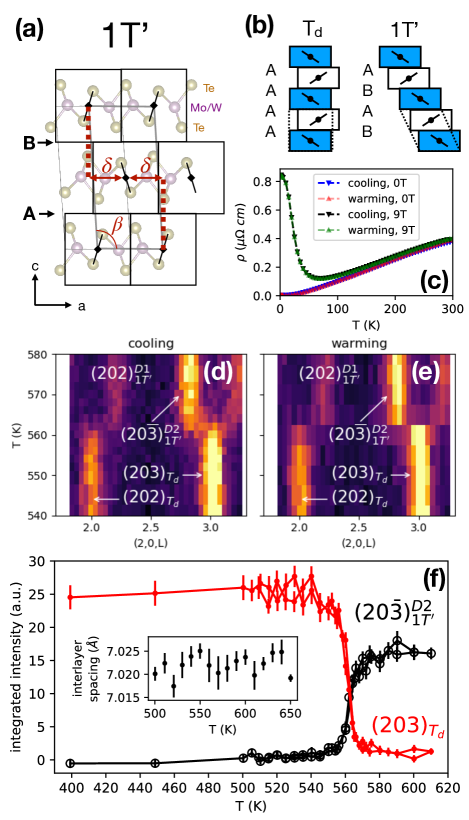
Shown in Figs. 1(d,e) are intensity maps which combine elastic neutron scattering scans along the at a sequence of temperatures on warming from 510 to 610 K, then cooling. A clear Td–1T′ transition can be seen from changes in the Bragg peaks, which occur without the diffuse scattering seen in MoTe2 Tao et al. (2019). At low temperatures, the and Bragg peaks are observed. On warming, a structural phase transition into the 1T′ phase is observed at 565 K, followed by 1T′ phase peaks appearing near and . The calculated volume fractions of the 1T′ twins are around 48% and 52%. Unlike the appearance of the T phase in MoTe2, there is no intermediate phase present in the transition in WTe2.
In Fig. 1(f), the intensities of the and peaks, obtained from fits to scans along , are plotted as a function of temperature on warming and cooling through the hysteresis loop. The transition in WTe2 is quite sharp (mostly complete within 10 K) with very little hysteresis, as seen from the overlap of the warming and cooling curves. In contrast, MoTe2 has a broader transition of tens of Kelvins, with a lingering hysteresis in the resistivity that can persist hundreds of Kelvins away from the transition region Tao et al. (2019); even the TdTTd loop in MoTe2, which proceeds much more sharply than the transition between Td and 1T′, still has a hysteresis of 5 K Tao et al. (2019). Although structural phase transitions are often accompanied by anomalies in the lattice constants, no change in the interlayer spacing was observed in the inset of Fig. 1(f), in contrast to the abrupt changes seen under pressure for the lattice constants Zhou et al. (2016). The -axis did not change dramatically either, given the similar intensities of scans which were performed across the transition without re-alignment.
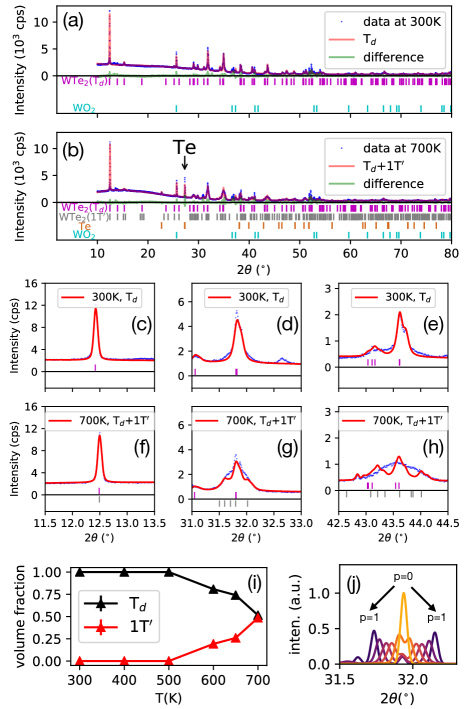
In contrast to the clean transition seen in the single crystal, we observe a broad Td–1T′ transition in powder WTe2 on warming to 700 K. XRD patterns at 300 and 700 K are shown in Figs. 2(a,b). At 300 K, peaks from the Td phase can be seen, as well as an impurity WO2 phase having weight percent 5.1(1)%. At 700 K, the pattern can be better fit by a combination of Td and 1T′, as depicted in Figs. 2(c-h). The WO2 impurity phase was still present at 700 K. Peaks belonging to Te arose, first observable around 600 K, and reaching a weight percent of 8.13(17)% by 700 K. These Te peaks suggest the decomposition of WTe2, though refinement suggested no Te vacancies; a refinement of 700 K data with the occupancies of all Te atoms in Td- and 1T′-WTe2 fixed to a single value yielded a composition of WTe2.016(18). Though decomposition implies that elemental W should be present, no W peaks were seen.
When fitting both Td and 1T′ to the 700 K data, we first allowed the lattice constants of both phases to vary, then kept the 1T′ lattice constants fixed to be consistent with those found in the Td refinement; the monoclinic tilting angle was fixed to a value corresponding to the parameter derived from the refined Td phase atomic coordinates. With these assumptions, the Td phase can be seen (in Fig. 2(d,e) and Fig. 2(g,h)) to have its peaks split into those of 1T′, though the resulting intensity is broader than expected for a simple combination of peak intensities from the two phases. If the broadening were due to a spread of lattice constants induced by decomposition, we might expect the peaks to also be broadened, whereas these peak intensities should not change for changes in stacking (even for disordered stackings) since the peak intensities only depend on atomic positions along the out-of-plane axis. We indeed see a lack of broadening of the peak in Figures 2(c) and 2(f), suggesting that the change in peak intensity is consistent with changes in stacking. The relative volume fractions for the 1T′ and Td contributions are shown in Fig. 2(i). The transition in the WTe2 powder is much broader than in the single crystal, beginning between 500 and 600 K, and steadily increasing up to at least 700 K.
Disordered stacking likely accounts for the extra intensity between the Td and 1T′ Bragg peaks. To illustrate, we show simulated XRD patterns from disordered stacking sequences progressing from Td to 1T′ in Fig. 2(j). While a variety of disordered stackings are conceivable, we used a simple model which was used to analyze diffuse scattering in MoTe2 Schneeloch et al. (2019). We start from the Td structure with AAAA… stacking, then randomly swap “A” with “B”-type stacking with probability for every other interlayer boundary; thus, corresponds to Td, and corresponds to 1T′ with ABAB… stacking. The diffuse scattering can then be obtained from the structure factor of the Bragg peaks from a very large supercell. Fig. 2(j) shows simulated patterns for selected for a 1000-layer supercell. Increasing results in a steady shift of intensity toward the locations of the 1T′ peaks. Though the intensity is peaked, even for intermediate , a broader intensity distribution could result from inhomogeneity in the values of , or from a more complex model of stacking disorder.
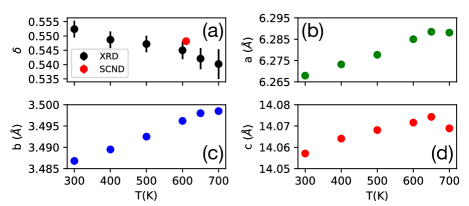
An essential parameter characterizing the Mo1-xWxTe2 structure is the parameter, which characterizes in-plane positioning of neighboring layers. From the refined coordinates of the Td phase XRD data, we obtained as a function of temperature (Fig. 3(a).) The parameter decreases by 0.007 from 300 to 600 K, which is very similar to the decrease in Mo0.91W0.09Te2 (0.006 from 320 to 600 K.) For the 1T′ phase in the single crystal, we can obtain from the separation between opposite-twin 1T′ peaks, yielding 0.5482(3) at 610 K (and a monoclinic angle of .) This latter value is probably more reliable than those from powder refinement, which may be more insidiously affected by systematic errors due to the indirect nature of obtaining positions from Bragg peak intensities. Nevertheless, a rough agreement for is found between values found from the Td-phase powder refinement and from the 1T′ peak splitting in the single crystal, as seen in Fig. 3(a). The refined Td-phase lattice parameters are shown in Fig. 3(b-d). Aside from a possible anomaly near 700 K, which may be related to the decomposition that results in the Te phase, or to the difficulty in getting uniquely fitted lattice constants in the presence of stacking disorder, we see the expected thermal expansion for , , and .
Our finding of a Td–1T′ structural phase transition in WTe2 suggests that theories of the transition be revisited. Although the relative stability of 1T′ over Td in MoTe2 at higher temperature has been supported by density functional theory calculations Kim et al. (2017); Heikes et al. (2018), WTe2 is predicted not to have a transition up to 500 K, and likely much higher Kim et al. (2017). In MoTe2, the preference for 1T′ at high temperature is attributed to the phonon entropy contribution (with a lack of soft mode behavior noted) Heikes et al. (2018), and more accurate calculations may suggest a similar reason for the existence of 1T′ in WTe2. However, there are two theoretical obstacles. First, there is the inherent difficulty in reliably calculating the very small differences in free energy between phases like 1T′ and Td. Second, beyond the relative stability of 1T′ and Td, to our knowledge no theoretical attempts have been made to explain the details of the transition, including the existence/absence of a hysteresis, presence of T on warming, stacking disorder in other parts of the transition, gradual disappearance of stacking disorder on warming/cooling away from the transition, etc. Tao et al. (2019). Interestingly, the calculations in Ref. Kim et al. (2017) show a lack of an energy barrier in WTe2 between 1T′ and Td, in contrast to MoTe2, which may be related to the lack of hysteresis in WTe2 but not in MoTe2. However, other factors, such as increased thermal energy facilitating layer movement, may play a role as well.
The structural trends shown in our data place constraints on theoretical models for the transition. We observed no detectable change in the interlayer spacing across the transition, similar to the negligible change seen in other Mo1-xWxTe2 crystals Schneeloch et al. (2020). (Kinks in interlayer spacing vs. temperature have been seen in some Mo1-xWxTe2 crystals, but may be due to slight misalignment accompanying the transition Schneeloch et al. (2020).) This finding highlights the similarities between the phases, expected since they have nearly identical layers that are positioned relative to neighboring layers in nearly symmetry-equivalent ways. Such similarities may make sufficiently accurate calculations difficult, with subtle effects such as spin-orbit coupling contributing non-negligibly to the layer spacing Kim et al. (2017). Another structural factor to be considered is the dependence of the parameter on composition and temperature, though these trends are less constraining. Theory already appears to be consistent with the decrease in with W-substitution, with calculated values of for WTe2 vs. for MoTe2 (as extracted from calculated 1T′ lattice constants), and experimental values of 0.552 for our powder Td-WTe2 data vs. reported for 1T′-MoTe2 Heikes et al. (2018) (both at 300 K.) The similarity in the temperature-dependence of WTe2 and Mo0.91W0.09Te2 Schneeloch et al. (2020) suggests that these compositions have a similar anharmonicity in the interlayer potential, despite the difference in .
There are several possible explanations for the broadness of the transition in WTe2 powder as compared to single crystals. First, Te vacancies may be responsible, as they have been proposed to broaden the transition in MoTe2-z crystals Cho et al. (2017). We would expect that powder would have more decomposition than a single crystal due to a greater surface area to volume ratio. However, XRD refinement of the WTe2 powder showed no evidence of Te vacancies. The inaccuracy in the Te occupancy is likely due to difficulties in fitting Bragg peaks when the disordered stacking is present. A second possibility is that the transition is broadened in the small crystallites of a powder sample. In thin MoTe2 crystals (hundreds of nm or less) the transition is known to be broadened or suppressed completely He et al. (2018); Zhong et al. (2018); Cao et al. (2018). Third, there are likely more defects in powder, induced during sintering or grinding. Defects may frustrate layer sliding, and the presence of grain boundaries and interparticle strain would frustrate the shape change accompanying each grain’s orthorhombic-to-monoclinic transition. A better understanding of non-ideal behavior, such as that of powder, may help in realizing the potential of stacking changes to influence properties in quasi-two-dimensional materials.
IV Conclusion
Using elastic neutron scattering on a single crystal and XRD on a powder sample of WTe2, we observed a Td–1T′ structural phase transition in the Weyl semimetal WTe2 at ambient pressure. In the crystal, the transition occurs at 565 K without hysteresis, but in the powder, the transition is broadened and incomplete up to 700 K. Our results place constraints on theories of the structural behavior of Mo1-xWxTe2, which thus far have not predicted a transition in WTe2.
Note added. During the review of this paper, a study reporting a structural phase transition in WTe2 at 613 K at ambient pressure was published Dahal et al. (2020).
Acknowledgements
This work has been supported by the Department of Energy, Grant number DE-FG02-01ER45927. A portion of this research used resources at the High Flux Isotope Reactor, which is DOE Office of Science User Facilities operated by Oak Ridge National Laboratory.
References
- Deng et al. (2016) K. Deng, G. Wan, P. Deng, K. Zhang, S. Ding, E. Wang, M. Yan, H. Huang, H. Zhang, Z. Xu, J. Denlinger, A. Fedorov, H. Yang, W. Duan, H. Yao, Y. Wu, S. Fan, H. Zhang, X. Chen, and S. Zhou, “Experimental observation of topological Fermi arcs in type-II Weyl semimetal MoTe2,” Nat. Phys. 12, 1105–1110 (2016).
- Wu et al. (2016) Y. Wu, D. Mou, N. H. Jo, K. Sun, L. Huang, S. L. Budko, P. C. Canfield, and A. Kaminski, “Observation of Fermi arcs in the type-II Weyl semimetal candidate WTe2,” Phys. Rev. B 94, 121113 (2016).
- Yang et al. (2017) J. Yang, J. Colen, J. Liu, M. C. Nguyen, G. W. Chern, and D. Louca, “Elastic and electronic tuning of magnetoresistance in MoTe2,” Sci. Adv. 3, eaao4949 (2017).
- Ali et al. (2014) M. N. Ali, J. Xiong, S. Flynn, J. Tao, Q. D. Gibson, L. M. Schoop, T. Liang, N. Haldolaarachchige, M. Hirschberger, N. P .Ong, and R. J. Cava, “Large, non-saturating magnetoresistance in WTe2,” Nature 514, 205–208 (2014).
- Cai et al. (2015) P. L. Cai, J. Hu, L. P. He, J. Pan, X. C. Hong, Z. Zhang, J. Zhang, J. Wei, Z. Q. Mao, and S. Y. Li, “Drastic Pressure Effect on the Extremely Large Magnetoresistance in WTe2: Quantum Oscillation Study,” Phys. Rev. Lett. 115, 057202 (2015).
- Clarke et al. (1978) R. Clarke, E. Marseglia, and H. P. Hughes, “A low-temperature structural phase transition in -MoTe2,” PHILOS MAG Part B 38, 121–126 (1978).
- Brown (1966) B. E. Brown, “The crystal structures of WTe2 and high-temperature MoTe2,” Acta Crystallogr 20, 268–274 (1966).
- Kim et al. (2017) H. J. Kim, S. H. Kang, I. Hamada, and Y. W. Son, “Origins of the structural phase transitions in MoTe2 and WTe2,” Phys. Rev. B 95, 180101 (2017).
- Zhou et al. (2016) Y. Zhou, X. Chen, N. Li, R. Zhang, X. Wang, C. An, Y. Zhou, X. Pan, F. Song, B. Wang, W. Yang, Z. Yang, and Y. Zhang, “Pressure-induced Td to 1T′ structural phase transition in WTe2,” AIP Adv. 6, 075008 (2016).
- Schneeloch et al. (2019) J. A. Schneeloch, C. Duan, J. Yang, J. Liu, X. Wang, and D. Louca, “Emergence of topologically protected states in the MoTe2 Weyl semimetal with layer-stacking order,” Phys. Rev. B 99, 161105 (2019).
- Tao et al. (2019) Y. Tao, J. A. Schneeloch, C. Duan, M. Matsuda, S. E. Dissanayake, A. A. Aczel, J. A. Fernandez-Baca, F. Ye, and D. Louca, “Appearance of a T phase across the Td-1T′ phase boundary in the Weyl semimetal MoTe2,” Phys. Rev. B 100, 100101 (2019).
- Dissanayake et al. (2019) S. Dissanayake, C. Duan, J. Yang, J. Liu, M. Matsuda, C. Yue, J. A. Schneeloch, J. C. Y. Teo, and D. Louca, “Electronic band tuning under pressure in MoTe2 topological semimetal,” npj Quantum Mater. 4, 1–7 (2019).
- Schneeloch et al. (2020) John A. Schneeloch, Yu Tao, Chunruo Duan, Masaaki Matsuda, Adam A. Aczel, Jaime A. Fernandez-Baca, Guangyong Xu, Jörg C. Neuefeind, Junjie Yang, and Despina Louca, “Evolution of the structural transition in Mo1-xWxTe2,” arXiv:2003.08531 [cond-mat] (2020), arXiv: 2003.08531.
- Yan et al. (2017) X. J. Yan, Y. Y. Lv, L. Li, X. Li, S. H. Yao, Y. B. Chen, X. P. Liu, H. Lu, M. H. Lu, and Y. F. Chen, “Composition dependent phase transition and its induced hysteretic effect in the thermal conductivity of WxMo1-xTe2,” Appl. Phys. Lett. 110, 211904 (2017).
- Lu et al. (2016) P. Lu, J. S. Kim, J. Yang, H. Gao, J. Wu, D. Shao, B. Li, D. Zhou, J. Sun, D. Akinwande, D. Xing, and J. F. Lin, “Origin of superconductivity in the Weyl semimetal WTe2 under pressure,” Phys. Rev. B 94, 224512 (2016).
- Xia et al. (2017) J. Xia, D. F. Li, J. D. Zhou, P. Yu, J. H. Lin, J. L. Kuo, H. B. Li, Z. Liu, J. X. Yan, and Z. X. Shen, “Pressure-Induced Phase Transition in Weyl Semimetallic WTe2,” Small 13, 1701887 (2017).
- Qi et al. (2016) Y. Qi, G. Naumov, M. N. Ali, C. R. Rajamathi, W. Schnelle, O. Barkalov, M. Hanfland, S. C. Wu, C. Shekhar, Y. Sun, V. Süss, M. Schmidt, U Schwarz, E. Pippel, P. Werner, R. Hillebrand, T. Förster, E. Kampert, S. Parkin, R. J. Cava, C. Felser, B. Yan, and S. A. Medvedev, “Superconductivity in Weyl semimetal candidate MoTe2,” Nat. Commun. 7 (2016), 10.1038/ncomms11038.
- Heikes et al. (2018) C. Heikes, I. L. Liu, T. Metz, C. Eckberg, P. Neves, Y. Wu, L. Hung, P. Piccoli, H. Cao, J. Leao, J. Paglione, T. Yildirim, N. P. Butch, and W. Ratcliff, “Mechanical control of crystal symmetry and superconductivity in Weyl semimetal MoTe2,” Phys. Rev. Mater. 2, 074202 (2018).
- Oliver et al. (2017) S. M. Oliver, R. Beams, S. Krylyuk, I. Kalish, A. K. Singh, A. Bruma, T. Francesca, J. Joshi, I. R. Stone, S. J. Stranick, A. V. Davydov, and P. M. Vora, “The structural phases and vibrational properties of Mo1-xWxTe2 alloys,” 2D Mater. 4, 045008 (2017).
- Lv et al. (2017) Y. Y. Lv, L. Cao, X. Li, B. B. Zhang, K. Wang, B. Pang, L. Ma, D. Lin, S. H. Yao, J. Zhou, Y. B. Chen, S. T. Dong, W. Liu, M. H. Lu, Y. Chen, and Y. F. Chen, “Composition and temperature-dependent phase transition in miscible Mo1-xWxte2 single crystals,” Sci. Rep. 7, srep44587 (2017).
- Rhodes et al. (2017) D. Rhodes, D. A. Chenet, B. E. Janicek, C. Nyby, Y. Lin, W. Jin, D. Edelberg, E. Mannebach, N. Finney, A. Antony, T. Schiros, T. Klarr, A. Mazzoni, M. Chin, Y. C. Chiu, W. Zheng, Q. R. Zhang, F. Ernst, J. I. Dadap, X. Tong, J. Ma, R. Lou, S. Wang, T. Qian, H. Ding, R. M. Osgood, D. W. Paley, A. M. Lindenberg, P. Y. Huang, A. N. Pasupathy, M. Dubey, J. Hone, and L. Balicas, “Engineering the Structural and Electronic Phases of MoTe2 through W Substitution,” Nano Lett. 17, 1616–1622 (2017).
- Lv et al. (2016) Y.-Y. Lv, B.-B. Zhang, X. Li, B. Pang, F. Zhang, D.-J. Lin, J. Zhou, S.-H. Yao, Y. B. Chen, S.-T. Zhang, M. Lu, Z. Liu, Y. Chen, and Y.-F. Chen, “Dramatically decreased magnetoresistance in non-stoichiometric WTe2 crystals,” Scientific Reports 6, 26903 (2016).
- Toby and Dreele (2013) B. H. Toby and R. B. Von Dreele, “GSAS-II: the genesis of a modern open-source all purpose crystallography software package,” J. Appl. Crystallogr. 46, 544–549 (2013).
- Cho et al. (2017) S. Cho, S. H. Kang, H. S. Yu, H. W. Kim, W. Ko, S. W. Hwang, W. H. Han, D. H. Choe, Y. H. Jung, K. J. Chang, Y. H. Lee, H. Yang, and S. W. Kim, “Te vacancy-driven superconductivity in orthorhombic molybdenum ditelluride,” 2D Mater. 4, 021030 (2017).
- He et al. (2018) R. He, S. Zhong, H. H. Kim, G. Ye, Z. Ye, L. Winford, D. McHaffie, I. Rilak, F. Chen, X. Luo, Y. Sun, and A. W. Tsen, “Dimensionality-driven orthorhombic MoTe2 at room temperature,” Phys. Rev. B 97, 041410 (2018).
- Zhong et al. (2018) S. Zhong, A. Tiwari, G. Nichols, F. Chen, X. Luo, Y. Sun, and A. W. Tsen, “Origin of magnetoresistance suppression in thin -MoTe2,” Phys. Rev. B 97, 241409 (2018).
- Cao et al. (2018) C. Cao, X. Liu, X. Ren, X. Zeng, K. Zhang, D. Sun, S. Zhou, Y. Wu, Y. Li, and J. H. Chen, “Barkhausen effect in the first order structural phase transition in type-II Weyl semimetal MoTe2,” 2D Mater. 5, 044003 (2018).
- Dahal et al. (2020) R. Dahal, L. Z. Deng, N. Poudel, M. Gooch, Z. Wu, H. C. Wu, H. D. Yang, C. K. Chang, and C. W. Chu, “Tunable structural phase transition and superconductivity in the Weyl semimetal Mo1-xWxTe2,” Phys. Rev. B 101, 140505 (2020).