Intermediate Mass Early-type Disk Galaxies in the Virgo Cluster. II. Near-Infrared Spectra and Evidence for Differences in Evolution 11affiliation: Based on observations obtained at the Gemini Observatory, which is operated by the Association of Universities for Research in Astronomy, Inc., under a cooperative agreement with the NSF on behalf of the Gemini partnership: the National Science Foundation (United States), the National Research Council (Canada), CONICYT (Chile), Ministério da Ciência, Tecnologia e Inovação (Brazil) and Ministerio de Ciencia, Tecnología e Innovación Productiva (Argentina). 22affiliation: This research has made use of the NASA/IPAC Infrared Science Archive, which is operated by the Jet Propulsion Laboratory, California Institute of Technology, under contract with the National Aeronautics and Space Administration. 33affiliation: This research makes use of the Virgo cluster galaxy database of McDonald et al. (2011).
Abstract
We discuss near-infrared (NIR) slit spectra of six early-type disk galaxies in the Virgo Cluster that were examined previously at visible/red wavelengths by Davidge (2018a, AJ, 156, 233). Despite having similar intrinsic luminosities, colors, and morphologies, the NIR spectrophotometric properties of these galaxies indicate that they are not a homogeneous ensemble differing only in terms of luminosity-weighted age and metallicity. While the depth of the CO(2,0) band is consistent with the centers of these galaxies having solar or slightly sub-solar luminosity-weighted metallicities, galaxy-to-galaxy variations in the depth of the NaI m doublet are found, with NaIm lines in three galaxies (NGC 4491, NGC 4584, and NGC 4620) that are deeper than those predicted for a solar chemical mixture and a solar-neighborhood mass function. In contrast, the CaIm triplet shows good galaxy-to-galaxy agreement, but tends to be deeper than the model prediction. Considering the depth of the NaD lines found by Davidge (2018a), the deep NaIm lines are tentatively attributed to a bottom-heavy mass function. This is counter to observed trends between mass function slope and velocity dispersion, and so the possibility of a super-solar [Na/Fe] is also discussed. Two of the three galaxies with deep NaIm (NGC 4584 and NGC 4620) have Sersic exponents that are consistent with a classical bulge. As for NGC 4491, its central NIR spectrum contains prominent emission lines. The relative strengths of Br and H2S(1), the presence of [FeII] emission, and the mid-infrared spectral-energy distribution are all consistent with intense recent star formation near the center of that galaxy. The NIR spectrum of NGC 4584 is devoid of line emission in the NIR, suggesting that star formation does not power the emission detected at visible wavelengths from that galaxy. Wavelengths that contain the Ballick-Ramsey C2 band at m are matched by moderately metal-poor E-MILES model spectra with an age of 2 Gyr. The radial age trends in these galaxies are in the opposite sense to those in late-type disk galaxies, and it is concluded that they have evolved in a cluster environment for at least several Gyr.
1 INTRODUCTION
Environment plays a major role in defining the star formation histories (e.g. Butcher & Oemler 1984; Hogg et al. 2004; Kauffmann et al. 2004) and morphologies (e.g. Dressler 1980; Postman & Geller 1984; Moore et al. 1996; Dressler et al. 2007) of galaxies. As the nearest large galaxy cluster, Virgo is an unprecedented laboratory for exploring galaxy evolution in a dense environment. In addition to being nearby by cosmic standards, Virgo is also dynamically young (e.g. Tully & Shaya 1984; Kim et al. 2016), and so studies of its constituent galaxies may provide information on the early and intermediate stages of evolution in a cluster environment. This in turn may yield insights into conditions that prevailed in distant clusters that formed during earlier epochs.
A complicating factor for understanding galaxy evolution in Virgo is that there is sub-structure (e.g. Bingelli, Tammann, & Sandage 1987; Bohringer et al. 1994), indicating that the cluster did not form as a monolithic entity. The presence of sub-structure is not surprising, as simulations suggest that large clusters likely form through the accretion of smaller structures (e.g. McGee et al. 2009). This has implications for the properties of present-day cluster galaxies as these may have originated in a diverse range of environments and evolved for many Gyr in settings that are very different from those in the large cluster that they subsequently join (e.g. De Lucia et al. 2012; Wetzel et al. 2013; Taranu et al. 2014). Many basic galaxy properties – such as the chemical mixture imprinted in the main mass of stars that form during early epochs and the orientation of kinemetic axes – may already have been defined prior to entry into the larger cluster. Models examined by Hou et al. (2014) suggest that the effects of such ‘pre-processing’ is likely significant for halo masses M⊙. As the mass of the Virgo cluster is M⊙ (Karachentsev et al. 2018), then pre-processing in sub-groups might have been significant among Virgo galaxies. Indeed, the kinematic properties of early-type galaxies in Virgo show evidence for accretion along two axes that likely trace distinct filaments along which the galaxies in Virgo formed (Kim et al. 2018).
Interactions with an ambient cluster medium are thought to deplete and disrupt the interstellar mediums (ISMs) of disk galaxies (e.g. Gunn & Gott 1972; Rudnick et al. 2017), although gas reservoirs that feed the ISMs may be replenished in some cases (Grootes et al. 2017). It is thus not surprising that many disk galaxies in the Virgo cluster have properties that differ from their field counterparts. Disk galaxies in Virgo that are deficient in HI have ISMs that are more metal-rich than those in field galaxies, possibly due to strangulation of the gas supply (e.g. Skillman et al. 1996). Many gas-deficient Virgo spirals have truncated H disks (e.g. Koopmann & Kenney 1998; Koopmann et al. 2006; Fossali et al. 2013; Bodelli et al. 2020), often with undisturbed disks and ‘normal’ star formation rates (SFRs) within the truncation radius, although there are exceptions (e.g. Koopmann & Kenney 2004a). Star formation outside of the truncation radius appears to have stopped Gyr ago in some systems (Crowl & Kenney 2008). As this is less than the cluster crossing time for Virgo then the cessation of star formation in the outer disk of at least some galaxies may not be related directly to a passage through the cluster core (e.g. Crowl & Kenney 2008). Still, the age profiles of disk galaxies in Virgo appear to be related to environment (Roediger et al. 2012), highlighting the role that the present-day cluster plays in defining the evolution of disk galaxies.
Passively evolving red spiral galaxies and lenticular galaxies are possible outcomes of evolution in a dense environment (e.g. Bamford et al. 2009). In fact, low mass anemic spiral galaxies in the nearby Universe appear to be found preferentially in the Virgo cluster, highlighting the role that environment plays in forming those systems (Fraser-McKelvie et al. 2018). Number counts suggest that the transition from star-forming to passive disk galaxy is a process that spans many Gyr (Schawinski et al. 2014). While the stripping of the ISM and strangulation of the gas supply are possible mechanisms for forming anemic red spirals on such a timescale, it has also been suggested that galaxy-galaxy interactions may play the dominant role in altering the evolution of otherwise blue disk galaxies in clusters (e.g. Boselli & Gavazzi 2006). There is also evidence that factors other than environment may be at work. For example, the high incidence of Seyfert/LINER activity and bars when compared with bluer disk galaxies suggest that secular processes may play a role in the evolution of anemic red spirals (Masters et al. 2010). Disk truncation may also bias morphogical classification, in the sense of producing galaxies that might be classified as morphological type Sa but that lack large bulges (e.g. Koopmann & Kenney 1998, 2004b).
When considered as a group, lenticular galaxies show diverse star formation histories (SFHs), with properties that depend on galaxy luminosity, which is a proxy for mass. Whereas massive S0 galaxies tend to be predominantly old, their dwarf counterparts have a significant younger stellar content (Barway et al. 2013), suggesting differences in evolutionary paths. While classic S0 galaxies are usually associated with high-density environments, and hence may be the result of cluster-based processes such as stripping, strangulation, and galaxy-galaxy interactions, low mass lenticular galaxies can be found in lower density environments in the nearby universe. NGC 5102 and NGC 404 are among the closest examples of low mass lenticular systems. Both are relatively isolated and contain central populations with ages Gyr (Seth et al. 2010; Davidge 2015a). The radial metallicity profile of NGC 5102 suggests that the current morphology might be the result of the buckling of the bar in an LMC-like galaxy (Davidge 2015a). NGC 55 is a nearby irregular galaxy in a low density environment that may be transitioning into a dwarf lenticular morphology (Davidge 2018b; 2019). If moderate mass early-type disk galaxies in the Virgo cluster and the field have been subject to similar evolutionary processes then the former might show evidence of (1) a young stellar component, and (2) prolonged evolution in an environment that has a lower density than the present-day Virgo cluster.
1.1 A Sample of Early-Type Intermediate Mass Disk Galaxies in Virgo
Davidge (2018a) discusses visible and red spectra of six intermediate mass early-type disk galaxies in Virgo. Various observational properties of these galaxies are listed in Table 1. The colors in this table have not been corrected for internal or line-of-sight extinction. The absolute magnitudes in Table 1 are consistent with total stellar masses that are probably comparable to – or slightly larger than – that of M33, for which M (Jarrett et al. 2003) assuming a distance modulus of 24.5 (Lee et al. 2002).
The properties of the galaxies in Table 1 bridge those of low mass anemic spirals and lenticular galaxies. Lisker et al. (2006a) identify five of these galaxies as dwarf S0s (dS0s), noting that they differ from their more massive counterparts in terms of total luminosity and bulge size. The dS0 designation notwithstanding, images shown in Figure 7 of Lisker et al. (2006a) indicate that NGC 4305 and NGC 4620 have well-defined spiral structure, and only NGC 4306 and NGC 4497 lack spiral structure in the -band images from Baillard et al. (2011). We note that spiral structure in intermediate mass disk galaxies in cluster environments may result from tidal forces (e.g. Kwak et al. 2019). While not classified as a dwarf SO, Lisker et al. (2006a) conclude that NGC 4306 has a ‘certain disk’, with integrated colors and a luminosity that are similar to those of the other five galaxies.
| NGC | VCC | vraaRadial velocity, from the NASA Extragalactic Database (NED) | MKbbAbsolute magnitude, from the 2MASS Extended Object Catalogue, except for NGC 4491, which is from the 2MASS Large Galaxy Atlas (Jarrett et al. 2003). A distance modulus of 31.1 (Mei et al. 2007) is assumed. | ccCentral color, computed from PSF magnitudes listed in the NED | ddGalaxy color, computed from total magnitudes listed in the NED | reeeband half-light radius from McDonald et al. (2011) | MorphologyffFrom Binggeli et al. (1985) | nggband Sersic index from McDonald et al. (2009) | hhAngular offset from M87 |
|---|---|---|---|---|---|---|---|---|---|
| (km/sec) | (mag) | (mag) | (mag) | (arcsec) | (arcmin) | ||||
| 4305 | 0522 | 1888 | –20.7 | 0.76 | 0.99 | 29.1 | Sa | 0.6 | 133.5 |
| 4306 | 0523 | 1981 | –20.0 | 0.74 | 1.00 | 16.9 | dSB0(s),N | 0.5 | 130.3 |
| 4491 | 1326 | 497 | –21.1 | 0.33 | 0.99 | 25.3 | SBa(s) | 0.5 | 54.5 |
| 4497 | 1368 | 1045 | –21.0 | 0.78 | 1.07 | 35.2 | SB0(s)/SBa | 0.7 | 47.2 |
| 4584 | 1757 | 1779 | –20.0 | 0.30 | 0.96 | 19.6 | Sa(s) pec | 1.3 | 117.8 |
| 4620 | 1902 | 1141 | –20.5 | 0.39 | 0.90 | 18.2 | S0/Sa | 1.5 | 166.8 |
The spectra discussed by Davidge (2018a) indicate that most of these galaxies have luminosity-weighted central metallicities that are solar, and such a metallicity is more-or-less consistent with their luminosities. Gallazzi et al. (2005) examine the relation between stellar mass and metallicity using a large number of SDSS spectra. While there is considerable scatter in their metallicity vs. stellar mass relation, the ridgeline of the relation is consistent with a roughly half-solar mean metallicity for the galaxies in Table 1. A relation between metallicity and stellar mass/luminosity can also be constructed from gas phase metallicities, although the luminosity-weighted mean metallicity of stars that formed over a range of epochs and the chemical composition of the present-day gas may differ. The composite relation between [O/H] and MH presented by Saviane et al. (2008) in their Figure 9 suggests that a galaxy with M is expected to have log(O/H)+12 between 8.3 and 8.4 if , or 0.3 – 0.4 dex lower than solar. That the characteristic metallicities of these galaxies are consistent with their luminosities suggests that they have not been subjected to large-scale stripping of stellar material following their formation and early evolution, and that their dominant stellar components formed from material that was retained by the host galaxy during the epoch of disk assembly and early chemical evolution. The early evolution of these galaxies may then not have been influenced by processes that are usually associated with dense environments.
Most disk galaxies have radial spectrophotometric gradients that can be characterized in terms of metallicity and age. A metallicity gradient, in the sense of progressively lower luminosity-weighted metallicities towards larger radii, was found by Davidge (2018a) in five of the galaxies that they studied, and similar trends are common in disk galaxies (e.g. Goddard et al. 2017; Li et al. 2018). Simulations suggest that metallicity gradients in galaxies may have diverse origins (e.g. Pilkington et al. 2012), as metallicity at a given location in the disk can be influenced by factors such as the local mass density, the ability to retain gas if there are outflows powered by star formation and/or active nuclei, and the area within a galaxy where gas can be accreted – either from a surrounding reservoir or from interactions with another galaxy – and then cool sufficiently to form stars. These processes can also cause the radial distribution of metals to evolve with time (e.g. Magrini et al. 2016), as can interactions in a disk environment (e.g. Roskar et al. 2008) or radial mixing that is driven by bars and mergers.
The spectra discussed by Davidge (2018a) reveal older luminosity-weighted ages at larger radii. Such a radial age gradient is in the opposite sense to that seen in the vast majority of nearby isolated gas-rich disk galaxies (e.g. Gonzalez Delgado et al. 2017). While the age gradient in late-type disks is usually attributed to inside-out galaxy formation, the radial age distribution can be altered by secular (e.g. stellar migration or bar formation/collapse) or external (e.g. interactions with companions or an ambient intergalactic medium) processes that can affect the SFR and induce the radial mixing of stars. The red colors of the galaxies in Table 1 indicate that large scale disk star formation has been shut down for some time. The observed age gradients suggest that star formation did not end suddenly throughout these galaxies, but decreased over time scales of a Gyr or more, progressing from the low-density outer regions into the higher density central regions. While age gradients undoubtedly contain information imprinted in the course of the evolution of the host galaxy, the radial behaviour of luminosity-weighted age can be influenced by a number of processes. Age gradients on their own are then not unambiguous indicators of the process (or processes) that might have ended star formation in a cluster environment, such as strangulation of the gas supply, galaxy-galaxy encounters, or ram pressure stripping.
The galaxies in Table 1 have similar integrated colors at visible/red wavelengths, and in the absence of significant internal extinction the colors are indicative of light that is dominated by intermediate age or old populations. Despite having similar broad-band spectral energy distributions (SEDs) at visible and red wavelengths, there are galaxy-to-galaxy differences in the central colors, with NGC 4491, NGC 4584, and NGC 4620 having the bluest central colors. In fact, prominent emission lines are seen in the visible/red spectra of the centers of NGC 4491 and NGC 4584, while the central mid-infrared (MIR) colors of these galaxies point to significant amounts of hot dust (Davidge 2018a). That (1) there appears to be significant sources of ionizing radiation in the centers of two galaxies, and (2) there is a range of luminosity-weighted ages estimated for the disks from Balmer line depths (Davidge 2018a), suggests that while the galaxies in Table 1 share morphological similarities, they may be in different stages of evolution, and/or have been subjected to different evolutionary processes.
1.2 The Present Study
Light at wavelengths longward of m contains information for examining stellar content that is complementary to that obtained from light at shorter wavelengths. While main sequence turn-off (MSTO) and sub-giant branch (SGB) stars contribute significantly to the light at visible wavelengths, the light from intermediate age and old composite stellar systems at wavelengths longward of m is dominated by stars with low effective temperatures (e.g. Davidge 1990; Maraston 2005). The construction of well-populated stellar libraries (e.g. Rayner et al. 2009), have allowed comprehensive grids of model spectra to be computed that include the m wavelength region (e.g. Conroy & van Dokkum 2012; Meneses-Goytia et al. 2015; Rock et al. 2016; Conroy et al. 2018). Not only do these models facilitate studies of the most evolved stars in stellar systems, but they have also fueled efforts to probe the mass function in the low stellar mass regime. Recent studies reveal a correlation between the slope of the mass function at the low mass end and the stellar velocity dispersion, in the sense of a steepening mass functions at low masses towards higher velocity dispersions (e.g. Rosani et al. 2018, Spiniello et al. 2014, Conroy et al. 2013, Cappellari et al. 2013, Ferreras et al. 2013). Integrated light studies of the mass function are also important for very nearby objects (e.g. star clusters in the Galaxy) because they provide a complete census of low mass stars, whereas mass functions that are based on star counts may miss low mass stars that are in close binary systems.
In the current paper, long slit NIR spectroscopic observations of the galaxies in Table 1 are discussed. The spectra were recorded with the Flamingos-2 (F2) imaging spectrograph on Gemini South (GS) and cover wavelengths from m. The paper is structured as follows. The observations and the procedures used to remove instrumental and atmospheric signatures from the raw data are summarized in Section 2. Properties of the spectra are discussed in Sections 3 and 4, while comparisons with model spectra are the subject of Section 5. Radial variations in the spectra are examined in Section 6. The paper closes with a summary and discussion of the results in Section 7.
2 OBSERVATIONS & REDUCTIONS
2.1 Description of the Observations
The spectra were recorded with the cryogenically-cooled F2 imaging spectrograph (Eikenberry et al. 2004) for programs GS-2016A-Q-84 and GS-2017A-Q-81 (PI Davidge). The detector in F2 is a Teledyne Hawaii-2 array, with each pixel subtending 0.18 arcsec along the spatial direction. The spectra were recorded through a 4.5 arcmin long by 1 arcsec wide slit. Light was dispersed with the HK grism, with useable wavelength coverage extending from m to m. The spectroscopic resolution estimated from the widths of arc emission lines is FWHM, which is consistent with published values 444www.gemini.edu/sciops/instruments/flamingos2/spectroscopy/grisms. This resolution is sufficient to recover age and chemical mixture at visible wavelengths (e.g. Choi et al. 2014).
The spectra were recorded using conventional observing procedures for NIR spectra, with the galaxies offset in an ‘ABBA’ nodding pattern along the slit, where ‘A’ and ‘B’ are different locations on the slit that were typically separated by arcsec. This offset was selected based on the angular extent of the galaxies and the need to retain guide stars to prevent time loss due to re-acquisition. In most cases this offset is at least the half light radius of a galaxy, and the slit was typically positioned at an angle that was close to the minor axis. An upper limit to the contamination from the ‘other’ nod position in the outermost radial extraction interval is no more than 15% based on the surface brightness profiles of low mass disk galaxies in Virgo discussed by McDonald et al. (2011). The cross-talk between nod positions in thus expected to be modest in the angular intervals considered in this study. For some targets it was necessary to use an offset that placed the target galaxy out of the science field for either the A or B position to avoid thermal emission from the guide probe entering the slit. 555The On-Instrument Wave Front Sensor (OIWFS) is preferred for F2 observations as it does not block NIR light in the science path. However, the OIWFS was inoperable when these data were recorded, and so a Peripheral Wave Front Sensor (PWFS) was used for guiding. The PWFSs are not part of F2, are not cooled, and are not in the instrumental focal plane. As a result, they can physically obstruct or cast shadows that occult the spectrograph slit, while also contributing to the thermal background.
A 300 sec exposure was recorded at each slit location, and multiple ABBA cycles were repeated for each galaxy. A log of the observations can be found in Table 2. The last two columns of Table 2 show the estimated percentage noise levels per pixel in the central 2 arcsec (i.e. the Center and Region 2 extraction areas, as defined in Table 3) of the and windows in the spectrum of each galaxy. Noise levels were measured near the peak overall throughput for each passband, and the spectra will be noisier near the edges of the and windows where telluric absorption lowers throughput. Not surprisingly, the two faintest galaxies (NGC 4306 and NGC 4584) have the noisiest spectra.
| NGC | Date (UT) | Number of | Noise | Noise |
|---|---|---|---|---|
| ExposuresaaEach exposure is 300 sec in duration. | (H)bb percentage noise per pixel near the centers of the H and K passbands. The noise estimates apply to spectra within 2 arcsec of the galaxy centers. | (K)bb percentage noise per pixel near the centers of the H and K passbands. The noise estimates apply to spectra within 2 arcsec of the galaxy centers. | ||
| 4305 | March 25, 2016 | 10 | ||
| March 25, 2017 | 20 | |||
| 4306 | February 11, 2017 | 36 | ||
| March 8, 2017 | 4 | |||
| 4491 | April 1, 2016 | 20 | ||
| April 8, 2016 | 20 | |||
| April 4, 2017 | 20 | |||
| 4497 | February 15, 2017 | 20 | ||
| April 5, 2017 | 20 | |||
| 4584 | March 27, 2016 | 10 | ||
| March 30, 2017 | 20 | |||
| 4620 | March 29, 2017 | 20 | ||
| April 2, 2017 | 20 |
The observing strategy of alternating observations between two locations on the slit leads to a simple and efficient means of removing the ‘sky’, which is dominated by telluric emission lines and the thermal background. The simplicity in sky removal occurs because the subtraction of two spectra taken at different slit locations results in the removal of background light that is not affected by fringing or non-uniformities in slit illumination. As for efficiency, science data are recorded at the same time as the background signal when this observing strategy is employed. While there is a time lag between when the galaxy and the background are observed at a given slit position, experience has shown that only minor variations in the amplitude of sky emission lines occur over time scales of a few hundred seconds during photometric or broken overcast observing conditions at GS.
The spectrum of an early-type star was typically recorded before and after each block of galaxy observations to monitor telluric absorption. In some cases only one such ‘telluric standard’ observation was recorded due to time limitations or the premature termination of observations to accomodate a change in observing conditions. These telluric star spectra are not suitable for absolute flux calibration because (1) they were often recorded during non-photometric conditions, and (2) there may be significant light loss outside of the slit.
Spectra of dispersed light from a continuum lamp and an Ar arc that are in the Gemini facility calibration unit (GCAL) were also recorded. The former were recorded at various times on nights when the galaxies were observed, and these exposures were used to correct for non-uniform slit illumination and pixel-to-pixel variations in sensitivity (‘flat-fielding’). The arcs were usually recorded at the end of an observing sequence.
2.2 Data Reduction
The extraction of scientifically useable spectra involved a number of steps. The first was the subtraction of pairs of sequential offset exposures (i.e. subtracting galaxy frames taken at the B slit position from those at the A position, and visa versa). This removes additive components such as the background sky as well as artifacts that are introduced by the observing system and are common to both exposures. The latter includes the detector dark current as well as thermal signatures that originate in the instrument, the telescope, and from warm objects along the line of sight, such as dust on the F2 cryostat window.
The next step was to divide the differenced spectra by the flat-field frames that were constructed from the GCAL continuum lamp observations. This step balances pixel-to-pixel variations in detector quantum efficiency, while also compensating for non-uniform illumination along the slit. A correction was then applied to remove optical distortions that curve the spectra perpendicular to the dispersion axis (the so-called spectrograph ‘smile’). The positions of emission lines in the arc spectra were traced at different locations along the slit, and a two-dimensional analytic function was fit to the resulting grid. A rectification function could then be generated and applied to the data using this analytic representation of line curvature.
At this point the processed data are a series of background-subtracted, flat-fielded, geometrically rectified images, most of which contain positive and negative spectra due to the subtraction of images performed in the first step. Spectra within arcsec of each galaxy center were extracted for subsequent processing, and the positive and negative versions of these were co-added by subtracting the negative spectrum from its positive counterpart. All of the spectra for each galaxy were then combined to produce a final extracted two-dimensional spectrum.
Telluric absorption features were removed by dividing the galaxy spectra by a telluric reference spectrum, which typically was constructed from spectra of more than one star (see below). While the telluric spectra are not suitable for absolute flux calibration (Section 2.1), they still track large-scale wavelength-dependent variations in instrument response in a relative sense. This step thus removes structure from the spectra that is due to variations in instrumental response, simplifying the task of identifying a pseudo-continuum. The stars that monitor telluric features are hot sub-dwarfs, and some of the spectra contain Brackett series hydrogen lines. These lines were fit with Gaussian profiles, and the resulting fits were subtracted from the stellar spectra prior to using them to correct for telluric absorption.
The quality of telluric feature suppression was judged on a spectrum-by-spectrum basis via visual inspection, using the suppression of large-scale variations in wavelength due to telluric water absorption near m as the primary criterion. The center of this telluric H2O band is heavily obscured, and thus provides an extreme test for the correction of telluric features. Whenever possible, the average spectra of telluric stars that were observed before and after each observing block were used to remove telluric features. This resulted in an acceptable suppression of telluric features in most cases, while also boosting the S/N ratio of the telluric correction at the longest wavelengths in the atmospheric window, where the signal in the telluric spectra tends to be low. In the few cases when the suppression of telluric lines with the average telluric spectrum was found to be unsatisfactory then telluric corrections were made using individual stellar spectra, and the stellar template that best suppressed telluric features was adopted.
Interpolation between spectra in the and windows indicated that light in the telluric m feature was typically recovered at the level when averaged over many hundredths of a micron in wavelength. Averaging the signal over this wavelength interval was necessary to boost the S/N ratio in this region of low atmospheric transmission. The C2 band near rest frame m falls in the shoulder of the atmospheric m H2O band, and this features is of particular astrophysical interest (Sections 4 – 6). The noise levels due to telluric features are up to per pixel near m (e.g. Figure 1).
The penultimate step was wavelength calibration. Bright, isolated emission lines in the arc spectra were used as wavelength calibrators. Wavelength calibrated spectra were constructed with linear and logarithmic wavelength increments. The wavelength calibrated spectra were shifted into the restframe using radial velocities from the NASA Extragalactic Database (NED) 666https//ned.ipac.caltech.edu/. These velocities were adopted over those measured directly from the data given the low spectral resolution of the F2 spectra. The veracity of the velocity corrections is evident in the galaxy-to-galaxy wavelength consistency of the spectroscopic features and the excellent agreement with features in model spectra. This is demonstrated in Figures 5 and 6, most noteably with the CO(2,0) band.
Spectra were then extracted in the radial intervals listed in Table 3. Spectra in the same radial interval on both sides of the galaxy center were combined. The angular extent of the central region is based on the typical image quality, while the other binning intervals were selected to maintain more-or-less the same signal level as in the central spectrum. Still, the S/N ratio in most of the spectra plummets in Regions 3 – 5, and so spectra in Regions 3 – 5 are only considered for NGC 4491 and NGC 4497 (Section 6.2). The extracted spectra were normalized to a pseudo-continuum, which was found by fitting a low order polynomial to each spectrum after applying an iterative rejection filter to suppress absorption features. Such normalization avoids inherent uncertainties that may affect flux calibrated spectra (e.g. Conroy et al. 2018).
| Interval | Angular Range |
|---|---|
| Name | (arcsec) |
| Center | 0 – 0.75 |
| Region 2 | 0.75 – 2.1 |
| Region 3 | 2.1 – 5.1 |
| Region 4 | 5.1 – 11.1 |
| Region 5 | 11.1 – 23.1 |
3 VELOCITY MEASUREMENTS AND SPECTRAL RESOLUTION
The shape of absorption and emission features in a galaxy spectrum depends in large part on the spectroscopic resolution, which is defined by instrumental parameters (e.g. the ruling density on the dispersive element, slit width, and the imaging characteristics of the optics) coupled with the motions of stars and gas within the galaxy. An understanding of the spectral resolution is critical for determining population properties such as luminosity-weighted age and metallicity through comparisons with models. While the instrumental contribution to spectroscopic resolution can be measured directly from the widths of arc or telluric emission features, the contribution made by stellar motions within these galaxies must be assessed on a target-by-target basis.
Velocity dispersion measurements were made from the galaxy spectra with the FXCOR routine in IRAF. 777IRAF is distributed by the National Optical Astronomy Observatory, which is operated by the Association of Universities for Research in Astronomy (AURA) under cooperative agreement with the National Science Foundation. The m wavelength interval, which contains the first overtone (2,0) CO band head, CN bands, and lines of Ca, Si, and Mg was adopted for the analysis. While the (3,1) CO transition is sampled with these data, the inclusion of this feature introduced side lobes in the correlation function that complicated efforts to measure a characteristic width.
K giant spectra from the library described by Rayner et al. (2009) were used as reference spectra for the velocity measurements. These stars were selected because of the spectroscopic similarities between solar neighborhood K giants and the galaxy centers (Section 4). Spectra of selected K giants were downloaded from the Infrared Telescope Facility website 888http://irtfweb.ifa.hawaii.edu/ spex/IRTF_Spectral_Library/, and the results were smoothed and re-sampled to match the resolution and wavelength sampling of the F2 spectra. The correlation functions produced with these reference spectra did not yield measureable velocity dispersions, even though the galaxy centers are where the velocity dispersion and the S/N ratio should be highest. These results are thus consistent with the spectral resolution of all of the spectra being dominated by instrumentation, and so no adjustment to spectral resolution is made in this study for velocity dispersion.
4 ABSORPTION AND EMISSION LINES IN THE CENTRAL SPECTRA
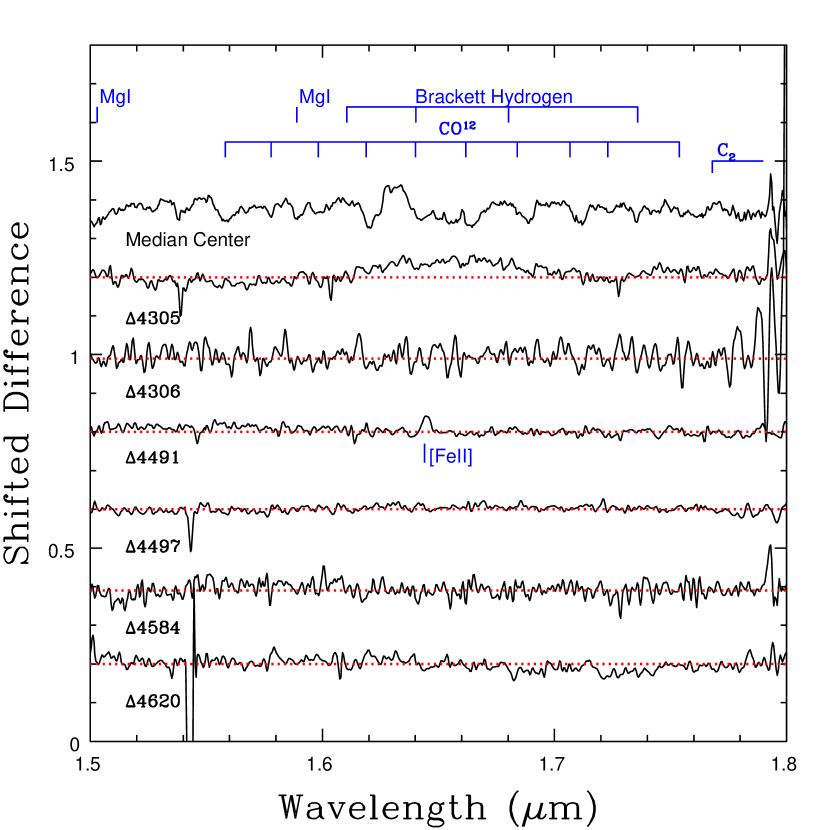
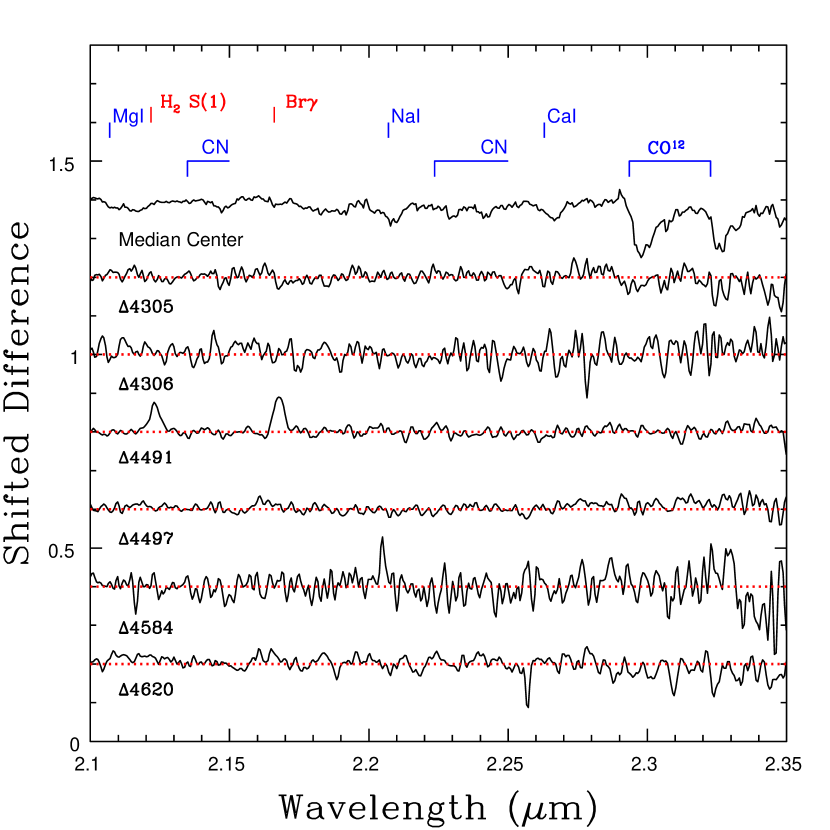
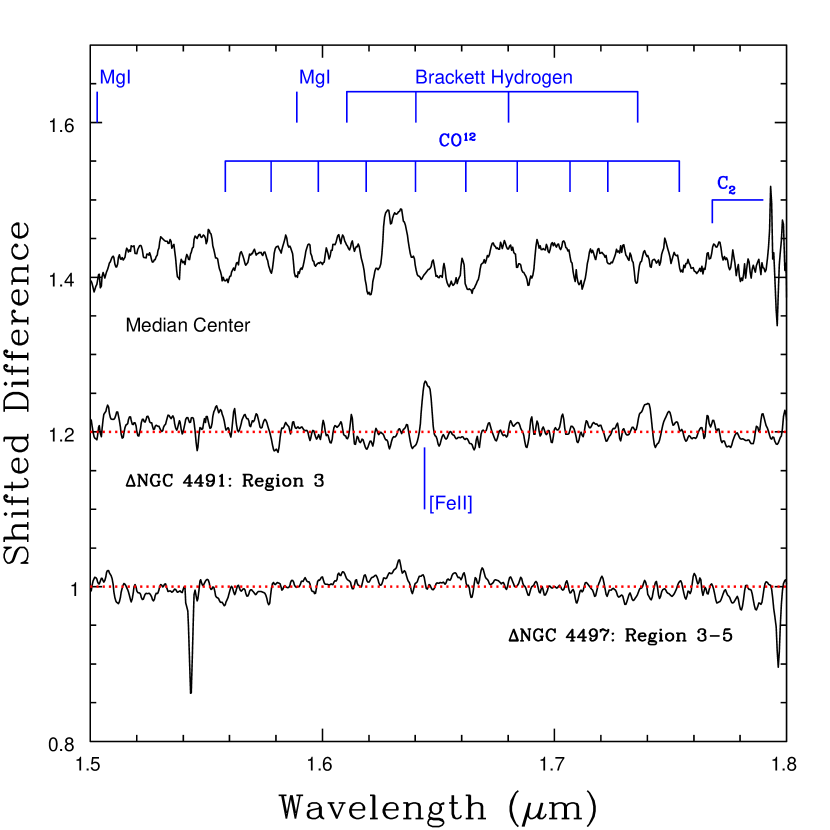
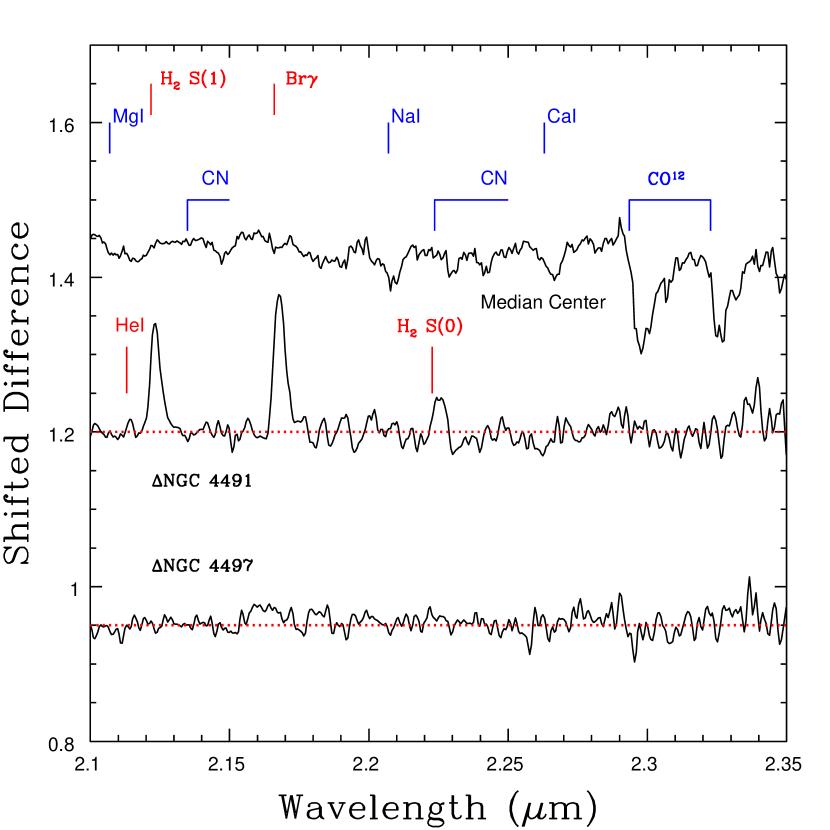
The examination of the spectra begins with a brief discussion of the features in the central spectra, while comparisons are made with model spectra in Section 5 and radial trends are examined in Section 6. The S/N ratio of the spectra is highest near the galaxy centers, and so the central spectra serve as good starting points for evaluating the stellar contents of these galaxies. Spectra of the central regions are compared in Figures 1 (H-band) and 2 (K-band), where prominent atomic and molecular features are identified. The atomic line and molecular band identifications in these figures are based on those made by Rayner et al. (2009) in figures throughout their paper, combined with the wavelength lists in their Tables 6, 7, and 10.
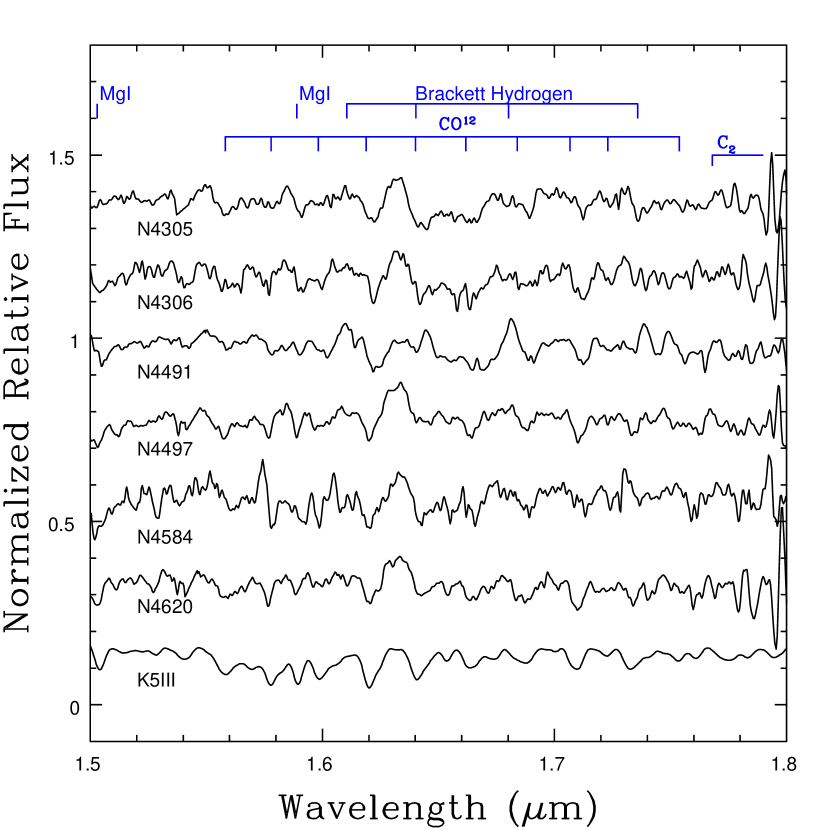
The spectrum of the K5III star HD181596 is shown in Figures 1 and 2 to aid in the identification of blended atomic and molecular lines. This star was selected as a reference because its spectrum shares features that are similar to (but not identical to) those in the galaxy spectra. The spectroscopic properties of HD181596 are those of an evolved star that has a more-or-less solar metallicity and chemical mixture. Its spectrum in Figures 1 and 2 is from the Rayner et al. (2009) library, and has been smoothed and re-sampled to match the spectral resolution and wavelength sampling of the F2 spectra. The widths of features in the smoothed HD181596 spectrum match those in the F2 spectra, although noise in the latter make some features appear sharper than in the former. Like the galaxy spectra, the HD181596 spectrum was normalized to a pseudo-continuum that was found by fitting a low order function to pseudo-continuum points.
The dominant absorption features in Figure 1 are the second-overtone bands of CO. The modest spectral resolution of the F2 spectra complicates the detection of atomic absorption features, although absorption lines of MgI are seen in most of the band spectra. Emission lines of the hydrogen Brackett series are present in the NGC 4491 spectrum, and the presence of these lines is not surprising given the line emission in the visible spectrum of that galaxy found by Davidge (2018a). [FeII]m emission is also seen (Section 6). However, obvious emission features are not evident in the NGC 4584 spectrum, even though the visible/red spectrum of that galaxy has H and [SII] in emission, with equivalent widths that are only slightly weaker than those in NGC 4491.
The characteristic age and metallicity estimates from Figures 16 and 17 of Davidge (2018a) are such that some of these galaxies might be expected to have high C star frequencies. The Ballick-Ramsey C2 band at m can be a prominent feature in the spectra of late-type C stars, and has been detected in the integrated light of nearby galaxies with large intermediate age populations (Miner et al. 2011; Davidge 2015b, 2016). At low redshifts the C2 band falls in the shoulder of the telluric H2O band centered near m, and the recession velocities of galaxies in Virgo push the C2 band into this water band. The rest frame galaxy light near m thus has diminished throughput and is subject to telluric absorption features from H2O transitions. The problems associated with telluric water absorption notwithstanding, there is a tendency for the mean signal in Figure 1 to be depressed in the NGC 4305, 4306, and 4620 spectra at wavelengths where C2 absorption might be expected. In Section 5 it is shown that the spectra at these wavelengths are consistent with models of a moderately metal-poor simple stellar population (SSP) with an age of 2 Gyr.
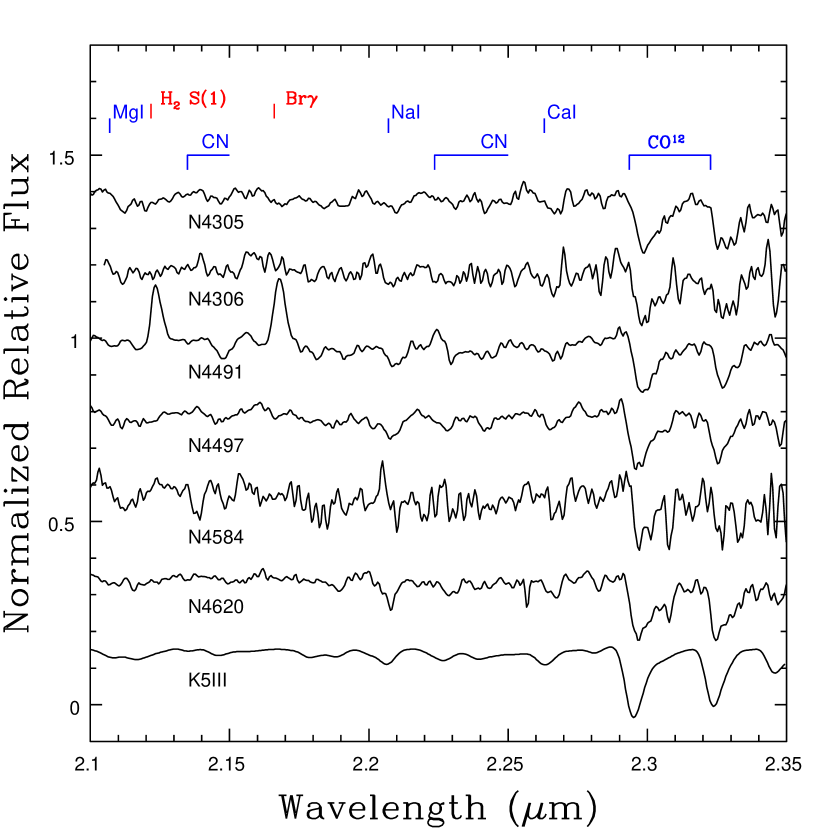
The first overtone bands of CO are the deepest features in Figure 2. There are other molecular signatures in Figure 2, and some of the absorption features at wavelengths immediately longward of m and m are due to CN. These CN bands are not sensitive indicators of C stars (e.g. Figure 34 of Rayner et al. 2009).
The Ca triplet near m is detected in all of the spectra, as is the NaI doublet near m. Individual lines of NaI and CaI within these features are not resolved, and so they appear as broad absorption features. There are galaxy-to-galaxy differences in the depth of the NaI doublet, and these are of interest as NaIm in some early-type galaxy spectra has been found to be deeper than predicted by models that assume a solar chemical mixture and solar neighborhood mass function. Rock et al. (2017) attribute stronger-than-expected NaIm absorption to a super-solar [Na/Fe] combined with a bottom-heavy mass function. That there are galaxy-to-galaxy differences in the depth of NaIm thus suggests that there may be differences in stellar content among the Virgo galaxies that can not be attributed to the dispersion in luminosity-weighted age and/or metallicity that might be expected among a homogeneous sample of objects in a cluster environment that are at different stages of evolution. Possible origins of the galaxy-to-galaxy NaIm differences are discussed in Section 7.
The band spectrum of NGC 4491 differs from the others in that there are molecular and atomic Hydrogen emission lines. The relative strengths of the H2 S(1) and Br lines yield insights into the physical conditions in the emission region. The ratio of the strengths of these two lines is , and this is near the high end of the range seen among star-forming galaxies (e.g. Puxley et al. 1990).
Veiling of stellar spectra by nebular emission affects the depths of absorption features, with the NIR spectra of the central regions of NGC 253 being one example (Davidge 2016). However, it is unlikely that veiling affects the depths of absorption lines in the central spectrum of NGC 4491. If a significant emission component were present then the CO bands in NGC 4491 might be expected to deepen with progressively larger distances from the galaxy center as the fractional contribution from emission dimishes, and such a trend is not seen (Section 6). Nebular emission dominates the light output near m in SSPs with ages of 1 Myr, but by an age of 5 Myr the emission component becomes substantially weaker (e.g. Figure 11 of Byler et al. 2017). If there is continuous star formation then an equilibrium state is reached such that relative line strengths in the emission spectrum are similar to those in a system with an age of a few Myr (Byler et al. 2017). High levels of nebular continuum emission are thus only expected if the center of NGC 4491 is viewed during a relatively short window in time after the onset of star formation.
5 COMPARISONS WITH MODELS
Comparisons are made with model spectra from the E-MILES suite (e.g. Rock et al. 2016) in this section. These models span a broad range of metallicities and ages, with wavelength coverage that extends from the near-UV to the MIR. The models use the stellar library discussed by Rayner et al. (2009), which is made up largely of bright Galactic stars. Hence, the models are most applicable for stellar systems that have near-solar metallicities and chemical mixtures. Model spectra in the E-MILES compilation have been constructed using the Padova00 (Girardi et al. 2000) and BaSTI (Pietrinferni et al. 2004; Cordier et al. 2007) isochrones. In the current paper, comparisons are made with models that are based on the BaSTI isochrones. A Chabrier (2001) mass function is assumed.
Conventional practices for probing stellar content are to examine spectral indices and/or directly fit models to the observed spectra. However, a different approach is adopted here in an effort to highlight subtle changes in the spectra: model spectra are subtracted from a reference spectrum and the residuals are examined. Systematic artifacts due to uncertainties in the removal of telluric absorption and emission features are suppressed when such ‘differenced spectra’ are considered. The suppresion of these features are of particular importance when probing the wavelength region that contains the C2 band at m in the Virgo galaxy spectra, as it is in the shoulder of a deep telluric H2O band..
Model spectra were downloaded from the MILES website 999http://www.miles.iac.es, and these were smoothed and re-sampled to match the spectral resolution and sampling of the F2 spectra. The sensitivity of spectral features to changes in age and [M/H] (the abundance of all metals with respect to the solar value) depend on spectral resolution, in the sense that higher resolution spectra have the potential to yield more information and tighter constraints on relevant parameters (e.g. Dahmer-Hahn et al. 2018). This being said, ages, metallicities, and chemical abundances may be deduced from visible spectra with resolutions as low as (e.g. Appendix 2 of Choi et al. 2014), although the bright main sequence stars that contribute significant age and metallicity information at visible wavelengths make a much smaller contribution to the integrated light in the NIR. Thus, changes in features in the NIR in response to variations in age and metallicity are more subtle.
5.1 Trends in Model Spectra with
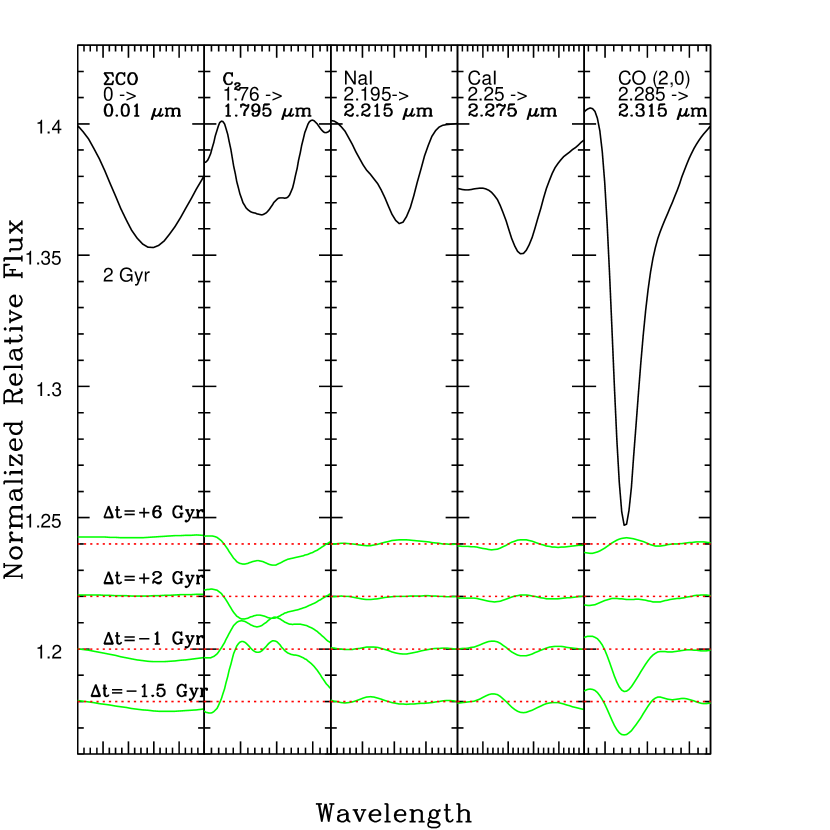
The response of model spectra with the spectral resolution of the F2 observations to changes in age and metallicity is examined in Figures 3 and 4. Emphasis is given to features that are of interest for examining the stellar contents of old and intermediate age populations. Each figure shows selected wavelength intervals from a reference spectrum of a 2 Gyr SSP with [M/H] =–0.25, as well as differenced spectra that are the result of subtracting models with different metallicities and ages from the reference spectrum. The age and metallicity of the reference spectrum is typical of that deduced from the visible-red spectra by Davidge (2018a). James & Percival (2018) find similar luminosity-weighted ages in disks that have been swept by bars. The reference spectrum has been continuum-corrected and normalized to unity, and then shifted vertically in Figures 3 and 4 for display purposes. The differenced spectra were constructed by subtracting normalized, continuum-corrected model spectra, and these have also been shifted vertically for display purposes. CaIm is in a CN band, and the spectra of this feature have been adjusted to match a localized pseudo-continuum. Given that the differenced spectra were constructed from normalized spectra then the increments along the vertical axis in Figures 3 and 4 directly measure fractional variations in the strengths of features as age and metallicity change; each 0.01 increment along the vertical axis corresponds to a 1% difference between subtracted model spectra.
The left hand panel of each Figure examines the behaviour of a composite feature termed CO. There are numerous second-overtone CO transitions in the band and these contain similar encoded information. CO is an attempt to multiplex the information content of these features by combining them together. A complication is that the CO bands are blended with other features. Transitions were selected for combination using the K5III spectrum in Figure 1 as a guide to overcome potential problems with blending. Based on their shape and isolation from other obvious features, the (3,0),(6,3), (7,4), and (10,7) transitions were selected to construct CO. A m wavelength interval centered on each transition was extracted, and these were then averaged together to produce CO. Taking the median instead of the mean would suppress information from outliers; however, outliers are not expected to be present since the transitions used to construct CO were selected based on their shape and isolation. Taking the mean also avoids problems due to uncertainties in the placement of the local pseudo-continuum near each transition.
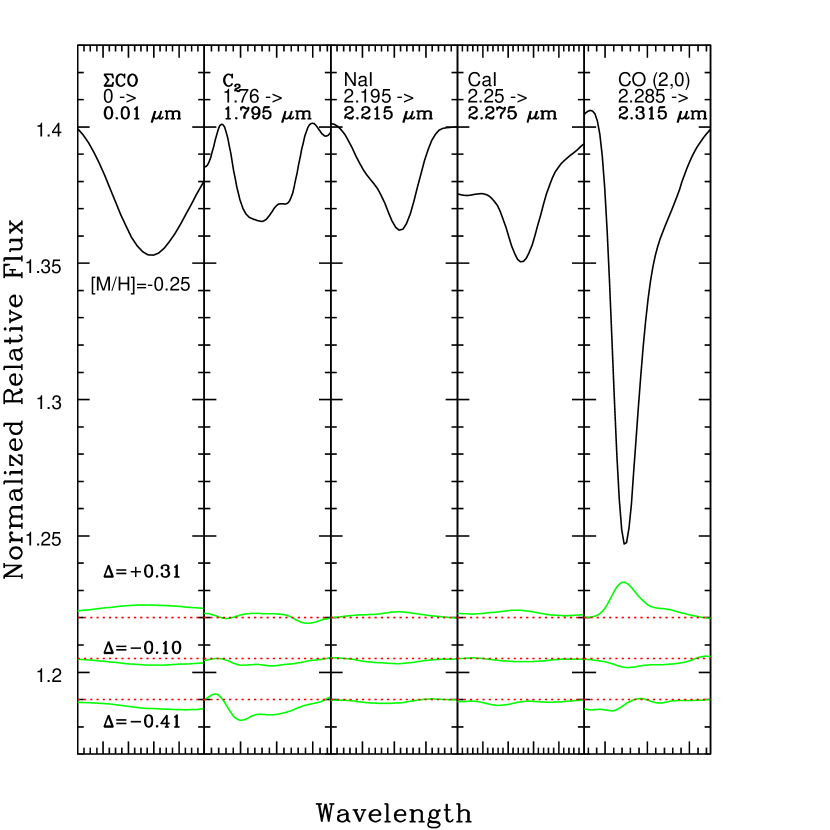
The depth of CO changes in a similar manner to CO (2,0) in Figures 3 and 4, and so in the following discussion we focus our attention on CO(2,0). The sensitivity of the CO(2,0) band to [M/H] reflects changes in line strength due to chemical content, as well as changes in the temperature of the giant branch, which at a fixed age shifts to lower values as metallicity increases. The temperature dependence of the CO(2,0) band is such that shifting the temperature of the giant branch to cooler values at a fixed age causes the depth of the CO(2,0) band to increase, and this behaviour is seen in the [M/H] differenced spectrum. However, there are departures from these basic expectations. For example, the differenced spectra in Figure 3 indicate that the CO(2,0) band in the [M/H] model is slightly stronger than in the [M/H] model, which is contrary to what might be expected.
There are inherent uncertainties in the physics used to model highly evolved stars, and these propogate into the isochrones from which the model spectra are constructed. The depth of the CO(2,0) band in the [M/H] model might be a consequence of how the latest stages of AGB evolution are tracked in the models. The temperature of the AGB shifts to higher values at a fixed age as metallicity is lowered. However, evolution on the AGB is also sensitive to the rate of mass loss, in the sense that if the mass loss rates decrease towards lower metallicities then AGB stars with progressively lower metallicities will evolve to more advanced stages before leaving the AGB (e.g. Bowen & Willson 1991; Willson 2000). Still, mass loss rates estimated for highly evolved stars in the SMC, LMC, and the Galaxy are very similar, even though these galaxies span dex in [M/H] (e.g. Groenewegen & Sloan 2018). A trend of higher AGB-tip luminosities towards lower metallicities is seen in the BaSTI isochrones, which adopt the mass loss formulism of Vassiliadis & Wood (1993) for the AGB (Cordier et al. 2007). If the AGB-tip is allowed to evolve to lower surface gravities and higher luminosities at [M/H] when compared with [M/H] then the expected trend of decreasing CO(2,0) strength with decreasing metallicity in the models might be reversed, as is seen in Figure 3.
The C2 band in the [M/H] model is weaker than in the [M/H] model. Naively, this seems to contradict the empirical relation between C star frequency and metallicity (e.g. Battinelli & Demers 2005), which is such that the ratio of C to M stars increases in galaxies as metallicity drops. The contribution that C stars make to the NIR light, and hence the depths of signature C star features such as C2, might then be expected to strengthen as metallicity is lowered. However, the temperature of the AGB sequence increases as metallicity drops, and so plays a role in defining the contribution that C stars make to the NIR light. Still, C star signatures strengthen as metallicity decreases in models discussed by Maraston (2005).
The sample of C stars that are in the model library and the contributions that they make to the NIR spectrum also influence the depth of C molecules in model spectra. For example, gaps or omissions in the types of C stars in the library will compromise the ability of models to match the spectra of real systems. C stars in the model library may also have diverse spectroscopic properties, possibly related to particular circumstances that influenced their evolution, such as binarity. Figure 34 of Rayner et al. (2009) compares the spectroscopic properties of C stars in their library. The coolest C star in their sample is R Lep, and the C2 band in the spectrum of that star is shallower than in the spectra of the two warmer C stars, even though the CO(2,0) bands in R Lep are deeper than in the spectra of the other stars. Varying the fraction of light that stars like R Lep contribute in the model will potentially affect the properties of the C2 and CO(2,0) features in the model spectra of intermediate age populations in a complicated way.
The comparisons in Figure 4 indicate that the depths of the C2 and the CO(2,0) bands are sensitive to changes in age for systems with half-solar metallicities. NaIm is remarkably insensitive to age variations, and this is likely due to this feature being deepest in the spectra of stars that are on the lower main sequence. The C2 band grows in strength in the models that are younger than 2 Gyr, reflecting the increase in the C star frequency in models with younger ages, coupled with the higher luminosity of the AGB-tip that occurs when progenitor mass increases. As for the CO(2,0) band, the changes in the depth of this feature with age are due to the temperature of the giant branch. The temperature of the giant branch changes only slightly with age among systems with metallicities near those considered here and ages in excess of a few Gyr (e.g. Figure 3 of Pietrinferni et al. 2004), and so the depths of CO(2,0) in the 2 Gyr and 8 Gyr models are only modestly different. In contrast, the giant branch temperature changes with age at a more rapid pace in systems with ages younger than 3 Gyr. This results in a greater rate of change in the depth of the CO(2,0) band with age among systems that are younger than 2 Gyr than is the case among older systems.
5.2 Comparing the F2 Spectra with Models
The comparisons in Figures 3 and 4 indicate that galaxy-to-galaxy variations in age and metallicity of the size found from the GMOS spectra will alter the depths of key NIR spectroscopic features in the F2 spectra by only a few percent. We thus limit comparisons with models to the central spectra, as this is where the S/N ratio is highest. The one exception is NGC 4491, where comparisons with models are made with the the Region 3 spectrum to avoid nebular emission near the center of that galaxy.
The goal of these comparisons is not to deduce an independent SFH. This would be a challenging task given the reduced contribution made by stars near the main sequence turn-off to NIR light and uncertainties in the models of stars in the advanced stages of evolution (e.g. Dahmer-Hahn et al. 2018). In addition to uncertainties in the models, variability among the most evolved objects will affect their contribution to the total light (e.g. Davidge 2014). In the current paper we thus focus on determining if the NIR spectra are consistent with the luminosity-weighted ages and metallicities estimated from the GMOS spectra. Major discrepancies between models and NIR spectra will reveal uncertainties in the evolution of highly evolved stars and the assumptions used to construct the models, such as the nature of the mass function among low mass stars. Furthermore, while galaxies are complex stellar systems that contain stars spanning a range of ages and metallicities, the comparisons made here are restricted to models of SSPs, as such comparisons provide the luminosity-weighted ages and metallicities that will be compared with those found from the GMOS spectra.
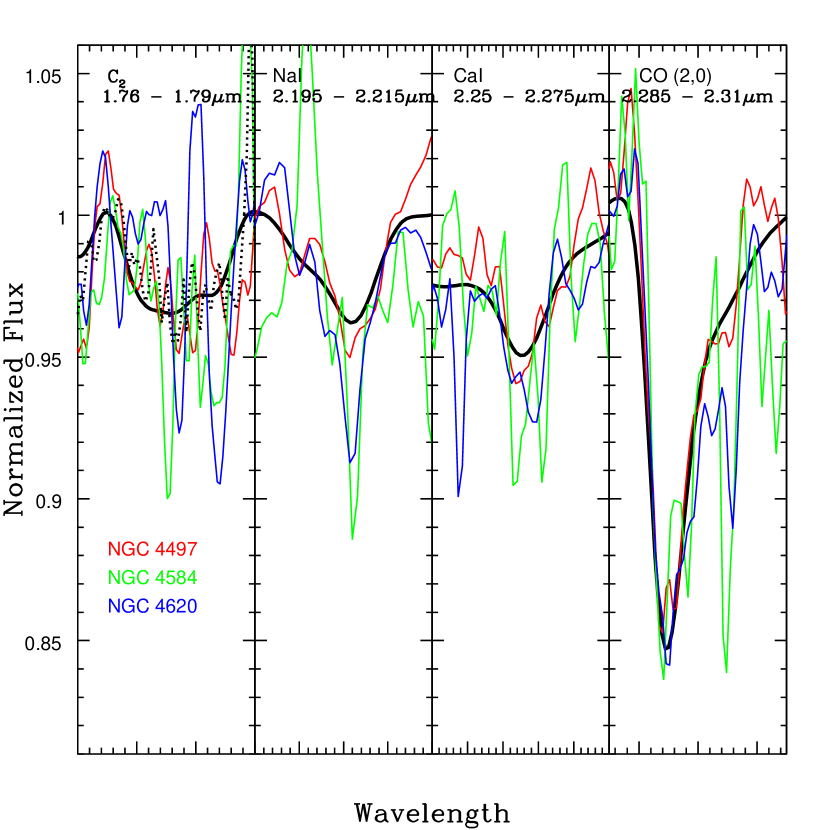
The H and Mg2 indices measured by Davidge (2018a) indicate that the luminosity-weighted ages in the central regions of these galaxies fall between 1.5 and 3 Gyr. These same data also suggest that the luminosity-weighted [M/H] range from –0.3 to just above solar. Comparisons are thus made with the 2 Gyr [M/H] = –0.25 model spectrum, and the results are shown in Figures 5 (NGC 4305, NGC 4306, NGC 4491) and 6 (NGC 4497, NGC 4584, NGC 4620). As with Figures 3 and 4, comparisons are restricted to specific features, and the impact of changes in age and/or metallicity can be assessed using the comparisons made in those figures. The CO composite feature is not included in these comparisons as its response to changes in age and metallicity was shown previously to be similar to that of CO(2,0).
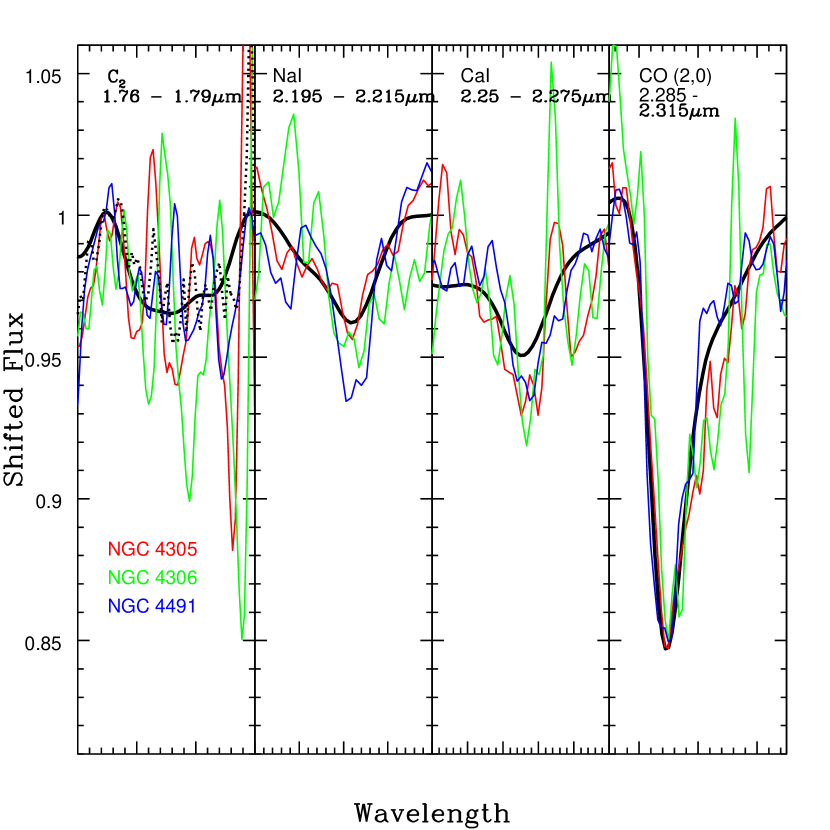
The depth of the CO(2,0) band in the spectra of most of the galaxies is consistent with that in the 2 Gyr [M/H] = –0.25 reference model. The agreement with the models in the right hand panels of Figures 5 and 6 is not perfect, as there is a tendency for the spectra of NGC 4305, NGC 4306, and NGC 4620 to fall below the reference model to the right of the band center in these figures. This wavelength region corresponds to the onset of telluric H2O absorption, and is also where the throughput of the spectrograph and the F2 HK band-limiting filter plummets. The differences between the observations and models is likely due to difficulties removing telluric absorption and identifying the pseudo-continuum in the spectra at low S/N ratios. In any event, the difference between the models and the spectra of these galaxies to the right of the CO(2,0) band is at the 1 – 2% level, and so is subtle. NGC 4491 and NGC 4497 are the brightest galaxies in our sample, and their spectra have the highest S/N ratio. The sequences for these galaxies agree with the reference model spectrum near CO(2,0) in Figures 5 and 6.
The comparisons in Figures 3 and 4 indicate that the CO(2,0) band is sensitive to both metallicity and age, and so there is an age-metallicity degeneracy if CO(2,0) is considered alone. Assuming that (1) there is not a broad galaxy-to-galaxy dispersion in luminosity-weighted age (see below), and (2) the luminosity-weighted age is Gyr, then the depth of this feature in the galaxy spectra is consistent with them having a slightly sub-solar metallicity similar to that of the reference spectrum. To the extent that the age-related assumptions hold, the agreement between the CO(2,0) depths suggests that the galaxy metallicities agree to within a few tenths of a dex, which is comparable to the scatter in central metallicities that can be deduced from the Mg2 and CaT indices (Davidge 2018a). Fraser-McKelvie et al. (2018) found that the majority of the low mass passive galaxies in their sample – all of which are in Virgo – have super-solar central metallicities. The F2 and GMOS spectra suggest that this not the case for the early-type disk galaxies studied here. The GMOS spectra are of particular significance for metallicity determinations, as they sample H and H, thereby easing any age-metallicity degeneracy.
Noise due to telluric water absorption in the wavelength interval that includes the m C2 band is clearly evident in the galaxy spectra. The noise in the rest frame m interval is smallest in the NGC 4491 Region 3 and NGC 4497 Center spectra, and there is agreement with the model spectrum at these wavelengths. While noise complicates efforts to make comparisons between the spectra of the other galaxies as well as with the models near m, there is a general tendency for the F2 spectra to agree with the reference model spectrum. To demonstrate this, the median of the continuum-corrected and normalized center spectra of all six galaxies was found, and the result is shown as a dotted line in Figures 5 and 6. There is a clear depression in the median spectrum that coincides with the expected location of the C2 band, and there is good agreement between the median galaxy and the reference model spectrum. The mean spectrum of the center of all six galaxies shows similar agreement with the reference model.
The center of NGC 4620 has a blue color (Table 1), and its spectrum is free of line emission. Given that NGC 4620 also has the deepest H index among the six galaxies and a luminosity-weighted age of 1.5 Gyr (Davidge 2018a) then it might be expected to have a deeper than average C2 band. It is thus worth noting that the C2 band in NGC 4620 is not obviously deeper than in the other galaxies, although there is considerable noise. Given the absence of line emission, it is unlikely that the depth of C2 in NGC 4620 has been diluted by nebular continuum emission.
To the extent that the models track the contribution made by cool C stars to integrated NIR light then the comparisons in Figures 5 and 6 suggest that it is unlikely that the NIR light in any of these galaxies is dominated by a component with an age younger than 1 Gyr, otherwise a much deeper C2 band would be seen. This is consistent with luminosity-weighted ages at visible/red wavelengths based on the depths of the H and H lines (Davidge 2018a). The depths of the C2 band in these spectra also do not point to a large galaxy-to-galaxy dispersion in the population of cool C stars, again with the caveat that the models are assumed to track faithfully the C star content.
There is mixed agreement between the reference model and the galaxy spectra at wavelengths that cover deep atomic features. The depth of NaIm in the spectra of NGC 4305 and NGC 4306 matches that in the reference model. In contrast, NaIm in the NGC 4491, NGC 4584, and NGC 4620 spectra is markedly deeper than in the model, even though the comparisons discussed in Section 5.1 indicate that NaIm is not sensitive to metallicity and age. While there is apparent sub-structure in the NaI features in NGC 4306 and NGC 4491, this sub-structure is illusory and is an artifact of noise. Indeed, individual NaI lines would only be resolved if the assumed spectral resolution of these observations was markedly in error, and this is unlikely given that the models reproduce the width of the CO(2,0) feature in the galaxy spectra. Spectra of selected stars from the Rayner et al. (2009) library that have different NaI depths are compared in Figure 7. Spectra with the native resolution of the Rayner et al. (2009) sample and with that of the F2 observations are shown. The NaI feature is smoothed considerably at the resolution of the F2 spectra, and it is clear that (1) the lines that make up the doublet are not resolved at R=400, and (2) the depth of the NaI feature with R=400 tracks the general behaviour seen in the R=2000 spectra. The comparisons in Figure 7 also demonstrate the sensitivity of NaIm to the presence of low mass stars at the spectral resolution of the F2 spectra.

In contrast to NaI m, there is general galaxy-to-galaxy agreement in the depth of the CaI triplet near m, although the NGC 4306 and NGC 4584 spectra are noisey at these wavelengths, qualifying conclusions about the strength of this feature in those spectra. Still, there is a tendency for the CaI feature to be deeper than predicted by the models. As with the NaI doublet, the CaI triplet is the dominant absorption feature at wavelengths near m, making it unlikely that this feature is skewed by contamination from another element. Davidge (2018a) found that metallicities estimated from the CaT index – which gauges the depth of the Ca triplet near m – tend to be lower than those estimated from Mg2, indicating that the Ca triplet lines near m are weaker than in the models. The behaviour of the CaT index is thus contrary to what might be expected based on the stronger than predicted CaIm feature in the F2 data.
6 RADIAL VARIATIONS IN STELLAR CONTENT
Davidge (2018a) found radial changes in the depths of features in the visible/red spectra of their sample of Virgo disk galaxies, indicating that the stellar content is not uniformly mixed throughout these galaxies. This is not unexpected, as population gradients are common in galaxy disks (e.g. Gonzalez Delgado et al. 2017). In addition to gradients within disks, different structural components in each galaxy are sampled along the F2 slit, and these likely have SFHs that are distinct from each other. Differences between the NIR spectra of (1) the center region and its immediate surroundings (i.e. Region 2), and (2) the area near the galaxy center and the outermost areas are examined in this section.
McDonald et al. (2009) measure the effective radii of the bulges in these galaxies, and find that they range from 3 to 9 arcsec in the band. Therefore, the comparison of light from the Center and Region 2 notionally examines differences within the bulge, and this comparison is conducted for all six galaxies. Spectroscopic gradients might be expected if there is a population gradient within the bulge, or if there is a centrally concentrated young component and/or a nuclear star cluster. Many disk galaxies contain nuclear star clusters, and these have stellar contents that may differ from their surroundings (e.g. Carollo et al. 1998; Boker et al. 2004). Nuclear clusters have globular cluster-like masses, and characteristic sizes of 2 – 5 parsecs, which corresponds to a few hundredths of an arcsec at the distance of the Virgo cluster. The closest example of a nuclear star cluster is the collection of stars around SgrA* (e.g. Schodel et al. 2014). It has not yet been determined if the Virgo galaxies studied here have nuclear clusters, although the central star-forming area in NGC 4491 may be an extreme example. While nuclear clusters in Virgo galaxies are not spatially resolved with the F2 observations, young or intermediate age nuclear clusters may still contribute significantly to the light in the central arcsec of these galaxies.
The second set of comparisons examines differences between the central regions of the galaxies and Regions 3 – 5. Regions 3 – 5 sample areas outside of the effective radii of the bulge, and so the disk contributes significantly to the integrated light. S/N considerations limit these comparisons to NGC 4491 and NGC 4497.
6.1 Comparing the Center and Region 2 Spectra
The Center and Region 2 spectra of all six galaxies have comparable S/N ratios, and the differences between the normalized spectra of these regions are examined in Figures 8, 9, and 10. The differenced spectra are in the sense Center – Region 2. The median of the continuum-corrected and normalized central spectra of the six galaxies is also shown to aid in the identification of features. Taking the median of the spectra reduces random noise while also suppressing residuals from telluric features, as these galaxies have a wide range of radial velocities. The mean of the spectra is similar to the median, and the difference between the median and mean of the six spectra has a dispersion of , which is comparable to the random noise levels in Table 2. This suggests that the median is not dominated by the spectra of the two galaxies with the highest S/N ratio: NGC 4491 and NGC 4497.
The noise in the differenced spectra in Figure 8 is typically , with the differeneced spectrum of NGC 4497 having the smallest scatter. This noise level confirms that these spectra should be capable of detecting differences in the depths of features of the size discussed in Section 5 that may result from variations in age and/or metallicity. The low frequency wave in the differenced spectrum of NGC 4305 is due to uncertainties at the few percent level in the pseudo-continuum fit. These variations in the continuum occur over wavelength scales that are much wider than those expected from individual atomic and molecular species.
Systematic residuals that coincide with the location of the Ballick-Ramsey C2 band are evident in the differenced spectra of NGC 4306 and NGC 4497. These residuals indicate that the absorption at these wavelengths is deeper in the center of NGC 4497 than in Region 2, while the opposite is true for NGC 4306. Recalling the age sensitivity of the C2 feature demonstrated in Figure 4, the behaviour of the C2 band in NGC 4497 is consistent with what might be expected from the GMOS spectra of that galaxy. In particular, Davidge (2018a) found evidence for radial age gradients in NGC 4497, in the sense of older luminosity-weighted ages at larger radii. Figures 16 and 17 of Davidge (2018a) indicate that the luminosity-weighted age of the center of NGC 4497 is 2 – 3 Gyr. The contribution made by C stars to integrated NIR light at sub-solar metallicities peaks in populations with similar ages (Maraston 2005), and so C stars might be expected near the center of NGC 4497, with a diminishing C star frequency at progressively larger radii as mean age increases.
As for NGC 4306, the detection of deeper C2 absorption in Region 2 when compared with the center is perhaps surprising. The comparisons in Figures 3 and 4 suggest that if Region 2 has a higher C star density than the center then it should also have a different age or metallicity. However, the H and H indices do not change significantly near the center of this galaxy (Figure 11 of Davidge 2018a), while the metallicity indices in this same part of NGC 4306 are also more-or-less constant. There is then no supporting evidence for differences in the luminosity-weighted age and metallicity between the Center and Region 2 of NGC 4306. Differences in angular resolution between the GMOS and F2 datasets due to seeing are one possible cause of this discrepancy.
A single emission line due to [FeII] m is seen in the differenced NGC 4491 spectrum. The n=12 Brackett transition has a wavelength that is similar to that of [FeII], and falls within the same spectral resolution element as [FeII] in these spectra. However, residuals from other Brackett lines are not seen in Figure 8, leading us to conclude that the line in question is [FeII], and not the n=12 Brackett transition. The [FeII] m emission line is a signature of SNe activity (e.g. Greenhouse et al. 1991). The presence of the [FeII] line in the differenced spectrum of NGC 4491 in Figure 8 indicates that [FeII] emission is concentrated near the center of this galaxy, even though hydrogen line emission extends into Region 2 (see below).
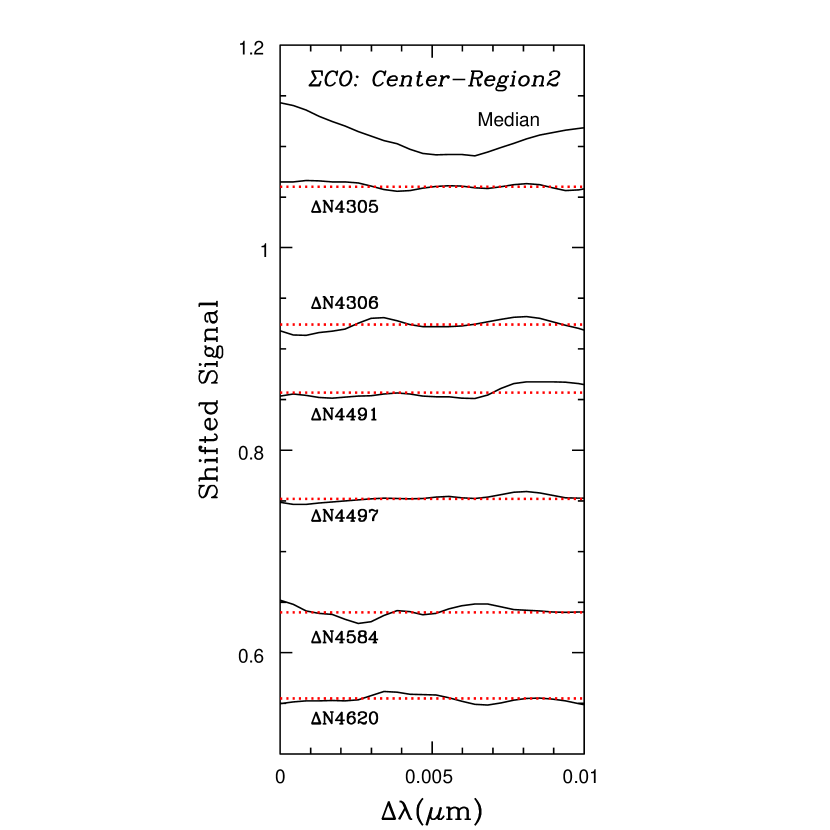
The radial behaviour of the second overtone CO bands is explored in Figure 9, where the differences between the Center and Region 2 CO features are shown. There is a dispersion of no more than in the differenced CO spectrum of each galaxy. The largest dispersion is seen in the NGC 4584 data, although this is also the spectrum that has the lowest S/N ratio. Differences in the depth of the second overtone CO bands between the Center and Region 2 are thus modest.
The differenced band Center and Region 2 spectra of each galaxy are shown in Figure 10. With the possible exception of NGC 4497, the noise in these differenced spectra has a larger amplitude than in Figure 8, reflecting the lower S/N ratio of the band spectra. The model spectra discussed in Section 5 indicate that the CO(2,0) band is sensitive to metallicity, and CO(2,0) is weaker in Region 2 than in the center of NGC 4305 and NGC 4620. This is not seen in the differenced CO spectra of these galaxies in Figure 9. There are no obvious gradients in the depths of CO(2,0) in NGC 4306, NGC 4491, NGC 4497, and NGC 4584. The absence of CO(2,0) gradients in the presence of age gradients is not unexpected unless populations with ages Gyr are involved (Figure 4). Finally, there are no obvious radial differences in NaIm and CaIm. This is not surprising given that these features are not sensitive to variations in age and metallicity (Section 5).
Br and H2 S(1) emission lines are seen in the differenced NGC 4491 spectrum in Figure 10, and these highlight the presence of a centrally-concentrated emission line region in that galaxy. There is also evidence that the line-emitting region extends beyond the Center region. In particular, the emission lines in Figure 10 are weaker than in Figure 2, as would happen if emission in Region 2 nulls out part of the signal from the emission lines when the Region 2 and Center spectra are subtracted.
The radial behaviour of the CO(2,0) feature in NGC 4491 is of interest given the evidence for a large centrally-concentrated young component in that galaxy. Despite differences in the emission line spectrum, the depths of the first overtone CO bands do not change between the Center and Region 2 in NGC 4491. This is consistent with nebular continuum emission not playing a major role in defining the depth of the CO features near the center of NGC 4491. Moreover, if the NIR light in central regions of NGC 4491 was dominated by a young component that contained a large number of red supergiants and/or a large population of stars with an age of a few hundred Myr, which might be present if the galaxy has had periodic episodes of centrally-concentrated star formation during recent epochs, then the CO(2,0) feature should be deeper than in Region 2. That this is not the case suggests that the NIR light near the center of NGC 4491 is dominated by two idealized components: (1) a young component, with an age Myr, such that luminous red supergiants have not yet formed, and (2) a population with an age like that in Region 2. Of course, additional stellar populations are almost certainly present, but with the constraint that they contribute less to the NIR light than the two components described above.
Emission lines are not present in the differenced NGC 4584 spectrum in Figure 10, confirming the observation made in Section 4 that line emission is weak or even abscent in the central NIR spectrum of that galaxy. Emission lines are present in the optical spectrum of NGC 4584, and images from the WISE All-Sky survey indicate that there is thermal emission near the center of that galaxy. The weakness or absence of emission lines in the NIR spectrum of NGC 4584 suggest that the emission in this galaxy is not powered by star formation, but could instead be due to LINER or AGN activity (e.g. Larkin et al. 1998; Lamperti et al. 2017). Kinematic measurements with sub-arcsecond angular resolution would be of interest to determine if there is evidence for a massive black hole at the center of NGC 4584.
6.2 Comparing Bulge and Disk Spectra
In Section 5 it was shown that changes in age and metallicity in old and intermediate age populations are expected to have only a modest impact on the depths of most absorption features in the m interval, making it difficult to detect changes in the strengths of features if the S/N ratio is . The spectra in Regions 3, 4, and 5 have lower S/N ratios than those in Region 2 and the Center, and low S/N ratios confound efforts to examine the spectra of NGC 4305, NGC 4306, NGC 4584, and NGC 4620 outside of Region 2. However, mean spectra of NGC 4491 and NGC 4497 with a high S/N ratio can be constructed for Regions 3 – 5, and the difference between the central spectrum of each galaxy and the mean spectrum of Regions 3 – 5 is shown in Figures 11 and 12. The differences are in the sense Center – outer region.
The low amplitude of the scatter in the differenced spectra in Figures 11 and 12 is testament to the relatively high S/N ratio of the spectra of both galaxies outside of the central few arcsec. The constancy of the CO(2,0) band in NGC 4491 between the Center and Region 2 also suggests that veiling from nebular continuum emission likely does not affect the depths of absorption features in the spectrum of that galaxy. Thus, it is likely that the absorption features in the center spectrum of NGC 4491 faithfully reflect the underlying stellar content.
Davidge (2018a) found evidence for age gradients in NGC 4491 and NGC 4497, in the sense of older luminosity-weighted ages at larger radii. There is evidence for a possible weakening of the C2 band at m in the Region 3 – 5 spectrum of NGC 4497 when compared with smaller radii, in the form of a depression at the few percent level in the differenced spectrum. The models shown in Figure 3 indicate that the observed difference is larger than what would be expected due to a metallicity gradient. The observed trend in C2 is consistent with Regions 3 – 5 in NGC 4497 containing a larger fraction of stars with ages in excess of 2 – 3 Gyr than near its center.
The differenced spectra of NGC 4491 in Figures 11 and 12 accentuate the line emission near the center of that galaxy. The emission lines in the differenced spectra of NGC 4491 in Figures 11 and 12 are more pronounced than in Figures 8 and 10, as expected if line emission is present in Region 2 (i.e. within arcsec of the galaxy center), but is weaker or abscent at larger radii. The emission line strengths in Figures 11 and 12 thus can be used to probe the nature of the line emission near the center of NGC 4491. There is no evidence for line emission in the differenced spectrum of NGC 4497.
The relative strengths of [FeII], H2 S(1), and Br in NGC 4491 are not consistent with shock excitation (e.g. line strengths discussed by Sugai et al. 1997). This being said, the agreement with photoionization models is also not ideal. Black and van Dishoeck (1987) model the strengths of H2 lines that are powered by flouresence. Considering the wavelength range sampled by F2, these models predict that the (1,0) transition of the H2 S(1) sequence near m should be the strongest H2 line, followed by the (1,0) S(0) transition. Both lines are detected in NGC 4491, and their relative strengths are more-or-less consistent with model predictions. Still, these same models also predict that the (2,1) S(1) line at m should have an amplitude that is just lower than that of the (1,0) S(0) line, and this feature is not present in the differenced NGC 4491 spectrum in Figure 12.
7 DISCUSSION & CONCLUSIONS
Long-slit NIR spectra of six early-type disk galaxies in the Virgo cluster that were recorded with the F2 imaging spectrograph on GS have been presented in this paper. These galaxies were the subject of a previous spectroscopic study at visible wavelengths by Davidge (2018a). The galaxies have band luminosities that are comparable to those of nearby late-type spiral galaxies like M33 and NGC 2403. Lisker et al. (2006a) assign these objects to their dEdi class, and identify five as dwarf S0s. While the galaxies appear to be largely devoid of cold interstellar material, NGC 4491 and NGC 4584 have emission at m that suggests there are significant amounts of hot dust in their central regions.
The spectral resolution of the F2 data is sufficient to allow features such as the C2 band at m, the CO (2,0) band head, the NaIm doublet, and the CaIm triplet to be detected, and these are used to investigate the stellar contents of these systems. The goal is not to derive independent luminosity-weighted ages and metallicities, but rather to check for consistency with properties found from the visible/red spectra. In addition, as the NIR spectra of faint objects can contain systematic residuals introduced by telluric features that can skew index measurements, the radial properties of the spectrum of each galaxy are examined in a differential manner in an effort to reduce any such systematic effects.
The study of NIR spectra is complementary to work at visible wavelengths as the mix of stellar types that dominates the NIR light differs from that at shorter wavelengths. A large fraction of the NIR light from systems with intermediate and old ages originates from luminous highly evolved stars, whereas at visible wavelengths there are significant contributions to the light from objects that span a range of evolutionary states, including the main sequence turn-off and giant branch (e.g. Figure 13 of Maraston 2005). Spectra at NIR wavelengths are also less affected by dust extinction. NIR spectra thus provide additional insights into the stellar contents and past histories of these galaxies.
The sensitivity of features in the NIR to changes in age and metallicity have been assessed using models from the EMILES compilation. These models indicate that changes in age and metallicity that are consistent with what might be expected from the examination of spectra at visible wavelengths alter the depths of features in the NIR by a few percent. NIR spectra with a S/N ratio of 50 – 100 have thus been extracted within a few arcsec of the centers of all six galaxies, while in NGC 4491 and NGC 4497 it has been possible to examine their spectra out to angular offsets that extend to roughly the half light radius.
The main conclusions of this paper are as follows:
1) The F2 spectra reveal galaxy-to-galaxy differences in stellar content that appear not to be related to age or overall metallicity. Comparisons with E-MILES models that use the BaSTI isochrones are described in Section 5, and the NaIm feature in these models is not sensitive to changes in age and overall metallicity. As the NaIm lines are not resonance transitions then this feature is likely not affected by absorption from the ISM. It is thus significant that the NaIm feature in the spectra of NGC 4491, NGC 4584, and NGC 4620 is (1) deeper than in the other three galaxies, and (2) deeper than predicted by models that assume a solar chemical mixture.
The differences in the depth of NaIm are not restricted to the centers of these galaxies. The comparisons between the Center and Region 2 spectra discussed in Section 6 suggests that the depth of Nam does not vary within the central few arcsec of these galaxies. The Region 3 spectrum of NGC 4491 was used to assess the strength of NaIm in that galaxy, further confirming that the enhanced NaIm feature is not restricted to the galaxy centers.
A property of NGC 4491, NGC 4584, and NGC 4620 that is not shared with the other galaxies is that all three have similar central colors (Table 1). While emission lines are present near the centers of NGC 4491 and NGC 4584, this is not the case for NGC 4620, although the Balmer line depths in the latter are indicative of a young age. The Sersic indices of the central regions of NGC 4584 and NGC 4620 are consistent with those of classical Sa and Sb galaxies (McDonald et al. 2011), while the other four galaxies have central Sersic indices that are appropriate for late-type systems. The interpretation of Sersic profiles in galaxies with a centrally-concentrated light profile due to a star-forming nucleus or an AGN is not clear, although a centrally-peaked light distribution will bias Sersic indices to higher values (i.e. in the sense of making them more consistent with those of classical bulges).
The discovery of galaxies with deep NaIm absorption is not new. This feature has been found to have a range of depths among galaxies, tending to be deeper than expected in many early-type galaxies if a solar chemical mixture and a solar neighborhood mass function are assumed. Rock et al. (2017) examine the strength of NaIm in early-type galaxies, and investigate models that have a non-solar [Na/Fe] and a bottom-heavy mass function. They conclude that the deep Na m lines seen in their sample are due to [Na/Fe] coupled with a possible bottom-heavy mass function. They suggest that a non-solar [C/Fe] may also contribute to deep NaIm absorption.
While NaI lines are sensitive to surface gravity, in the sense of being deepest in stars with the highest surface gravities at a fixed effective temperature, some NaI transitions are more sensitive to surface gravity than others, and this information can be used to constrain the source of the bi-modal NaIm behaviour in these galaxies. Conroy & van Dokkum (2012) discuss models that indicate that the sensitivities of NaIm to [Na/Fe] and the slope of the mass function at low masses are intermediate between those of NaD (sensitive to [Na/Fe]) and NaIm (sensitive to the mass function). If the deep NaIm features in NGC 4491, NGC 4584, and NGC 4620 are due to super-solar [Na/Fe] then the NaD lines in their spectra should be deeper than in the other galaxies. In fact, Davidge (2018a) found that the NaD lines in these three galaxies have equivalent widths that are smaller than those in the other three galaxies. However, NaD is not an ironclad probe of stellar content, as it can be affected by non-stellar sources. For example, the NaD lines are resonance transitions, and so are susceptible to absorption from interstellar material. This being said, the presence of interstellar absorption will strengthen the lines in NGC 4491, NGC 4584, and NGC 4620, and not make them weaker. It is also unlikely that interstellar absorption has deepened the NaD lines in the three galaxies in which NaIm matches the models, as these galaxies do not appear to have a significant ISM.
Aside from the potential for a contribution from the ISM, the depth of NaD is also sensitive to age. The strength of this feature in models weakens as age decreases (e.g. Figure 12 of Conroy & van Dokkum 2012), tracking the temperature of the main sequence turn-off. However, Balmer lines in the GMOS spectra are consistent with luminosity-weighted ages of Gyr, and the depth of NaD in NGC 4620 is consistent with that predicted by the models (e.g. Figure 19 of Davidge 2018a). The depth of the NaI features are also sensitive to chemical mixture (Conroy & van Dokkum 2012), with NaIm being sensitive to [C/Fe] (Rock et al. 2017). Davidge (2018a) suggested that these galaxies may have solar chemical mixtures, although the inconsistent metallicities obtained from the Mg2 and CaT indices measured by Davidge (2018a) hint that this may not hold for all elements.
The NaD lines may also be partially filled by emission from a nebular continuum. In fact, NGC 4491 and NGC 4584 both have a centrally-concentrated emission line component at visible/red wavelengths. However, NaD in NGC 4491 and NGC 4584 is more-or-less constant with radius (e.g. Figure 14 of Davidge 2018a). If NaD near the galaxy center was affected by a nebular continuum or the presence of young stars then NaD would deepen towards larger radii, and such a trend is not seen. As for NGC 4620, there are no emission lines in its spectrum, and NaD also does not vary with radius. NaIm does not vary between the Center and Region 2 in any of these galaxies, while NaIm in NGC 4491 is deeper than predicted by the models in Region 3, which is outside of the central star-forming region.
The problems with the depth of NaD notwithstanding, any mechanism that involves Na enhancement to explain the deeper than expected NaIm lines found here must do so over a large spatial scale, and not just over a localized part of these galaxies. Na is produced in high temperature conditions, such as in Type II supernovae (SNeII) and in massive AGB stars during hot bottom burning (HBB). Na can be either formed or destroyed during HBB, depending on the temperature at the bottom of the convective envelope (e.g. Ventura & D’Antona 2011). A problem with producing large-scale Na enrichment with AGB stars is then that a remarkably fine-tuned mass function that favors the progenitors of only very massive AGB stars is required.
Kobayashi et al. (2006) examine the chemical enrichment of elements produced by massive stars. The production of Na with respect to other elements climbs with progenitor mass among stars with a solar metallicity, and a similar trend is seen for Al. Na (and Al) enrichment might then result from a mass function that favors very massive stars. Super massive stars (SMSs) are then one conjectural means of producing large-scale Na enrichment during early epochs. SMSs are proposed to form in deep potential wells with high gas accretion rates where runaway stellar collisions occur (Gieles et al. 2018), presumably during very early epochs. Denissenkov & Hartwick (2014) discuss SMSs as a possible source of chemical abundance trends among stars in globular clusters, and find good agreement between observed and modelled abundance ratios. Their models reproduce the [Na/Fe] [O/Fe] anticorrelation seen in globular clusters. However, it is not clear if such a mechanism could produce sufficient quantities of Na that must then be distributed over large spatial scales.
Taken at face value, the relative strengths of the NaD lines suggest that the deep NaIm lines in NGC 4491, NGC 4584, and NGC 4620 are likely a consequence of a bottom-heavy mass function, rather than a super-solar Na abundance. Such a mass function is unexpected in light of the relation between velocity dispersion and mass function exponent that has been found among early-type galaxies (e.g. Rosani et al. 2018, Spiniello et al. 2014, Conroy et al. 2013, Cappellari et al. 2013, Ferreras et al. 2013). However, the alternative of proposing a Na enhancement in NGC 4491, NGC 4584, and NGC 4620 has difficulties given the relative depths of NaD in the six galaxies. Other spectroscopic features will provide additional insights into the mass function of these galaxies. For example, the NaIm doublet is sensitive to surface gravity. While the spectra discussed by Davidge (2018a) cover this wavelength region, the spectral resolution is too low to allow meaningful constraints to be drawn, and observations of these galaxies at spectral resolutions in excess of 1000 would be of interest to measure the depth of this feature. A study of the NaIm line in all six galaxies would also be of interest to further constrain the contribution made by low mass stars to the NIR light. Finally, the AlIm feature is also of interest, as Al has a nucleosynthesis pedigree that is similar to that of Na in massive stars – if Na is enhanced then this might also be reflected in the depths of Al lines.
2) The NIR spectra indicate that the ionizing radiation that causes the emission in the central regions of NGC 4491 and NGC 4584 may originate from very different sources. The spectra of NGC 4491 and NGC 4584 have prominent emission lines at visible wavelengths (Davidge 2018a), and these galaxies have similar central colors (Table 1). These are also the only two galaxies to be detected in WISE W4 images. Despite these similarities, the NIR spectra of NGC 4491 and NGC 4584 are very different: whereas there are emission lines in the NIR spectrum of NGC 4491, no emission lines are detected in the NIR spectrum of NGC 4584.
The relative strengths of the H2 (1–0) S(1) and Br lines in NGC 4491 are consistent with those found in star-forming galaxies, although the non-detection of the (2,1) S(1) H2 line is a possible problem (Section 6). As for the center of NGC 4584, the absence of NIR emission in that galaxy could signal an excitation mechanism that is not related to star formation, such as an AGN. The wavelength coverage and spectral resolution of the GMOS spectra discussed by Davidge (2018a) are such that excitation diagnostics like [OII]3727 and [NII]6563 (e.g. Baldwin, Phillips, & Terlevich 1981) can not be measured from those data. Visible and red spectra of NGC 4584 with broader wavelength coverage and higher spectral resolution would thus be useful to further examine the excitation mechanism in that galaxy. Images and spectra of NGC 4584 that have sub-arcsec angular resolution will also provide a direct means of determining the angular extent of the emission. We note that NGC 4584 is not barred.
3) The NIR spectra are consistent with the center of NGC 4491 being an extreme star-forming environment. The m [FeII] emission in the NIR spectrum is an indicator of a high level of supernovae activity, the progenitors of which were likely massive, hot stars. If confirmed by spectra with a higher S/N ratio, then the presence of HeI emission near m would suggest that there may be a population of extremely hot stars, including Wolf-Rayet stars, near the center of NGC 4491. A large population of hot stars is consistent with the dust temperature of NGC 4491 estimated by Auld et al. (2013), which is the highest among galaxies examined in the Herschel Virgo Cluster Survey. The MIR SED of NGC 4491 in the NASA Extragalactic Database 101010http:ned.ipac.caltech.edu is similar to that of NGC 5253, a nearby dwarf galaxy that harbors vigorous on-going star formation (e.g. Alonso-Herrero et al. 2004).
The evidence for concentrated central star formation notwithstanding, NGC 4491 is not unique among early-type galaxies in cluster environments, and we suggest that it may be related to the MIR enhanced galaxies (MIREGs) identified in the Virgo and Coma clusters by Riguccini et al. (2015). The SEDs and locations of MIREGs in the outer regions of both clusters suggest that they may be experiencing an episode of intense star formation after falling into the cluster environment. Of the three MIREG galaxies found in Virgo, the integrated brightness and color of one – NGC 4344 – are comparable to those of NGC 4491. The ratio of IRAS m to band flux in NGC 4491 is that in NGC 4344, suggesting that NGC 4491 may be a more extreme MIREG than NGC 4344. This might be a consequence of the location of NGC 4491 within Virgo; unlike the majority of MIREGs, NGC 4491 has a projected location on the sky that is relatively close to M87 (Table 1). While the projected location of an object in a three-dimensional structure is not a certain indicator of its physical location within that structure, the lower-than-average radial velocity of NGC 4491 in Table 1 suggests that its orbit may have been dynamically processed by the cluster environment, perhaps due to an interaction with a much larger system. Such an interaction could have triggered the central star formation seen today.
NGC 4491 was not considered by Riguccini et al. (2015) in their census of MIREGs because of its morphological classification. The sample of objects examined by Riguccini et al (2015) drew on that discussed by Temi et al. (2009), who selected galaxies of type E and S0 as assigned by Bingelli et al. (1985). As noted in Table 1, NGC 4491 was assigned type SBa(s) by Bingelli et al. (1985). However, that Lisker et al. (2006a) conclude that NGC 4491 is a dwarf S0 re-opens the possibility of considering it as a MIREG.
The nature of MIREGs notwithstanding, a nucleus with an elevated SFR may not on its own indicate that a galaxy is a recent addition to Virgo. The depth of Balmer absorption lines outside of the central regions of 4491 is consistent with a relatively old age (e.g. Figure 16 of Davidge 2018b). That there is no evidence for a large intermediate age population in the disk of NGC 4491 suggests that any on-going star formation has been at a low enough level so as not to dominate the integrated light at visible wavelengths, although a young frosting of stars is present in many early-type galaxies (e.g. Trager et al. 2000; Ford & Bregman 2013). This leads us to suggest that the recent star formation near the center of NGC 4491 may be a spatially isolated event, perhaps akin to what is seen in the centers of nearby spiral galaxies (e.g. Davidge & Courteau 2002; Georgiev & Boker 2014), dwarf lenticulars (e.g. Seth et al. 2010; Davidge 2015a), and dwarf galaxies in Virgo (Cote et al. 2006).
4) The stellar contents in the central regions of the galaxies are not tied to the presence of a bar at the present day. Intermediate mass disk galaxies like those studied here are susceptible to bar instabilities, and bars can form and buckle throughout their lifetimes (e.g. Kwak et al. 2017). As the current sample consists of early-type disk galaxies then there might be a bias towards galaxies that had a bar in the past but that has since buckled to form a pseudo-bulge. Indeed, despite having early-type morphologies (Table 1), NGC 4305, NGC 4306, NGC 4491, and NGC 4497 have central Sersic profiles that are not consistent with those expected for classical bulges (McDonald et al. 2011).
A connection between the central SFR and a bar might be expected in a galaxy that contains large quantities of cool gas in the disk, as a bar can channel that gas into the central regions, which in turn could result in central star formation. While three of the six galaxies have a bar (NGC 4306, NGC 4491, and NGC 4497), the central stellar contents of these objects are diverse. NGC 4491 shows evidence of on-going central star formation, while Davidge (2018a) found that NGC 4497 has the oldest luminosity-weighted age of the six galaxies.
While star formation might be sustained near the geometric center of a bar due to gas deposition, bars also play a role in suppressing star formation in disks. Observational evidence for a bar-related decrease in the disk SFR comes from the red colors of barred spiral galaxies (e.g. Vera et al. 2016). Fraser-McKelvie et al. (2018) find that passive spiral galaxies have a higher bar frequency than star-forming spirals, while James & Percival (2018) find that the area swept by bars tends to be devoid of recent star formation. Khoperskov et al. (2018) simulate the effect of bars on gas disks, and find that the SFR in their models drops after bar formation. This drop in the SFR occurs because the bar increases turbulence in the disk, heating the gas and thereby hindering fragmentation and collapse. This bar-driven turbulence enlarges the vertical extent of the gas disk in these models, but the gas is not lost from the galaxy unless it is removed by some other mechanism, such as tidal interactions or ram pressure.
5) The wavelength region near m in the galaxy rest frame covers the Ballick-Ramsey C2 band and is reproduced by the E-MILES models that are based on the BaSTI isochrones with a scaled-solar chemical mixture. This agreement is worth noting given the uncertainties in the physics used to model the structure of stars in advanced stages of evolution and the contribution that they make to the spectra. These uncertainties affect the predicted incidence of highly evolved AGB stars and/or their spectroscopic characteristics in models of integrated light. This being said, with the possible exception of NGC 4491, the spectra are noisey at the wavelengths in question. Observations made from a drier site, where H2O absorption is less of a factor and more stable with time, should yield spectra at these wavelengths with lower noise levels.
Zibetti et al. (2013) examined the NIR spectra of a sample of post-starburst galaxies to search for spectroscopic signatures of C stars. The galaxies in their sample are at redshift 0.2, and so the m C2 band is redshifted into the band, where it is less affected by deep telluric H2O absorption. Zibetti et al. (2013) do not detect deep C2 features, even though these galaxies were selected to be sites of recent large-scale star formation. However, the S/N ratio of their spectra are such that absorption near rest frame m with a depth like that seen in the present sample of Virgo galaxies would likely not be detected.
6) The depths of the first overtone CO bands are consistent with the galaxies having similar luminosity-weighted metallicities. The models discussed in Section 5 indicate that the depths of the CO bands are subject to an age-metallicity degeneracy. However, this is a concern only for systems with ages that are ruled out in the current sample of galaxies based on the depth of Balmer lines at visible and red wavelengths; hence, the main driver of the depth of the first overtone CO bands in these galaxies is probably metallicity. The uniform depths of the CO(2,0) band head is more-or-less consistent with the modest scatter in [Fe/H] found by Davidge (2018a) in the central regions of these galaxies. We do not find evidence for super-solar luminosity-weighted central metallicities.
7) There is galaxy-to-galaxy agreement in the depth of the CaIm triplet, which is uniformly deeper than predicted by the reference model. The models discussed in Section 5 indicate that the depth of CaIm is slightly sensitive to variations in age, in the sense of becoming deeper for ages Gyr, and this is likely a surface gravity effect. However, an age difference with respect to the reference model is likely not an explanation for the depth of CaIm in the galaxy spectra, as the depths of Balmer lines at visible wavelengths and the depth of the C2 band point to luminosity-weighted ages that more-or-less agree with that of the reference model. Ca is an element, and the difference in the depth of the CaIm feature with respect to the reference model might instead point to a non-solar chemical mixture in these galaxies.
We close the paper by re-visiting the evolutionary status of the galaxies in light of information gleaned from the F2 spectra. Davidge (2018a) suggested that these galaxies likely formed as late-type spirals in a low density environment, and that they were stripped of gas after falling into the cluster. Pseudo-bulges would have presumably formed following the formation and collapse of bars, although the inner region light profiles of two of the galaxies – NGC 4584 and NGC 4620 – can be fit with Sersic indices that are suggestive of classical bulges. The entry into the cluster environment occured only after a stable disk had formed that had had time to experience substantial chemical evolution.
The evolutionary scheme described by Davidge (2018a) relies on the presence of fossil disks, that are now largely devoid of the recent large-scale star formation that is characteristic of a late-type spiral galaxy. Such disks are clearly present in the galaxies studied here. Another characteristic that is consistent with an external formation model is the chemical mixture, which Davidge (2018a) found to be near-solar. A solar abundance mixture indicates that a system was able to retain star-forming material long enough for SNe I to enrich the interstellar material and form a large population of stars (i.e. Gyr) – gas removal did not happen suddenly after the disks formed. While the CaIm feature appears to be deeper than predicted by the models, thereby suggesting a non-solar chemical mixture, the galaxy-to-galaxy agreement in the depth of this feature is consistent with a common Ca abundance among the galaxies.
The galaxies studied here have similar red colors and integrated brightnesses, although the former is partly a selection effect due to their early-type morphologies. The spectroscopic properties of these galaxies at visible wavelengths indicate that there is a modest dispersion in luminosity-weighted age and metallicity, as might be expected for galaxies evolving in a dense cluster that has accreted galaxies over a range of epochs. Still, the NIR spectra contain clues that the six galaxies may not have stellar contents that differ solely due to variations in luminosity-weighted age and metallicity, and so may not share a common pedigree. The detection of deep NaIm in three of these galaxies argues that their stellar contents differ from those in the majority of late-type disk galaxies. Based on the strengths of NaD absorption, a bottom-heavy mass function in NGC 4491, NGC 4584, and NGC 4620 is favored to explain the depths of NaIm in these galaxies. To date, bottom-heavy mass functions have been found in massive galaxies in cluster environments (e.g. Rosani et al. 2018, Spiniello et al. 2014; Conroy et al. 2013; Cappellari et al. 2013; Ferreras et al. 2013). However, there are hints that factors other than total mass may be at play, as Zieleniewski et al. (2017) find a range of mass functions in bright Coma cluster galaxies, while Meyer et al. (2019) find a solar neighborhood-like mass function in the lenticular/elliptical galaxy M85, which is on the periphery of the Virgo cluster and is more massive than the galaxies studied here. We speculate that any diversity in NaIm characteristics among the six galaxies in this sample may reflect differences in their formation environment, perhaps related to the sub-structure within the Virgo cluster (e.g. Bohringer et al. 1994).
Fraser-McKelvie et al. (2018) discuss quenching mechanisms in passive spiral galaxies. The low mass part of their sample consists exclusively of disk galaxies in Virgo, and includes NGC 4305. They conclude that these galaxies have relatively young luminosity-weighted ages and super-solar metallicities. They further suggest that these galaxies entered Virgo 1 – 2 Gyr in the past, and that star formation was quenched by ram pressue stripping or by strangulation of the gas supply. A cautionary note is that the Fraser-McKelvie et al. spectra cover only the central regions of each galaxy, and the GMOS and F2 long slit spectra indicate that the central properties of disk galaxies are not proxies for the rest of the galaxy.
Gradients in luminosity-weighted age found at visible wavelengths provide clues into how long the galaxies might have been evolving in a cluster environment. The age gradients found by Davidge (2018a) are in the opposite sense to those seen in late type disk galaxies, where the fractional contribution of younger stars increases towards larger radii (e.g. Gonzalez-Delgado et al. 2017). The radial age trend found by Davidge (2018a) is consistent with star formation being quenched first at large radius and then with quenching moving progressively inwards in all six galaxies. Such a trend might result from the initial removal of gas in areas where it is least tightly bound to the galaxy - the low density outer regions - before gas is stripped from denser regions. The ages estimated by Davidge (2018a) at the largest angular offsets from the galaxy centers indicate that large-scale star formation ceased many Gyr in the past, although it should be recalled that luminosity-weighted ages have been measured here, and these provide only loose constraints on when large-scale star formation last occured. Still, the age gradients in these galaxies indicate that the time scale for the suppression of star formation likely spanned several Gyr. This is consistent with the quenching time scale for anemic disk galaxies in general (Schawinski et al. 2014).
Ruggiero & Lima Neto (2017) simulate the evolution of galaxies in cluster environments, and find that if there is a kinematically cool cluster core then galaxies with a Milky Way-like mass can be stripped of gas in a single cluster crossing time. In contrast, multiple passes are required to strip gas in a cluster that lacks a cool core, such as Virgo. Thus, if the present-day properties of the early-type disk galaxies discussed here are due to the removal of gas by the cluster environment then they may have been in the Virgo cluster for multiple crossing times. This corresponds to at least a few Gyr given the radial extent of the cluster and the typical velocities of its member galaxies (e.g. Tully & Shaya 1984). A timescale for gas removal of a few Gyr is consistent with the luminosity-weighted ages estimated by Davidge (2018a) from Balmer lines at intermediate radii.
The radial age trends could be driven by mechanisms other than the stripping and/or disruption of the gas supply due to the cluster environment. For example, the gas in a spiral galaxy that is on its first pass through a cluster will likely be compressed by the intergalactic medium, and large-scale star formation might ensue. A large fraction of the gas in such a galaxy might then be consumed by star formatio, which might be quenched by the removal of gas by winds and/or the formation of a bar. Such star-forming activity in starburst galaxies typically dies out first at large radii, and then shrinks in size, with the last vestages of elevated activity occuring near the galaxy center (e.g. Soto & Martin 2010). Observations of low mass galaxies suggest that elevated levels of star formation persist for at least a few hundred Myr to more than a Gyr (e.g. McQuinn et al. 2010). The result will be an age gradient with the oldest luminosity-weighted ages at large radii, as is seen here. As with ram stripping, the hypothesized star burst and subsequent quenching of star formation would have commenced many Gyr in the past to produce the luminosity-weighted disk ages found here.
A potential problem with starbursts as a driver of gas exhaustion is that while starburst activity is seen in some Virgo spirals (Koopman & Kenney 2004a), it is not common (e.g. Crowl & Kenney 2008). Moreover, if starburst activity were the cause of radial trends in these galaxies then a population of starbursting dEs might also be expected to be found in Virgo. While we are not aware of such a population, there are dEs that harbor blue cores that are attributed to recent star formation, much like in NGC 4491. These objects account for 15% of the brightest dEs, and have morphological characteristics that are reminiscent of thick disks (Lisker et al. 2006b), suggesting a possible connection to the galaxies studied here. Evidence for large-scale star formation at larger radii is lacking in those objects, suggesting that they are not post-starburst systems. This is consistent with their nuclear star formation being triggered by some other process.
Establishing the SFHs of the disks during intermediate epochs will provide direct constraints on when these galaxies first entered a cluster environment and experienced the events that subsequently shaped their evolution. A study of the resolved stellar contents of these systems would be of particular interest. Simulations discussed by Schreiber et al. (2014) indicate that it should be possible to resolve individual RGB and AGB stars in Virgo galaxies using adaptive optics systems mounted on the next generation of very large optical/NIR telescopes, and the resulting color-magnitude diagrams could be used to place constraints on their SFHs. A caveat is that while the identification of epochs with elevated SFRs is of obvious interest, such events may not always be due to cluster-driven evolution. For example, the SFRs in the disks of ‘typical’ spiral galaxies experienced a rejuventation Gyr in the past (Gonzalez-Delgado et al. 2017). If the galaxies entered the Virgo environment since that time then evidence for an uptick in the SFR Gyr ago might then be a relic of their evolution prior to entering the cluster.
References
- (1)
- (2) Alonso-Herrero, A., Takagi, T., Baker, A. J., Rieke, G. H., Rieke, M. J., Imanishi, M., Scoville, N. Z. 2004, ApJ, 612, 222
- (3)
- (4) Baillard, A., Bertin, E., de Lapparent, V., et al. 2011, A&A, 532, 74
- (5)
- (6) Baldwin, J. A., Phillips, M. M., & Terlevich, R. 1981, PASP, 93, 5
- (7)
- (8) Bamford, S. P., Nichol, R. C., Baldry, I. K., et al. 2009, MNRAS, 393, 1324
- (9)
- (10) Barway, S., Wadedekar, Y., Vaghmare, K., & Kembhavi, A. K. 2013, MNRAS, 432, 430
- (11)
- (12) Battinelli, P., & Demers, S. 2005, A&A, 434, 657
- (13)
- (14) Binggeli, B., Sandage, A., & Tammann, G. A. 1985, AJ, 90, 1681
- (15)
- (16) Binggeli, B., Tammann, G. A., & Sandage A. 1987, AJ, 94, 251
- (17)
- (18) Black, J. H., & van Dishoeck, E. F. 1987, ApJ, 322, 412
- (19)
- (20) Boker, T., Sarzi, M., McLaughlin, D. E., van der Marel, R. P., Rix, H-W, Ho, L. C., & Shields, J. C. 2004, AJ, 127, 105
- (21)
- (22) Bohringer, H., Briel, U. G., Schwarz, R. A., Voges, W., Hartner, G., & Trumper, J. 1994, Nature, 368, 828
- (23)
- (24) Boselli, A., & Gavazzi, G. 2006, PASP, 118, 517
- (25)
- (26) Boselli, A., Fossati, M., Longobardi, A., et al. 2020, A&A, 634, L1
- (27)
- (28) Bowen, G. H., & Willson, L. A. 1991, ApJ, 375, L53
- (29)
- (30) Butcher, H., Oemler, A. Jr 1984, ApJ, 285, 426
- (31)
- (32) Byler, N., Dalcanton, J. J., Conroy, C., & Johnson, B. D. 2017, ApJ, 840, 44
- (33)
- (34) Cappellari, M., McDermid, R. M., Alatalo, K. et al. 2013, MNRAS, 432, 1862
- (35)
- (36) Carollo, M., Stiavelli, M., & Mack, J. 1998, AJ, 116, 68
- (37)
- (38) Chabrier, G. 2001, ApJ, 554, 1274
- (39)
- (40) Cordier, D., Pietrinferni, A., Cassisi, S., & Salaris, M. 2007, AJ, 133, 468
- (41)
- (42) Choi, J., Conroy, C., Moustakas, J., et al. 2014, ApJ, 792, 95
- (43)
- (44) Conroy, C., & van Dokkum, P. 2012, ApJ, 747, 69
- (45)
- (46) Conroy, C., Dutton, A., Graves, G. J., Mendel, J. T., van Dokkum, P. G. 2013, ApJ, 776, L26
- (47)
- (48) Conroy, C., Villaume, A., van Dokkum, P. G., & Lind, K. 2018, ApJ, 854, 139
- (49)
- (50) Cordier, D., Pietrinferni, A., Cassisi, S., & Salaris, M. 2007, AJ, 133, 468
- (51)
- (52) Côté, P., Piatek, S., Ferrarese, L., et al. 2006, ApJS, 165, 57
- (53)
- (54) Crowl, H. C., & Kenney, J. D. P. 2008, AJ, 136, 1623
- (55)
- (56) Dahmer-Hahn, L. G., Riffel, R., Rodriguez-Ardila, A., et al. 2018, MNRAS, 476, 4459
- (57)
- (58) Davidge, T. J., 1990, AJ, 99, 561
- (59)
- (60) Davidge, T. J., 1992, AJ, 103, 1512
- (61)
- (62) Davidge, T. J., 2014, ApJ, 791, 66
- (63)
- (64) Davidge, T. J., 2015a, ApJ, 799, 97
- (65)
- (66) Davidge, T. J., 2015b, ApJ, 811, 133
- (67)
- (68) Davidge, T. J., 2016, ApJ, 818, 142
- (69)
- (70) Davidge, T. J., 2018a, AJ, 156, 233
- (71)
- (72) Davidge, T. J., 2018b, RNAAS, 2, A206
- (73)
- (74) Davidge, T. J., 2019, AJ, 158, 90
- (75)
- (76) Davidge, T. J., & Courteau, S. 2002, AJ, 123, 1438
- (77)
- (78) De Lucia, G., Weinmann, S., Poggianti, B. M., Aragon-Salamanca, A., & Zaritsky, D. 2012, MNRAS, 423, 1277
- (79)
- (80) Denissenkov, P. A., & Hartwick, F. D. A. 2014, MNRAS, 437, L21
- (81)
- (82) Dressler, A. 1980, ApJ, 236, 351
- (83)
- (84) Dressler, A., Oemler, A. Jr., Couch, W. J., et al. 1997, ApJ, 490, 377
- (85)
- (86) Eikenberry, S., Elston, R., Raines, S. N., et al. 2004, Proc. SPIEE, 5492, 1196
- (87)
- (88) Ferreras, I., La Barbera, F., de La Rosa, I. G., Vazdekis, A., de Carvalho, R. R., Falcon-Barroso, J., & Ricciardelli, E. 2013, MNRAS, 429, L15
- (89)
- (90) Ford, H. A., & Bregman, J. N. 2013, ApJ, 770, 137
- (91)
- (92) Fossati, M., Gavazzi, G., Savorgnan, G., et al. 2013, A&A, 553, A91
- (93)
- (94) Fraser-McKelvie, A., Brown, M. J. I., Pimbblet, K., Dolley, T., & Bonne, N. J. 2018, MNRAS, 474, 1909
- (95)
- (96) Gallazzi, A., Charlot, S., Brinchmann, J., White, S. D. M., & Tremonti, C. A. 2005, MNRAS, 362, 41
- (97)
- (98) Geargiev, I. V., & Boker, T. 2014, MNRAS, 441, 3570
- (99)
- (100) Gieles, M., Charbonnel, C., Krause, M. G. H., et al. 2018, MNRAS, 478, 2461
- (101)
- (102) Giradi, L., Bressan, A., Bertelli, F., & Chiosi, C. 2000, A&AS, 141, 371
- (103)
- (104) Gonzalez Delgado, R. M., Perez, E., Cid Fernandes, R., et al. 2017, A&A, 607, A128
- (105)
- (106) Goddard, D., Thomas, D., Maraston, C., et al. 2017, MNRAS, 466, 4731
- (107)
- (108) Greenhouse, M. A., Woodward, C. E., Thronson Jr, H. A., Rudy, R. J., Rossano, G. S., Erwin, P., & Puetter, R. C. 1991, ApJ, 383, 164
- (109)
- (110) Groenewegen, M. A. T., & Sloan, G. C. 2018, A&A, 609, A114
- (111)
- (112) Grootes, M. W., Tuffs, R. J., Popescu, C. C., et al. 2017, AJ, 153, 111
- (113)
- (114) Gunn, J. E., & Gott, J. R. I. 1972, ApJ, 176, 1
- (115)
- (116) Hogg, D. W., Blanton, M. R., Brinchmann, J., et al. 2004, ApJ, 601, L29
- (117)
- (118) Hou, A., Parker, L. C., & Harris, W. E. 2014, MNRAS, 442, 406
- (119)
- (120) James, P. A., & Percival, S. M. 2018, MNRAS, 474, 3101
- (121)
- (122) Jarrett, T. H., Chester, T., Cutri, R., Schneider, S. E., & Huchra, J. P. 2003, AJ, 125, 525
- (123)
- (124) Karachentsev, I. D., Makarova, L. N., Tully, R. B., Rizzi, L., & Shaya, E. J. 2018, ApJ, 858, 62
- (125)
- (126) Kauffmann, G., White, S. D. M., Heckman, T. M., et al. 2004, MNRAS, 353, 713
- (127)
- (128) Khoperskov, S., Haywood, M., Di Matteo, P., Lehnert, M. D., & Combes, F. 2018, A&A, 609, A60
- (129)
- (130) Kim, S., Rey, S.-C., Bureau, M., et al. 2016, ApJ, 833,207
- (131)
- (132) Kim, S., Jeong, H., Lee, J., Lee, Y., Joo, S-J, Kim, H-S, & Rey, S-C 2018, ApJ, 860, L3
- (133)
- (134) Kobayashi, C., Umeda, H., Nomoto, K., Tominaga, N., & Ohkubo, T. 2006, ApJ 653, 1145
- (135)
- (136) Koopmann, R. A., & Kenney, J. D. P. 1998, ApJ, 497, L75
- (137)
- (138) Koopmann, R. A., & Kenney, J. D. P. 2004a, ApJ, 613, 851
- (139)
- (140) Koopmann, R. A., & Kenney, J. D. P. 2004b, ApJ, 613, 866
- (141)
- (142) Koopmann, R. A., Haynes, M. P., & Catinella, B. 2006, AJ, 131, 716
- (143)
- (144) Kwak, S., Kim, W.-T., Rey, S. C., & Kim, S. 2017, ApJ, 839, 24
- (145)
- (146) Kwak, S., Kim, W.-T., Rey, S. C., & Quinn, T. R. 2019, ApJ, 887, 139
- (147)
- (148) Lamperti, I., Koss, M., Trakhtenbrot, B., et al. 2017, MNRAS, 467, 540
- (149)
- (150) Larkin, J. E., Armus, L., Knop, R. A., Soifer, B. T., & Matthews, K. 1998, ApJS, 114, 59
- (151)
- (152) Lee, M. G., Kim, M., Sarajedini, A., Geisler, D., & Gieren, W. 2002, ApJ, 565, 959
- (153)
- (154) Li, H., Mao, S., Cappellari, M., et al. 2018, MNRAS, 476, 1765
- (155)
- (156) Lisker, T., Grebel, E. K., & Binggeli, B. 2006a, AJ, 132, 497
- (157)
- (158) Lisker, T., Glatt, K., Westera, P., Grebel, E. K. 2006b, AJ, 132, 2432
- (159)
- (160) Magrini, L., Coccato, L., Stanghellini, L., Casasola, V., & Galli, D. 2016, A&A, 588, A91
- (161)
- (162) Maraston, C. 2005, MNRAS, 362, 799
- (163)
- (164) Masters, K. L., Mosleh, M., Romer, A. K., et al. 2010, MNRAS, 405, 783
- (165)
- (166) McDonald, M., Courteau, S., & Tully, R. B. 2009, MNRAS, 393, 628
- (167)
- (168) McDonald, M., Courteau, S., Tully, R. B., & Roediger, J. 2011, MNRAS, 414, 2015
- (169)
- (170) McGee, S., Balogh, M. L., Bower, R. G., Font, A. S., & McCarthy, J. G. 2009, MNRAS, 400, 937
- (171)
- (172) McQuinn, K. B. W., Skillman, E. D., Cannon, J. M., et al. 2010, ApJ, 724, 49
- (173)
- (174) Mei, S., Blakeslee, J. P., Côt’̂, P., et al. 2007, ApJ, 655, 144
- (175)
- (176) Meneses-Goytia, S., Peletier, R. F., Trager, S. C., & Vazdekis, A. 2015, A&A, 582, A97
- (177)
- (178) Meyer, R. E., Sivanandam, S., Moon, D-S. 2019, ApJ, 875, 151
- (179)
- (180) Miner, J., Rose, J. A., & Cecil, G. 2011, ApJ, 727, L15
- (181)
- (182) Moore, B., Katz, N., Lake, G., Dressler, A., & Oemler, A. Jr. 1996, Nature, 379, 613
- (183)
- (184) Pietrinferni, A, Cassisi, S., Salaris, M., & Castelli, F. 2004, ApJ, 612, 168
- (185)
- (186) Pilkington, K., Few, C. G., Gibson, B. K., et al. 2012, A&A, 540, A56
- (187)
- (188) Postman, M., & Geller, M. J. 1984, ApJ, 281, 95
- (189)
- (190) Puxley, P. J., Hawarden, T. G., & Mountain, C. M. 1990, ApJ, 364, 77
- (191)
- (192) Rayner, J. T., Cushing, M. C., & Vacca, W. D. 2009, ApJS, 185, 289
- (193)
- (194) Riguccini, L., Temi, P., Amblard, A., Fanelli, M., & Brighenti, F. 2015, ApJ, 810, 138
- (195)
- (196) Rock, B., Vazdekis, A., Ricciardelli, E., Peletier, R. F., Knapen, J. H., & Falcon-Barroso, J. 2016, A&A, 589, 73
- (197)
- (198) Rock, B., Vazdekis, A., La Barbera, F., Peletier, R. F., Knapen, J. H., Allende-Prieto, C., & Aguado, D. S. 2017, MNRAS, 472, 361
- (199)
- (200) Roediger, J. C., Courteau, S., Sanchez-Blazquez, P., & McDonald, M. 2012, ApJ, 758, 41
- (201)
- (202) Rosani, G., La Barbera, F., Ferreras, J., & Vazdekis, A. 2018, MNRAS, 476, 5233
- (203)
- (204) Roskar, R., Debattista, V. P., Quinn, T. R., Stinson, G. S., & Wadsley, J. 2008, ApJ, 684, L79
- (205)
- (206) Rudnick, G., Jablonka, P., Moustakas, J., et al. 2017, ApJ, 850, 181
- (207)
- (208) Ruggiero, R., & Lima Neto, G. B. 2917, MNRAS, 468, 4107
- (209)
- (210) Saviane, I., Ivanov, V. D., Held, E. V., Alloin, D., Rich, R. M., Bresolin, F., & Rizzi, L. 2008, A&A, 487, 901
- (211)
- (212) Schawinski, K., Urry, C. M., Simmons, B. D., et al. 2014, MNRAS, 440, 889
- (213)
- (214) Schodel, R., Feldmeier, A., Kunneriath, D., Stolovy, S., Neumayer, N., Amaro-Seoane, P., & Nishiyama, S. 2014, A&A, 566, A47
- (215)
- (216) Schreiber, L., Greggio, L., Falomo, R., Fantinel, D., & Uslenghi, M. 2014, MNRAS, 437, 2966
- (217)
- (218) Seth, A. C., Cappellari, M., Neumayer, N., et al. 2010, ApJ, 714, 713
- (219)
- (220) Skillman, E. D., Kennicutt Jr, R. C., Shields, G. A., & Zaritsky, D. 1996, ApJ, 462, 147
- (221)
- (222) Sorce, J. G., Courtois, H. M., Tully, R. B., et al. 2013, ApJ, 765, 94
- (223)
- (224) Soto, K. T., & Martin, C. L. 2010, ApJ, 716, 332
- (225)
- (226) Spiniello, C., Trager, S., Koopmans, L. V. E., & Conroy, C. 2014, MNRAS, 438, 1483
- (227)
- (228) Sugai, H., Malkan, M. A., Ward, M. J., Davies, R. I., & McLean, I. S. 1997, ApJ, 481, 186
- (229)
- (230) Taranu, D. S., Hudson, M. J., Balogh, M. L., Smith, R. J., Power, C., Oman, R. A., & Krane, B. 2014, MNRAS, 440, 1934
- (231)
- (232) Temi, P., Brighenti, F., & Mathews, W. G. 2009, ApJ, 707, 890
- (233)
- (234) Trager, S. C., Faber, S. M., Worthey, G., & Gonzalez, J. J. 2000, AJ, 120, 165
- (235)
- (236) Tully, R. B., & Shaya, E. J. 1984, ApJ, 281, 31
- (237)
- (238) Urich, L., Lisker, T., Janz, J., et al. 2017, A&A, 606, A135
- (239)
- (240) van Dokkum, P., Conroy, C., Villaume, A., Brodie, J., & Romanowsky, A. J. 2017, ApJ, 841, 68
- (241)
- (242) Vassiliadis, E., & Wood, P. R. 1993, ApJ, 413, 641
- (243)
- (244) Ventura, P., & D’Antona, F. 2011, MNRAS, 410, 2760
- (245)
- (246) Vera, M., Alonso, S., & Coldwell, G. 2016, A&A, 595, A63
- (247)
- (248) Wetzel, A. R., Tinker, J. L., Conroy, C., & van den Bosch, F. C. 2013, MNRAS, 432, 336
- (249)
- (250) Willson, L. A. 2000, ARA&A, 38, 573
- (251)
- (252) Zibetti, S., Gallazzi, A., Charlot, S., Pierini, D., & Pasquali, A. 2013, MNRAS, 428, 1479
- (253)
- (254) Zieleniewski, S., Houghton, R. C. W., Thatte, N., Davies, R. L., & Vaughan, S. P. 2017, MNRAS, 465, 192
- (255)