Indirect detection prospects for d∗(2380) dark matter
Abstract
A Bose-Einstein condensate of the hexaquark particle known as d∗(2380) has been recently proposed as a dark matter candidate by the authors in Bashkanov & Watts 2020. This particle can produced in an abundant condensate state in the early universe and is argued to satisfy all the stability and weak interaction constraints of a viable dark matter candidate. This dark matter candidate is able to evade direct detection bounds and is suggested to have the best observational prospects in the form of indirect astrophysical emissions due to the decay of the d∗ condensate. In this work we test the indirect observational prospects of this form of dark matter and find that its low mass GeV mean that sub-GeV gamma-rays searches have the best prospects in the Milky-Way galactic centre where we find s-1, with current extra-galactic data from M31 and the Coma cluster producing constraints on the d∗ decay rate two orders of magnitude weaker. In dwarf galaxies we show that the future GAMMA-400 instrument has the potential to probe down to s-1 with 4 years of exposure time.
1 Introduction
The nature of Dark Matter (DM) remains one of the most important problems in astroparticle physics. Despite extensive gravitational evidence [1, 2, 3, 4, 5] (or see [6] for a review) neither direct [7] (or see [8] and references therein for a review) nor indirect searches [6, 9, 10, 11, 12, 13, 14, 15, 16, 17, 18, 19, 20, 21, 22, 23] have produced anything beyond parameter space constraints on models of cold (or non-relativistic at the time of freeze-out) DM normally favoured by the eponymous, and now standard, CDM model of cosmology [1]. In particular direct detection experiments have strongly narrowed the space of viable supersymmetric Weakly Interacting Massive Particles (WIMPs) [7]. Other promising candidates such as sterile neutrinos are being actively searched for in both indirect and laboratory experiments, see [24, 25] for reviews. In addition, the axion or axion-like-particle has been the subject of searches in multiple forms [26, 27, 28, 29]. Despite a variety of theoretically well-motivated candidates for a DM particle, and a wide array of on-going searches, no positive evidence has emerged in favour of any particular model. This makes the exploration of new ideas to explain the nature of DM both necessary and worthwhile. This work is designed to explore the recent proposal of a new form of light quark based DM. This consists of having the hexaquark particle d∗(2380) formed in the early universe and existing until the present epoch in the form of a stable Bose-Einstein Condensate (BEC) [30]. This proposal is particularly interesting as, unlike the aforementioned DM candidates, particles are not part of an extension of the standard model of particle physics. The authors of [30] argue that production of particles, during the quark-gluon plasma to hadronic phase transition, would be copious enough to account for present inferred DM abundance [1] and that the condensate’s interactions with other matter would be sufficiently weak to justify consideration as a DM candidate.
The authors in [30] further argue that the most probable signature of this form of DM is likely to come from astrophysical emissions from the decay of the d∗ BEC. In this letter we explore the potential of indirect observations to detect the signatures of d∗ decay in both radio and gamma-ray frequencies. This is done by leveraging similar techniques to those used in multi-frequency indirect searches for cold DM particles. The schematic of the idea being that if the consequences of the decay of a single are known, then standard model particle yields from the decay can be used to compute the observable emissions in an astrophysical environment. This requires incorporating data as to the structure of a target DM halo where the decays take place as well as the astrophysical environment in the form of local gas densities and magnetic field strengths, both of which can influence emissions from bremsstrahlung, inverse-Compton scattering, and synchrotron radiation. We specifically explore concentrated DM halos as these environments would contain the largest particle abundances and thus have a larger rate of DM decays, thus making for more visible signatures.
In particular we will explore several halos as target environments: the Coma cluster of galaxies, the Milky-Way galactic centre (GC), the Reticulum II dwarf galaxy, and M31 or the Andromeda galaxy. All of these environments have been previously used/proposed as targets in indirect DM searches [18, 13, 22, 11, 9, 31, 17, 10, 14, 32] in a variety of frequency bands from radio to gamma-rays. Barring the Reticulum II dwarf galaxy, all of the chosen targets have been the subject of extensive astrophysical study and thus have relatively well characterised environments in terms of gas densities and magnetic field profiles [33, 34, 35, 36]. In addition to this, the structure of each of the DM halos has previously been explored in the literature [11, 37, 32, 10, 38, 39, 40] (and references therein).
For simplicity we assume the decay rate of is a constant , although it would in principle depend upon the nature of the interactions between cosmic-rays and the BEC [30]. Our findings are that the best extra-galactic target constraint on the decay rate was from the M31 galaxy with s-1 which corresponds to lower limit on the d∗ BEC lifetime several orders of magnitude longer than the age of the universe [1]. A model independent search in diffuse galactic gamma-rays from [41] found s-1 but the photon yield per decay in this model exceeds the hexaquark case from [30] by 5 orders of magnitude at energies around GeV where our constraints are derived. So we exceed a ‘model-translated’ version of the [41] limit by two orders of magnitude in extra-galactic targets. We also note that a very similar model independent limit to that of [41] is derived from reionisation effects in [42].
In our own galactic centre we find the strongest observational prospect. Using the CLUMPY software [38, 39, 40] to determine a dark matter halo density profile we find that , a full two order of magnitude improvement on extra-galactic data. The galactic centre gamma-ray data set we used was for the Fermi-LAT GeV excess spectrum from [31] as this d∗ decay contributes to anomalous emissions not covered by the Fermi templates. The use of this spectrum greatly improves constraints as the flux is at least an order of magnitude below the total signal observed by Fermi-LAT. These limits better the translated limits from [41] by 5 orders of magnitude and are competitive with the unmodified limits on light DM decay via electrons with final-state radiation (we compare to this case as its spectral shape is most similar to the d∗ data from [30]).
This letter is structured as follows: in section 2 the particle distribution functions from d∗ decays are discussed followed by an examination of the emission mechanisms following decay. The DM target halos and their observational data sets are described in 3. The results are presented and discussed in section 4 and conclusions are drawn and summarised in section 5.
2 The formalism for emissions from d∗(2380) decay
The physical quantity of interest in indirect DM hunts is the flux of photons produced as consequence of the annihilation/decay of DM particles. In the case of the we are interested only in the decay [30]. There are two forms of flux we are interested in and we will label them primary and secondary. Primary emissions result from the prompt production of photons, either directly as part of the decay products or radiation from the prompt decay of these products (and/or final state radiation). Secondary emissions result from the interaction of decay products with the astrophysical environment. Thus, these will consist of Inverse-Compton Scattering (ICS), bremsstrahlung, and synchrotron radiation. All of the secondary radiation studied will be sourced from electrons that result from the products of the decay and thus the processes that affect the energy-loss and diffusion of electrons in astrophysical environments will also be discussed.
2.1 Primary emissions
The primary emission flux (photons per unit area per unit time) is simply calculated as follows
| (2.1) |
where this is the flux from within the volume bounded by radius , is the luminosity distance to the halo centre, and is the gamma-ray source function from decays.
The source function for particle species following decay is found according to
| (2.2) |
where is the decay rate, is the particle number produced per unit energy from a d∗ decay, is the DM density (which will come from the structure of the DM halo), and GeV. It is worth noting that [30] suggest that the condensate decay requires energy injection, via cosmic ray collisions with the BEC for instance, this means that the decay rate is in principle the product of the local cosmic-ray density and the velocity averaged interaction cross-section between the BEC and cosmic rays. In this work we will treat as a universal constant for simplicity as the nature of the interactions between and cosmic-rays are not specified in [30]. A full treatment will not invalidate the results presented here, rather it will clarify what limits result on . The yield functions are drawn from results presented in [30] with the possible decay modes being to photons (via neutral pions) and charged pions. Nucleons and deuterons are also considered in [30] but are not relevant in the context of this work. It is important to note that the authors in [30] present yields for but not , the latter being more relevant for astronomical signatures. Thus, to obtain the yields, we convert the pion distributions to those of electrons/positrons following [43] which notably omits radiative corrections. An important caveat here is that a pure 6 quark state is assumed for the particle by [30] whereas it is argued in the literature that it is likely to be an admixture of hadronic and quark states [44]. This may have implications on the particle source function that cannot be immediately quantified.
2.2 Electron equilibrium distributions
Secondary emission mechanisms require the spectrum of electrons injected via DM decays. These electrons lose energy through radiation and diffuse from their original point of injection. Thus, their distribution when considering long emission time-scales (as appropriate in astrophysical scenarios) will be taken to be the equilibrium solution to the diffusion-loss equation
| (2.3) |
where is the electron source function from decay and , are the diffusion and energy-loss functions respectively. The solution method followed here requires the approximation that and have no positional dependence, such that
| (2.4) |
where cm2 s-1, is the magnetic field coherence length, is the average magnetic field strength, and is the electron energy. The loss-function is found via [11, 18]
| (2.5) | ||||
where is the average gas density, the coefficients , , , are the energy-loss rates from ICS, synchrotron emission, Coulomb scattering, and bremsstrahlung. These coefficients are given by / (for CMB/inter-stellar radiation fields), , , in units of GeV s-1.
The solution to Eq. (2.3) when diffusion is negligible is given by [11]
| (2.6) |
When diffusion is not negligible, as in dwarf galaxies like Reticulum II [12, 22], a solution can be found by assuming spherical symmetry [45, 46, 11, 12]
| (2.7) |
where this depends upon the Green’s function . This function is expressed as
| (2.8) | ||||
with the sum running over a set of image charges at positions , with being the maximum radius of diffusion under consideration. We follow [11] in taking with being the virial radius of the halo in question. Finally, is given by
| (2.9) |
with
| (2.10) | ||||
2.3 Secondary emissions
As the secondary mechanisms are more complicated than primary ones, we will characterise each process with an emmissivity for frequency and halo position , this being an integral over electron energies :
| (2.11) |
where is the electron distribution within the source region from d∗ decay and is the power emitted at frequency through mechanism by an electron with energy , at position . The flux produced within a radius is then found via
| (2.12) |
Thus, in order to characterise each mechanism we need only provide the power .
The power produced by the ICS at a photon of frequency from an electron with energy is given by [47, 48]
| (2.13) |
where with redshift , is the energy of the seed photons distributed according to (this will taken to be that of the CMB), and
| (2.14) |
with being the Thompson cross-section and
| (2.15) |
with
| (2.16) | ||||
where is the electron mass.
The power from bremsstrahlung at photon energy from an electron at energy is given by [47, 48]
| (2.17) |
is the distribution of target nuclei of species , the cross-section is given by
| (2.18) |
with and being energy dependent factors determined by the species (see [47, 48] ).
The power from synchrotron emission at frequency from an electron at energy is given by [48, 47]
| (2.19) |
where is the electron mass, is the non-relativistic gyro-frequency, is magnetic field strength at , is the classical electron radius, and the quantities and are defined as
| (2.20) |
with the plasma frequency with being the gas density at , as the electron Lorentz factor, and
| (2.21) |
3 Halo environments and their observed fluxes
With the emission mechanisms now detailed we still require some information to compute the decay flux: namely a density as well as magnetic field and gas profiles, and respectively, for the decay environment. We choose to study dense DM halos, as if constitutes DM, these will present the strongest signatures due to the scaling of Eq. (2.2) with . Thus, in this section, we will enumerate the environmental properties of each halo of interest in this work. Furthermore, we will note what observational data will be compared to predicted emissions in order to place limits on the decay rate .
The primary halo characteristic is the DM density profile, entering into flux calculations via Eq. (2.2). We will make use of the Navarro-Frenk-White (NFW) case [49], the cored Burkert profile [50], and the Einasto profile [51]
| (3.1) | |||
where is the Einasto parameter, while and are the characteristic halo scale and density respectively. All of these profiles are used under the assumption that the halo is spherically symmetric.
3.1 Coma
In the Coma galaxy cluster we follow [52] in using the halo parameters M⊙, Mpc, and Mpc with an NFW profile ( is chosen to normalise the density to within ).
The gas density within the halo is taken to have a profile
| (3.2) |
with cm-3, , Mpc from [53] corrected to .
3.2 M31
In M31 we will use an NFW profile with parameters found in [37] to be M⊙, Mpc, and Mpc ( is chosen to normalise the density to within ). In M31 we use an exponential gas density
| (3.4) |
with cm-3 [33], and kpc fitted in [36]. In this environment we use the magnetic field model from [36] which has, within kpc,
| (3.5) |
with kpc.
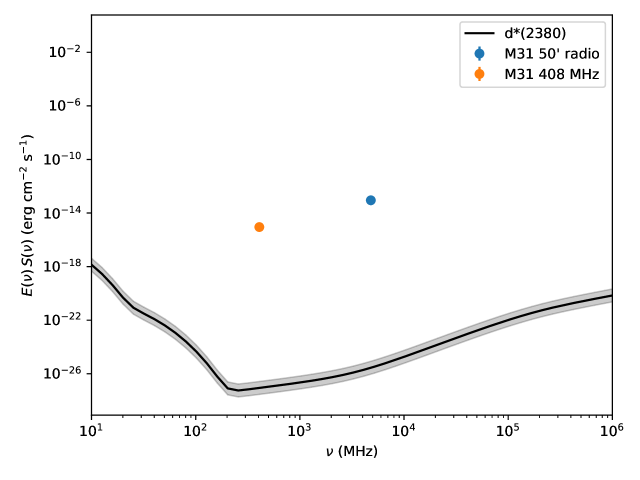
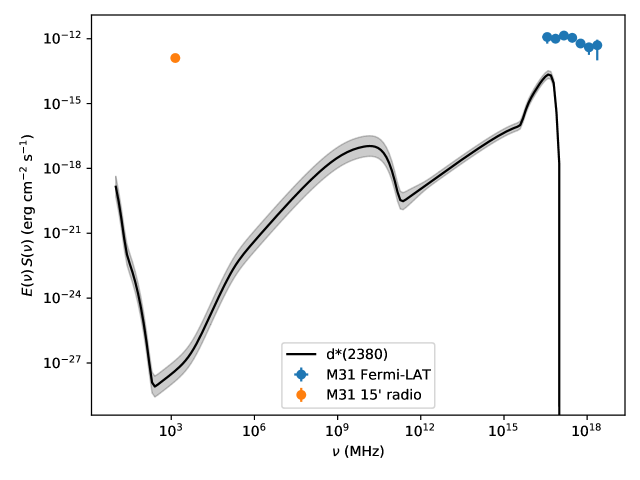
For testing decay predictions in M31 we make use of the radio frequency data set from [13], these are divided into and observing regions (see [13] and references therein for further details). For gamma-rays in M31 we use the data points (but not upper-limits at higher energies) from [55]. We match the integration radius for the DM flux to the region of interest for the data sets we are comparing to.
3.3 Reticulum II
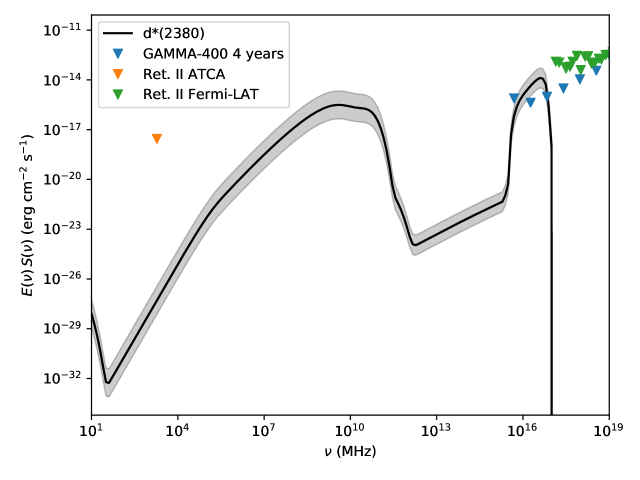
The Reticulum II dwarf galaxy is taken to have a Burkert density profile following arguments from [56, 57]. This profile has kpc [14] and is normalised to the annihilation J-factor GeV2 cm-5 found in [10] within of the galaxy centre.
3.4 Galactic centre
We use only the gamma-ray spectrum in the galactic centre and so our model data consist of just the annihilation J-factor. This J-factor is defined
| (3.8) |
where is the observed solid angle and l.o.s signifies the line of sight. It is evident that this quantity is equivalent to the integral over in Eq. (2.1). We find the J-factor, using CLUMPY [38, 39, 40], to be GeV2 cm-5 within 10∘ of the galactic centre, assuming an Einasto halo profile. We normalise our halo profile to the stated J-factor (using the CLUMPY halo parameters) in order to determine the decay products from this target. We stress that we do not use the J factor to calculate the decay-based flux, only to normalise the halo profile.
In this environment we test the gamma-ray spectrum of the Fermi-LAT excess from [31] against DM predictions using the region of interest around the galactic centre.
4 Results and discussion
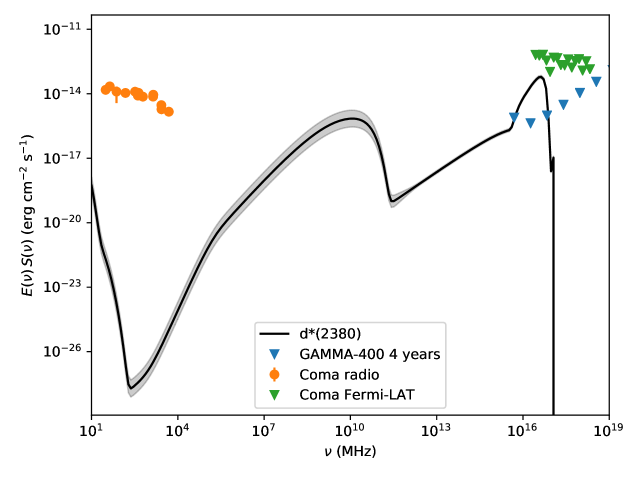
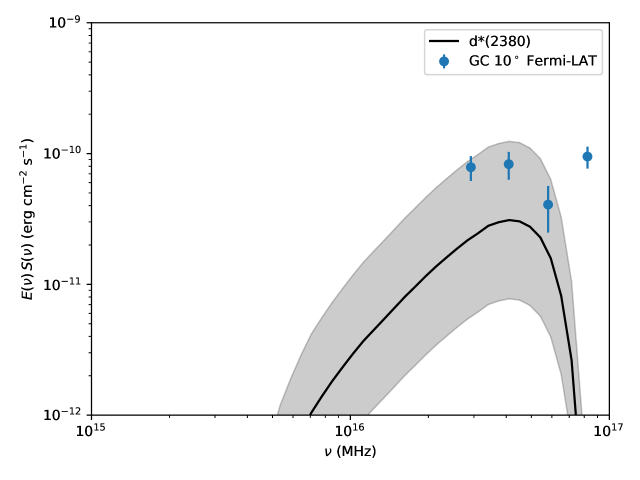
The results will be presented in the form of spectra from decay for each target halo. This will be in the form of the flux (calculated as the sum of Eq. (2.1) and each mechanism from Eq. (2.12)) which has units of energy per unit area per unit time with . This will be compared with observational data listed for each halo in section (3). We will display predicted spectra assuming a fiducial value of the decay rate s-1. Limits on the actual value of are then derived by requiring that the predicted flux is smaller than the observed flux (as cannot contribute more flux than has already been observed, it could only be responsible for some fraction of it). Note that being a constant, it acts as a normalisation factor multiplying the calculated spectrum, as displayed in Eq. (2.2). So the flux for a given is found by multiplying the displayed fiducial fluxes by .
The fiducial decay rate is chosen to be similar to the most comparable results in the literature: largely model independent sets from [41, 42] which constrain decaying DM models via direct decay to either photons or electrons and positrons. In our case the most comparable source functions from [41, 42] are those for DM decaying to electrons and positrons, as the spectral shape resembles those found in this work. However, the limits from [41, 42] are not completely compatible with the model from [30]. This is because, while the spectral shapes are somewhat similar, the model-independent gamma-ray yields are around 5 orders of magnitude larger than those presented for the decay of d∗ particles. This is due to the fact that decays to and photons via intermediate states. So a rough benchmark to compare with our limits derived here will be s-1. Additionally, this makes a reasonable benchmark due to the similarity of this to the age of the universe [1].
Each spectrum has 3 characteristic peaks: one for each of the synchrotron, ICS, and primary emissions (in ascending frequency order). The synchrotron peak falls below 10 MHz and so will not be displayed (as it is likely not visible with Earth-based radio telescopes). The bremsstrahlung contributes the bridging region between ICS and primary peaks. In each case the synchrotron emission dominates spectrum below a few hundred MHz, with the ICS region from to MHz, bremsstrahlung between and MHz, and finally primary emissions at higher frequencies. These regions vary slightly between each halo as they depend upon the gas and magnetic field strength profiles through the expressions for mechanism powers in section 2 and also via dependence on electron equilibrium distributions.
In the case of the Coma galaxy cluster in Figure 1 it is evident that existing gamma-ray upper-limits provide the strongest option for constraint in this environment with s-1 to avoid exceeding the limits at confidence interval. This is because of the proximity between these data points and the spectrum plotted with the fiducial decay rate. The observed radio data points are at least 5 orders of magnitude above the predicted spectrum and would thus only be exceeded by the predicted spectrum with a decay rate at least times higher than the fiducial value. The resulting constraints from this data are s-1. Our results in the Coma case already exceed the model-translated limits from [41, 42] by around 2 orders of magnitude. To supplement the higher energy measurements we have also considered the sensitivity projections of the GAMMA-400 telescope [60, 61] for 4 years of exposure time. This curve indicates that the Coma cluster can be probed for decays to a level of s-1 at the 95% confidence interval, though contamination by other emissions will likely limit this potential.
M31 results are displayed in Figs. 2 and 3 are also well below the observed data points for the fiducial value. However, the gamma-ray data points from [55] provide a constraint that s-1 at the 2 confidence level. This is vastly better than the Coma cluster radio constraint, and a factor of 10 or so weaker than the gamma-ray case. Substantially weaker limits result from the radio data points, as opposed to higher energies, largely as the synchrotron emissions peak at such a low frequency as a consequence of the GeV d∗ mass.
In Figure 4 we display the Reticulum II predicted spectrum. Importantly, the gamma-ray data points do not overlap with the predicted spectrum so can provide no constraints. However, the steep gamma-ray peak suggests that lower energy observations could provide a relatively strong probe of d∗ decays in this target, as evidence we see the GAMMA-400 sensitivity curve which can result in a limit of s at the 95% confidence interval. If we consider just a case where the power-law trend of the Fermi-LAT limits is continued, a s-1 is potentially attainable, on par with the Coma cluster. The relatively low energy threshold for ICS dominance in the Reticulum II spectrum also produces surprisingly strong radio limits (given the weak magnetic field assumptions) with s-1.
In figure 5 we display the case of the galactic centre gamma-ray spectrum compared to the data from the Fermi-LAT diffuse gamma-ray excess within 10∘ from [31]. Here we see that the s-1 case only lies slightly below the observed spectrum and a resulting constraint is that s-1, improving on the model translated value from [41, 42] by around 5 orders of magnitude making this competitive even with the unmodified model independent limits.
| Data set | Limit |
|---|---|
| GC gamma-ray | s-1 |
| M31 gamma-ray | s-1 |
| Coma gamma-ray | s-1 |
| Coma radio | s-1 |
| Reticulum II radio | s-1 |
| M31 radio | s-1 |
We present a summary of the constraints on the d∗ decay rate in Table 1. These results indicate that the various fluxes from d∗ decay are weak but benchmarking against the viability of the hexaquark DM model is difficult without a result for which would be necessary to reproduce the present-day DM abundance. The most optimistic observation case is from our results is the Milky-Way galactic centre which produces limits from gamma-ray fluxes similar to model-independent limits from [41, 41] and 5 orders of magnitude better than the roughly translated model-dependent value s-1. Despite being two orders of magnitude smaller than limits from the galactic centre, M31 and Coma still provide limits s-1 and s-1 respectively, indicating a particle lifetime lower limit around two orders of magnitude in excess of the age of the universe. If not for the limited energy range of the Reticulum II gamma-ray data it is likely that the strongest extra-galactic environment for these constraints is dwarf galaxies (particularly with gamma-ray measurements from instruments like GAMMA-400 [60, 61, 62] or perhaps millimetre telescopes). Radio limits are weak across the board due to the very low energy of the synchrotron peak as a consequence of the small d∗ mass. Particularly, this synchrotron peak lies below 10 MHz and is therefore likely unobservable within the atmosphere of Earth. X-ray observations are not considered here as they tend to fall into the trough between the ICS and gamma-ray emission peaks (as can be seen for THESEUS [63] for example) and thus have great difficulty in probing these models.
5 Summary and conclusions
We have presented a comparison of emission predictions from the decay of hexaquark particles to observed multi-frequency spectra in M31, the Milky-Way galactic centre, Reticulum II, and the Coma galaxy cluster. These results were used to place the first limits on the decay rate of the particle and explore the suggestion in [30] that indirect astrophysical observations would provide the strongest signatures of BEC DM. Our findings were that the best limit on the decay rate is found in the Milky-Way galactic centre with s-1 by comparing predicted spectra to the Fermi-LAT excess spectrum from [31].
Since this DM model has not been probed indirectly before it is not trivial to compare to existing literature. This is because any relevant limits will have to be sourced from model independent studies. The results most comparable to our work yield s-1 [41, 42] for light DM (with similar mass to ) decaying into directly. This approach results in a similar spectral shape to ours but over-produces the photon spectrum by a factor of . Thus, our results are comparable to existing model-independent limits at face value but also greatly exceed a ‘model adjusted’ version of the [41] limit at s-1. The discrepancy between the model independent case and that of arises because decays produce stable particles via initial decay to pions, rather than the direct production explored in the model independent literature in question.
The uncertainties from halo parameters in the presented results are notably small in comparison to the difference with the lower limits from [41] (model independent limits on decaying DM) and tend to be smaller in the simpler gamma-ray region of the spectrum. However, unquantified uncertainties exist in terms of the required value to achieve a significant present-day DM fraction and in the formalism used to convert charged pion products to electrons/positrons (as the quantitative effect of the neglected radiative corrections is unknown). This latter uncertainty does not affect the gamma-ray results as they were all attained from the neutral pion decay channels of d∗.
Despite these uncertainties it seems likely that the emissions from d∗ hexaquark decay produce relatively weak fluxes in astrophysical environments (a similar conclusion is reached in [64]) but that gamma-ray searches in galaxy clusters, galaxies, and dwarf galaxies at energies below 1 GeV may be able to provide further constraints. In particular, the GAMMA-400 instrument is highlighted as being promising in this regard being able to exclude decay-rates s-1 by non-observation with 4 years of exposure time. The data used in this work was not optimised for this kind of indirect DM search so the results produced could undoubtedly be improved upon in the future. One possible improvement in methodology would be to disentangle the constituents of decay rate (as described in section 2) in order to produce limits on the -cosmic-ray interaction cross-section.
Acknowledgements
G.B acknowledges support from a National Research Foundation of South Africa Thuthuka grant no. 117969. This research has made use of the NASA/IPAC Extragalactic Database (NED), which is operated by the Jet Propulsion Laboratory, California Institute of Technology, under contract with the National Aeronautics and Space Administration. This work also made use of the WebPlotDigitizer111http://automeris.io/WebPlotDigitizer/.
References
- [1] Planck Collaboration collaboration, Planck 2018 results. VI. Cosmological parameters, 1807.06209.
- [2] L. V. E. Koopmans and T. Treu, The structure and dynamics of luminous and dark matter in the early-type lens galaxy of 0047-281 at z = 0.485, The Astrophysical Journal 583 (2003) 606.
- [3] R. B. Metcalf, L. A. Moustakas, A. J. Bunker and I. R. Parry, Spectroscopic gravitational lensing and limits on the dark matter substructure in q2237+0305, The Astrophysical Journal 607 (2004) 43.
- [4] H. Hoekstra, H. Yee and M. D. Gladders, Current status of weak gravitational lensing, New Astronomy Reviews 46 (2002) 767.
- [5] L. A. Moustakas and R. B. Metcalf, Detecting dark matter substructure spectroscopically in strong gravitational lenses, Monthly Notices of the Royal Astronomical Society 339 (2003) 607.
- [6] G. Bertone and M. P. Tait, Tim, A new era in the search for dark matter, Nature 562 (2018) 51 [1810.01668].
- [7] XENON Collaboration 7 collaboration, Dark matter search results from a one ton-year exposure of xenon1t, Physical Review Letters 121 (2018) 111302.
- [8] M. Schumann, Direct detection of wimp dark matter: concepts and status, Journal of Physics G: Nuclear and Particle Physics 46 (2019) 103003.
- [9] Fermi-LAT Collaboration collaboration, Search for gamma-ray emission from the coma cluster with six years of fermi-lat data, The Astrophysical Journal 819 (2016) 149.
- [10] Fermi-LAT and DES Collaborations collaboration, Searching for dark matter annihilation in recently discovered milky way satellites with fermi-lat, The Astrophysical Journal 834 (2017) 110.
- [11] S. Colafrancesco, S. Profumo and P. Ullio, Multi-frequency analysis of neutralino dark matter annihilations in the coma cluster, Astronomy and Astrophysics 455 (2006) 21.
- [12] S. Colafrancesco, S. Profumo and P. Ullio, Detecting dark matter wimps in the draco dwarf: a multi-wavelength perspective, Physical Review D 75 (2007) 023513.
- [13] G. Beck, An excess of excesses examined via dark matter radio emissions from galaxies, JCAP 1908 (2019) 019 [1905.05599].
- [14] M. Regis, L. Richter and S. Colafrancesco, Dark matter in the reticulum ii dsph: a radio search, Journal of Cosmology and Astroparticle Physics 2017 (2017) 025.
- [15] M. H. Chan, L. Cui, J. Liu and C. S. Leung, ”ruling out 100-300 gev thermal relic annihilating dark matter by radio observation of the andromeda galaxy”, The Astrophysical Journal 872 (2019) 177.
- [16] M. H. Chan, Constraining annihilating dark matter by radio data of M33, Physical Review D96 (2017) 043009 [1708.01370].
- [17] H.E.S.S. collaboration, Search for dark matter annihilations towards the inner Galactic halo from 10 years of observations with H.E.S.S, Physical Review Letters 117 (2016) 111301 [1607.08142].
- [18] A. E. Egorov and E. Pierpaoli, Constraints on dark matter annihilation by radio observations of M31, Physical Review D 88 (2013) 023504 [1304.0517].
- [19] R. Caputo, M. R. Buckley, P. Martin, E. Charles, A. M. Brooks, A. Drlica-Wagner et al., Search for gamma-ray emission from dark matter annihilation in the small magellanic cloud with the fermi large area telescope, Physical Review D 93 (2016) 062004.
- [20] B. B. Siffert, A. Limone, E. Borriello, G. Longo and G. Miele, Radio emission from dark matter annihilation in the Large Magellanic Cloud, Monthly Notices of the Royal Astronomical Society 410 (2011) 2463 [1006.5325].
- [21] E. Storm, T. E. Jeltema, M. Splettstoesser and S. Profumo, Synchrotron emission from dark matter annihilation: Predictions for constraints from non-detections of galaxy clusters with new radio surveys, The Astrophysical Journal 839 (2017) 33.
- [22] G. Beck and S. Colafrancesco, A Multi-frequency analysis of dark matter annihilation interpretations of recent anti-particle and -ray excesses in cosmic structures, Journal of Cosmology and Astroparticle Physics 1605 (2016) 013 [1508.01386].
- [23] G. Beck, An excess of excesses examined via dark matter radio emissions from galaxies, Journal of Cosmology and Astroparticle Physics 2019 (2019) 019.
- [24] A. Boyarsky, M. Drewes, T. Lasserre, S. Mertens and O. Ruchayskiy, Sterile neutrino dark matter, Progress in Particle and Nuclear Physics 104 (2019) 1.
- [25] R. Adhikari, M. Agostini, N. A. Ky, T. Araki, M. Archidiacono, M. Bahr et al., A white paper on kev sterile neutrino dark matter, Journal of Cosmology and Astroparticle Physics 2017 (2017) 025.
- [26] L. D. Duffy and K. v. Bibber, Axions as dark matter particles, New Journal of Physics 11 (2009) 105008.
- [27] P. W. Graham, I. G. Irastorza, S. K. Lamoreaux, A. Lindner and K. A. van Bibber, Experimental searches for the axion and axion-like particles, Annual Review of Nuclear and Particle Science 65 (2015) 485 [https://doi.org/10.1146/annurev-nucl-102014-022120].
- [28] CAST collaboration, New cast limit on the axion-photon interaction, Nature Physics 13 (2017) 584.
- [29] T. Braine, R. Cervantes, N. Crisosto, N. Du, S. Kimes, L. Rosenberg et al., Extended search for the invisible axion with the axion dark matter experiment, Physical Review Letters 124 (2020) .
- [30] M. Bashkanov and D. P. Watts, A new possibility for light-quark dark matter, Journal of Physics G: Nuclear and Particle Physics 47 (2020) 03LT01.
- [31] M. Ackermann, M. Ajello, A. Albert, W. B. Atwood, L. Baldini, J. Ballet et al., The fermi galactic center gev excess and implications for dark matter, The Astrophysical Journal 840 (2017) 43.
- [32] V. Bonnivard, C. Combet, D. Maurin, A. Geringer-Sameth, S. M. Koushiappas, M. G. Walker et al., Dark matter annihilation and decay profiles for the Reticulum II dwarf spheroidal galaxy, The Astrophysical Journal 808 (2015) L36 [1504.03309].
- [33] R. Beck, The magnetic field in m31, Astronomy and Astrophysics 106 (1982) 121.
- [34] U. G. Briel, J. P. Henry and H. Boehringer, Observation of the Coma cluster of galaxies with ROSAT during the all-sky-survey., Astronomy and Astrophysics 259 (1992) L31.
- [35] A. Bonafede, L. Feretti, M. Murgia, F. Govoni, G. Giovannini, D. Dallacasa et al., The coma cluster magnetic field from faraday rotation measures, Astronomy and Astrophysics 513 (2010) A30.
- [36] B. Ruiz-Granados, J. A. Rubiño-Martín, E. Florido and E. Battaner, Magnetic fields and the outer rotation curve of m31, The Astrophysical Journal 723 (2010) L44.
- [37] A. Tamm, E. Tempel, P. Tenjes, O. Tihhonova and T. Tuvikene, Stellar mass map and dark matter distribution in M 31, Astronomy and Astrophysics 546 (2012) A4 [1208.5712].
- [38] A. Charbonnier, C. Combet and D. Maurin, Clumpy: A code for -ray signals from dark matter structures, Computer Physics Communications 183 (2012) 656.
- [39] V. Bonnivard, M. Hütten, E. Nezri, A. Charbonnier, C. Combet and D. Maurin, CLUMPY : Jeans analysis, -ray and fluxes from dark matter (sub-)structures, Computer Physics Communications 200 (2016) 336.
- [40] M. Hütten, C. Combet and D. Maurin, CLUMPY v3: -ray and signals from dark matter at all scales, Computer Physics Communications 235 (2019) 336 [1806.08639].
- [41] R. Essig, E. Kuflik, S. D. McDermott, T. Volansky and K. M. Zurek, Constraining Light Dark Matter with Diffuse X-Ray and Gamma-Ray Observations, JHEP 11 (2013) 193 [1309.4091].
- [42] H. Liu, T. R. Slatyer and J. Zavala, Contributions to cosmic reionization from dark matter annihilation and decay, Physical Review D 94 (2016) .
- [43] J. H. Scanlon and S. N. Milford, Energy Spectra of Electrons from --e Decays in Interstellar Space., The Astrophysical Journal 141 (1965) 718.
- [44] A. Gal, Pion assisted dibaryons: the d*(2380) resonance, EPJ Web Conf. 199 (2019) 02018.
- [45] E. A. Baltz and J. Edsjö, Positron propagation and fluxes from neutralino annihilation in the halo, Physical Review D 59 (1998) 023511.
- [46] E. A. Baltz and L. Wai, Diffuse inverse compton and synchrotron emission from dark matter annihilations in galactic satellites, Physical Review D 70 (2004) 023512.
- [47] M. S. Longair, High Energy Astrophysics. Cambridge University Press, 1994.
- [48] G. B. Rybicki and A. P. Lightman, Radiative Processes in Astrophysics. Wiley, June, 1986.
- [49] J. F. Navarro, C. S. Frenk and S. D. M. White, The Structure of cold dark matter halos, The Astrophysical Journal 462 (1996) 563 [astro-ph/9508025].
- [50] A. Burkert, The Structure of dark matter halos in dwarf galaxies, IAU Symp. 171 (1996) 175 [astro-ph/9504041].
- [51] J. Einasto, On galactic descriptive functions, Publications of the Tartuskoj Astrofizica Observatory 36 (1968) 414.
- [52] E. L. Łokas and G. A. Mamon, Dark matter distribution in the Coma cluster from galaxy kinematics: breaking the mass-anisotropy degeneracy, Monthly Notices of the Royal Astronomical Society 343 (2003) 401.
- [53] Y. Chen, T. H. Reiprich, H. Böhringer, Y. Ikebe and Y. Y. Zhang, Statistics of X-ray observables for the cooling-core and non-cooling core galaxy clusters, Astronomy and Astrophysics 466 (2007) 805 [astro-ph/0702482].
- [54] M. Thierbach, U. Klein and R. Wielebinski, The diffuse radio emission from the coma cluster at 2.675 ghz and 4.85 ghz, Astronomy and Astrophysics 397 (2003) 53.
- [55] Fermi-LAT Collaboration collaboration, Observations of m31 and m33 with the fermi large area telescope: A galactic center excess in andromeda?, The Astrophysical Journal 836 (2017) 208.
- [56] M. G. Walker, M. Mateo, E. W. Olszewski, J. P. narrubia, N. W. Evans and G. Gilmore, A universal mass profile for dwarf spheroidal galaxies?, The Astrophysical Journal 704 (2009) 1274.
- [57] J. J. Adams et al., Dwarf galaxy dark matter density profiles inferred from stellar and gas kinematics, The Astrophysical Journal 789 (2014) 63.
- [58] DES Collaboration collaboration, Eight New Milky Way Companions Discovered in First-year Dark Energy Survey Data, The Astrophysical Journal 807 (2015) 50 [1503.02584].
- [59] S. E. Koposov, V. Belokurov, G. Torrealba and N. W. Evans, Beasts of the Southern Wild: Discovery of nine Ultra Faint satellites in the vicinity of the Magellanic Clouds, The Astrophysical Journal 805 (2015) 130 [1503.02079].
- [60] A. M. Galper, O. Adriani, R. L. Aptekar, I. V. Arkhangelskaja, A. I. Arkhangelskiy, M. Boezio et al., Design and performance of the gamma-400 gamma-ray telescope for dark matter searches, .
- [61] N. P. Topchiev, A. M. Galper, I. V. Arkhangelskaja, A. I. Arkhangelskiy, A. V. Bakaldin, I. V. Chernysheva et al., High-energy gamma- and cosmic-ray observations with future space-based GAMMA-400 gamma-ray telescope, in European Physical Journal Web of Conferences, vol. 208 of European Physical Journal Web of Conferences, p. 14004, May, 2019, DOI.
- [62] A. E. Egorov, N. P. Topchiev, A. M. Galper, O. D. Dalkarov, A. A. Leonov, S. I. Suchkov et al., Dark matter searches by the planned gamma-ray telescope gamma-400, 2020.
- [63] L. Amati, P. O’Brien, D. Götz, E. Bozzo, C. Tenzer, F. Frontera et al., The theseus space mission concept: science case, design and expected performances, Advances in Space Research 62 (2018) 191.
- [64] M. H. Chan, The decaying and scattering properties of the d*(2380) hexaquark bose-einstein condensate dark matter, The Astrophysical Journal 898 (2020) 132.