GraphChallenge.org
Triangle Counting Performance
Abstract
The rise of graph analytic systems has created a need for new ways to measure and compare the capabilities of graph processing systems. The MIT/Amazon/IEEE Graph Challenge has been developed to provide a well-defined community venue for stimulating research and highlighting innovations in graph analysis software, hardware, algorithms, and systems. GraphChallenge.org provides a wide range of pre-parsed graph data sets, graph generators, mathematically defined graph algorithms, example serial implementations in a variety of languages, and specific metrics for measuring performance. The triangle counting component of GraphChallenge.org tests the performance of graph processing systems to count all the triangles in a graph and exercises key graph operations found in many graph algorithms. In 2017, 2018, and 2019 many triangle counting submissions were received from a wide range of authors and organizations. This paper presents a performance analysis of the best performers of these submissions. These submissions show that their state-of-the-art triangle counting execution time, , is a strong function of the number of edges in the graph, , which improved significantly from 2017 () to 2018 () and remained comparable from 2018 to 2019. Graph Challenge provides a clear picture of current graph analysis systems and underscores the need for new innovations to achieve high performance on very large graphs.
I Introduction
††footnotetext: This material is based upon work supported by the Assistant Secretary of Defense for Research and Engineering under Air Force Contract No. FA8702-15-D-0001 and National Science Foundation CCF-1533644. Any opinions, findings, conclusions or recommendations expressed in this material are those of the author(s) and do not necessarily reflect the views of the Assistant Secretary of Defense for Research and Engineering or the National Science Foundation.The importance of graph analysis has dramatically increased and is critical to a wide variety of domains that include the analysis of genomics [1, 2, 3, 4, 5, 6], brain mapping [7], computer networks [8, 9, 10, 11, 12, 13], social media [14, 15], cybersecurity [16, 17], and sparse machine learning [18, 19, 20, 21, 22, 23, 24].
Many graph processing systems are currently under development. These systems are exploring innovations in algorithms [25, 26, 27, 28, 29, 30, 31, 32, 33, 34, 35, 36], software architecture [37, 38, 39, 40, 41, 42, 43, 44, 45, 46], databases [47, 48], software standards [49, 50, 51, 52, 53, 54, 55], and parallel computing hardware [56, 57, 58, 59, 60, 61, 62, 63, 64, 65]. The rise of graph analysis systems has created a need for new ways to measure and compare the capabilities of these systems. The MIT/Amazon/IEEE Graph Challenge has been developed to provide a well-defined community venue for stimulating research and highlighting innovations in graph analysis software, hardware, algorithms, and systems. GraphChallenge.org provides a wide range of pre-parsed graph data sets, graph generators, mathematically defined graph algorithms, example serial implementations in a variety of languages, and specific metrics for measuring performance.
Scale is an important driver of the Graph Challenge and graphs with billions to trillions of edges are of keen interest. The Graph Challenge is designed to work on arbitrary graphs drawn from both real-world data sets and simulated data sets. Examples of real-world data sets include the Stanford Large Network Dataset Collection (see http://snap.stanford.edu/data), the AWS Public Data Sets (see aws.amazon.com/public-data-sets), and the Yahoo! Webscope Datasets (see webscope.sandbox.yahoo.com). These real-world data sets cover a wide range of applications and data sizes. While real-world data sets have many contextual benefits, synthetic data sets allow the largest possible graphs to be readily generated. Examples of synthetic data sets include Graph500, Block Two-level Erdos-Renyi graph model (BTER) [66], Kronecker Graphs [67, 68, 69], and Perfect Power Law graphs [70, 71, 72]. The focus of the Graph Challenge is on graph analytics. While parsing and formatting complex graph data are necessary in any graph analysis system, these data sets are made available to the community in a variety of pre-parsed formats to minimize the amount of parsing and formatting required by Graph Challenge participants. The public data are available in a variety of formats, such as linked list, tab separated, and labeled/unlabeled.
Graph Challenge 2017 received a large number of submissions that highlighted innovations in hardware, software, algorithms, systems, and visualization that allows the state-of-the-art in graph processing for 2017 to be estimated [73]. The goal of this paper is to analyze and synthesize the 2018 and 2019 submissions to provide an updated picture of the current state of the art of graph analysis systems. The organization of this paper is as follow. First, a recap of triangle counting is provided, along with a few standard algorithms. Next, an overview is presented of the Graph Challenge 2018 and 2019 submissions. The core of the paper is the section on the analysis of the 17 submission that all performed the triangle counting challenge. Based on this analysis, these results are synthesized to provide a picture of the current state of the art.
II Triangle Counting
The Graph Challenge consists of three challenges
-
•
Pre-challenge: PageRank pipeline [74]
-
•
Static graph challenge: subgraph isomorphism [75]
-
•
Streaming graph challenge: stochastic block partition [76]
-
•
Sparse deep neural network challenge [77]
The static graph challenge is further broken down into triangle counting and k-truss. Triangle counting is the focus of this paper.
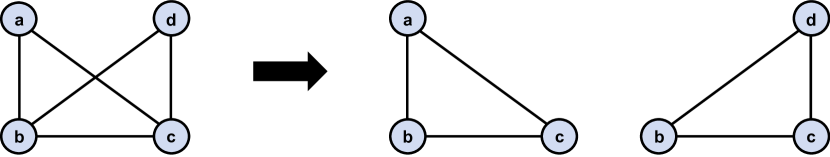
Triangles are the most basic, trivial sub-graph. A triangle can be defined as a set of three mutually adjacent vertices in a graph. As shown in Figure 1, the graph G contains two triangles comprising nodes {a,b,c} and {b,c,d}. The number of triangles in a graph is an important metric used in applications such as social network mining, link classification and recommendation, cyber security, functional biology, and spam detection [78].
The number of triangles in a given graph G can be calculated in several ways. We highlight two algorithms based on linear algebra primitives. The first algorithm proposed by Wolf et al [79] uses an overloaded matrix multiplication approach on the adjacency and incidence matrices of the graph and is shown in Algorithm 1. The second approach proposed by Burkhardt et al [80] uses only the adjacency matrix of the given graph and is shown in Algorithm 2.
Another algorithm for triangle counting based on a masked matrix multiplication approach has been proposed by Azad et al [81]. The serial version of this algorithm based on the MapReduce implementation by Cohen et al [82] is shown in Algorithm 3. Finally, a comparison of triangle counting algorithms can be found in [83].
III Community Submissions
Graph Challenge has received a wide range of submissions across all its various challenges that have included hundreds of authors from over fifty organizations. In 2018, eighteen submissions were selected for publication [84, 85, 86, 87, 88, 89, 90, 91, 92, 93, 94, 95, 96, 97, 98, 99, 100, 101] and nine provided sufficient triangle counting performance data for analysis [84, 85, 86, 87, 88, 89, 90, 91, 92]. In 2019, twenty submissions were selected for publication [102, 103, 104, 105, 106, 107, 108, 109, 110, 111, 112, 113, 114, 115, 116, 117, 118, 119, 120, 121] and eight provided sufficient triangle counting performance data for analysis [102, 103, 104, 105, 106, 107, 108, 109].
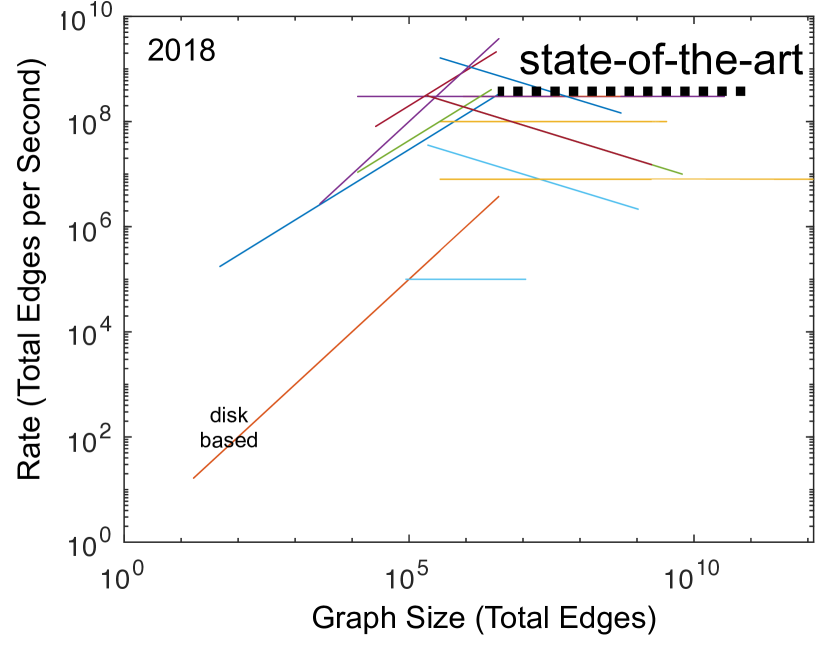
Numerous submissions implemented the triangle counting challenge in a comparable manner, resulting in over 800 distinct measurements of triangle counting execution time, . The number of edges, , in the graph describes the overall size of the graph. The rate of edges processed in triangle counting is given by
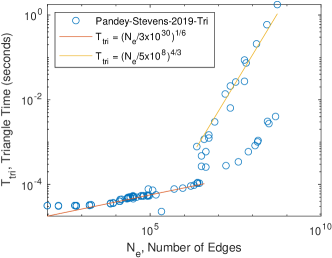
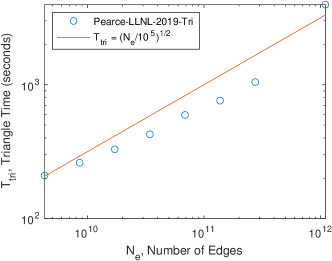
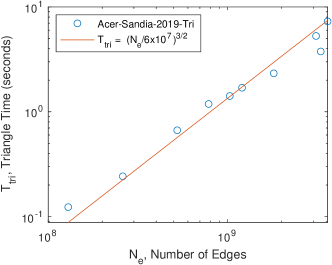
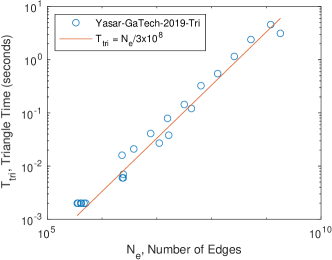
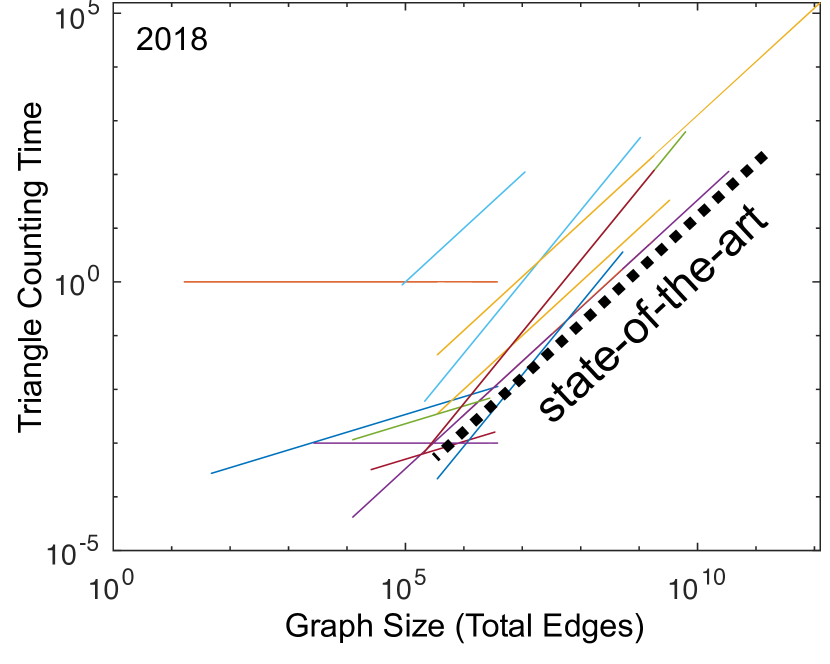
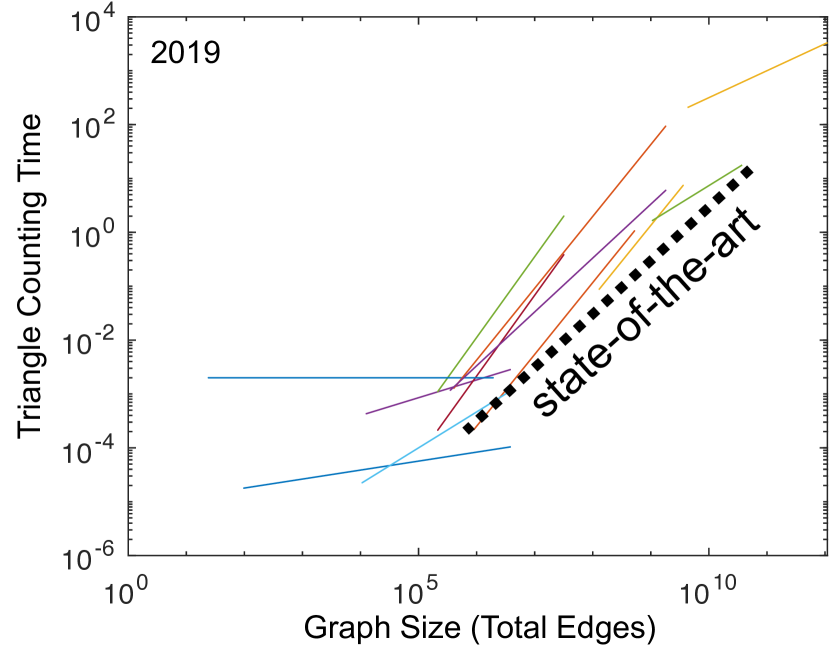
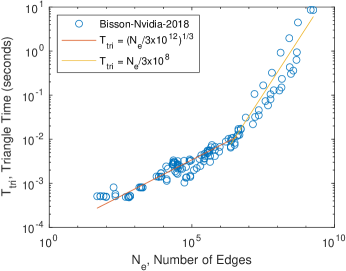
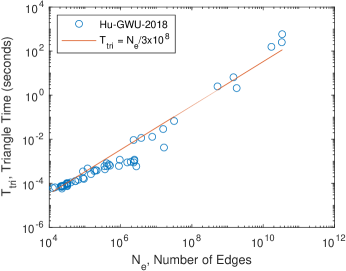
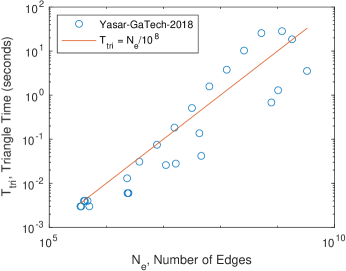
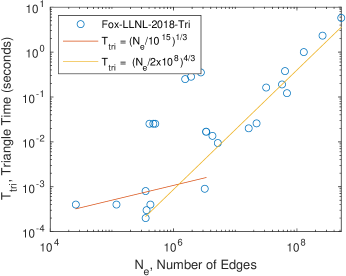
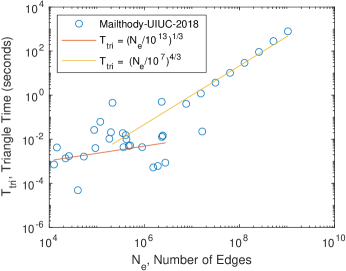
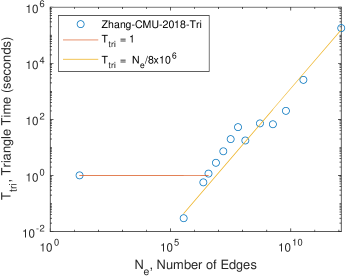
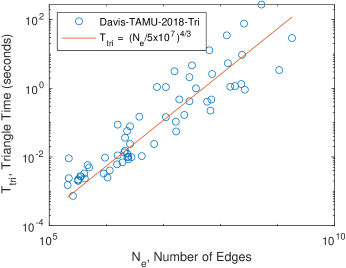
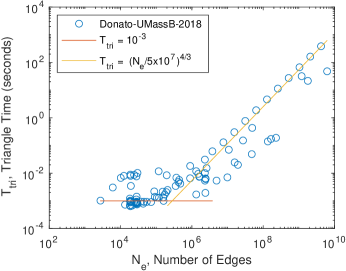
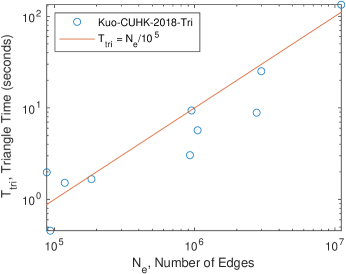
Analyzing and combining all the performance data from the submissions can be done by fitting a piecewise model to each submission and then comparing the models. For each submission, vs is plotted on a log-log scale from which a model can be fit to the data by estimating the parameters and in the formula
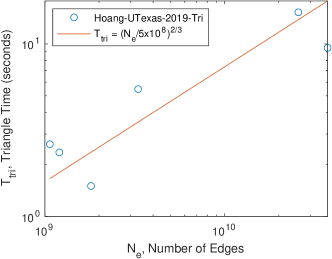
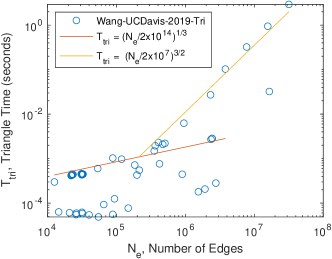
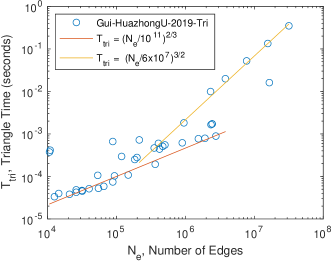
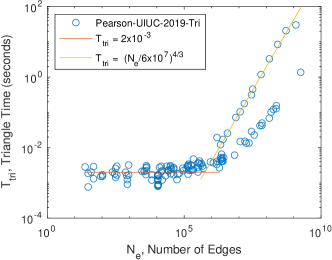
where is the number edges that can be processed in 1 second. The triangle counting execution time vs number of edges and corresponding model fits are given in Appendix A. The model fits illustrate the strong dependence of on .
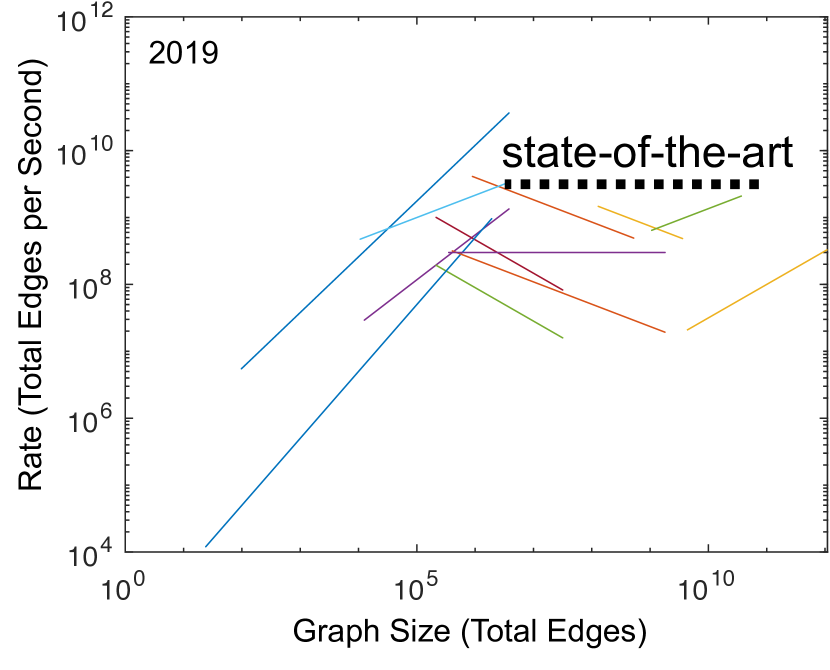
IV Performance Analysis
The normalized parameters and , along with the largest values of , are shown in Tables I and I for each submission. Submissions with larger , larger , and smaller perform best. The current state-of-the-art can be seen by plotting all the model fits together (see Figures 2 and 3). Combined, these suggest that state-of-the-art performance model of the 2018 and 2019 is
which is a significant improvement over the 2017 state-of-the-art performance model of
Given the enormous diversity in processors, algorithms, and software, this relatively consistent picture of the state-of-the-art suggests that the current limitations are set by common elements across these benchmarks, such as memory bandwidth.
| Ref | Submission | max | ||
|---|---|---|---|---|
| [84] | Bisson-Nvidia-2018 | |||
| [85] | Hu-GWU-2018 | |||
| [86] | Yasar-GaTech-2018 | |||
| [87] | Fox-LLNL-2018 | |||
| [88] | Mailthody-UIUC-2018 | |||
| [89] | Zhang-CMU-2018 | |||
| [90] | Davis-TAMU-2018 | |||
| [91] | Donato-UMassB-2018 | |||
| [92] | Kuo-CUHK-2018 |
| Ref | Submission | max | ||
|---|---|---|---|---|
| [102] | Pandey-Stevens-2019 | |||
| [103] | Pearce-LLNL-2019 | |||
| [104] | Acer-Sandia-2019 | |||
| [105] | Yasar-GaTech-2019 | |||
| [106] | Hoang-UTexas-2019 | |||
| [107] | Wang-UCDavis-2019 | |||
| [108] | Gui-HuazhongU-2019 | |||
| [109] | Pearson-UIUC-2019 |
V Conclusion
The rapid increase in the use of graphs and has inspired new ways to measure and compare the attributes of graph analytic systems. The MIT/Amazon/IEEE Graph Challenge was created to stimulate research in graph analysis software, hardware, algorithms, and systems. The GraphChallenge.org website makes available to the world many pre-processed graph data sets, graph generators, graph algorithms, prototype serial implementations in a several languages, and defined metrics for assessing performance. The triangle counting component of GraphChallenge.org tests the performance of graph processing systems to count all the triangles in a graph and exercises key graph operations found in many graph algorithms. In 2017, 2018, and 2019 many triangle counting submissions were received from a wide range of authors and organizations. These submissions show that their state-of-the-art triangle counting execution time, , is a strong function of the number of edges in the graph, , which improved significantly from 2017 () to 2018 () and remained comparable from 2018 to 2019. Graph Challenge provides a clear picture of current graph analysis systems and underscores the need for new innovations to achieve high performance on very large graphs.
Acknowledgments
The authors wish to acknowledge the following individuals for their contributions and support: Alan Edelman, Charles Leiserson, Steve Pritchard, Michael Wright, Bob Bond, Dave Martinez, Sterling Foster, Paul Burkhardt, Victor Roytburd, Trung Tran, along with William Arcand, David Bestor, William Bergeron, Chansup Byun, Matthew Hubbell, Michael Houle, Anna Klein, Peter Michaleas, Lauren Milechin, Julie Mullen, Andrew Prout, Antonio Rosa, and Charles Yee.
References
- [1] J. L. Morrison, R. Breitling, D. J. Higham, and D. R. Gilbert, “GeneRank: using search engine technology for the analysis of microarray experiments,” BMC Bioinformatics, vol. 6, no. 1, p. 233, 2005.
- [2] B. L. Mooney, L. R. Corrales, and A. E. Clark, “MoleculaRnetworks: An integrated graph theoretic and data mining tool to explore solvent organization in molecular simulation,” Journal of Computational Chemistry, vol. 33, no. 8, pp. 853–860, 2012.
- [3] D. Polychronopoulos, D. Sellis, and Y. Almirantis, “Conserved noncoding elements follow power-law-like distributions in several genomes as a result of genome dynamics,” PloS one, vol. 9, no. 5, p. e95437, 2014.
- [4] S. Dodson, D. O. Ricke, and J. Kepner, “Genetic sequence matching using D4M big data approaches,” in High Performance Extreme Computing Conference (HPEC), IEEE, 2014.
- [5] S. Dodson, D. O. Ricke, J. Kepner, N. Chiu, and A. Shcherbina, “Rapid sequence identification of potential pathogens using techniques from sparse linear algebra,” in Symposium on Technologies for Homeland Security, IEEE, 2015.
- [6] N. Gouda, Y. Shiwa, M. Akashi, H. Yoshikawa, K. Kasahara, and M. Furusawa, “Distribution of human single-nucleotide polymorphisms is approximated by the power law and represents a fractal structure,” Genes to Cells, vol. 21, no. 5, pp. 396–407, 2016.
- [7] A. Fornito, “Graph theoretic analysis of human brain networks,” fMRI Techniques and Protocols, pp. 283–314, 2016.
- [8] S. Brin and L. Page, “The anatomy of a large-scale hypertextual web search engine,” Computer Networks and ISDN Systems, vol. 30, no. 1, pp. 107–117, 1998.
- [9] M. Faloutsos, P. Faloutsos, and C. Faloutsos, “On power-law relationships of the internet topology,” in ACM SIGCOMM Computer Communication Review, vol. 29.4, pp. 251–262, ACM, 1999.
- [10] G. Yan, G. Tsekenis, B. Barzel, J.-J. Slotine, Y.-Y. Liu, and A.-L. Barabási, “Spectrum of controlling and observing complex networks,” Nature Physics, vol. 11, no. 9, pp. 779–786, 2015.
- [11] R. Fontugne, P. Abry, K. Fukuda, D. Veitch, K. Cho, P. Borgnat, and H. Wendt, “Scaling in internet traffic: a 14 year and 3 day longitudinal study, with multiscale analyses and random projections,” IEEE/ACM Transactions on Networking, 2017.
- [12] J. Kepner, K. Cho, and K. Claffy, “New phenomena in large-scale internet traffic,” arXiv preprint arXiv:1904.04396, 2019.
- [13] J. Kepner, K. Cho, K. Claffy, V. Gadepally, P. Michaleas, and L. Milechin, “Hypersparse neural network analysis of large-scale internet traffic,” in 2019 IEEE High Performance Extreme Computing Conference (HPEC), pp. 1–11, Sep. 2019.
- [14] M. Zuckerburg, “Facebook and computer science.” Harvard University CS50 guest lecture, Dec. 7 2005.
- [15] H. Kwak, C. Lee, H. Park, and S. Moon, “What is Twitter, a social network or a news media?,” in Proceedings of the 19th International Conference on World Wide Web, pp. 591–600, ACM, 2010.
- [16] S. Shao, X. Huang, H. E. Stanley, and S. Havlin, “Percolation of localized attack on complex networks,” New Journal of Physics, vol. 17, no. 2, p. 023049, 2015.
- [17] S. Yu, G. Gu, A. Barnawi, S. Guo, and I. Stojmenovic, “Malware propagation in large-scale networks,” IEEE Transactions on Knowledge and Data Engineering, vol. 27, no. 1, pp. 170–179, 2015.
- [18] H. Lee, C. Ekanadham, and A. Y. Ng, “Sparse deep belief net model for visual area v2,” in Advances in neural information processing systems, pp. 873–880, 2008.
- [19] M. Ranzato, Y.-l. Boureau, and Y. L. Cun, “Sparse feature learning for deep belief networks,” in Advances in neural information processing systems, pp. 1185–1192, 2008.
- [20] X. Glorot, A. Bordes, and Y. Bengio, “Deep sparse rectifier neural networks.,” in Aistats, vol. 15, p. 275, 2011.
- [21] D. Yu, F. Seide, G. Li, and L. Deng, “Exploiting sparseness in deep neural networks for large vocabulary speech recognition,” in Acoustics, Speech and Signal Processing (ICASSP), 2012 IEEE International Conference on, pp. 4409–4412, IEEE, 2012.
- [22] J. Kepner, M. Kumar, J. Moreira, P. Pattnaik, M. Serrano, and H. Tufo, “Enabling massive deep neural networks with the GraphBLAS,” in High Performance Extreme Computing Conference (HPEC), IEEE, 2017.
- [23] M. Kumar, W. P. Horn, J. Kepner, J. E. Moreira, and P. Pattnaik, “Ibm power9 and cognitive computing,” IBM Journal of Research and Development, vol. 62, pp. 10:1–10:12, July 2018.
- [24] S. Alford, R. Robinett, L. Milechin, and J. Kepner, “Training behavior of sparse neural network topologies,” in 2019 IEEE High Performance Extreme Computing Conference (HPEC), pp. 1–6, Sep. 2019.
- [25] T. H. Cormen, C. E. Leiserson, R. L. Rivest, and C. Stein, Introduction to Algorithms. Cambridge: MIT Press, 2009.
- [26] B. A. Miller, N. Arcolano, M. S. Beard, J. Kepner, M. C. Schmidt, N. T. Bliss, and P. J. Wolfe, “A scalable signal processing architecture for massive graph analysis,” in Acoustics, Speech and Signal Processing (ICASSP), 2012 IEEE International Conference on, pp. 5329–5332, IEEE, 2012.
- [27] A. Buluç, G. Ballard, J. Demmel, J. Gilbert, L. Grigori, B. Lipshitz, A. Lugowski, O. Schwartz, E. Solomonik, and S. Toledo, “Communication-avoiding linear-algebraic primitives for graph analytics,” in International Parallel and Distributed Processing Symposium Workshops (IPDPSW), IEEE, 2014.
- [28] C. Voegele, Y.-S. Lu, S. Pai, and K. Pingali, “Parallel triangle counting and k-truss identification using graph-centric methods,” in High Performance Extreme Computing Conference (HPEC), IEEE, 2017.
- [29] S. Smith, X. Liu, N. K. Ahmed, A. S. Tom, F. Petrini, and G. Karypis, “Truss decomposition on shared-memory parallel systems,” in High Performance Extreme Computing Conference (HPEC), IEEE, 2017.
- [30] Y. Hu, P. Kumar, G. Swope, and H. H. Huang, “Trix: Triangle counting at extreme scale,” in High Performance Extreme Computing Conference (HPEC), IEEE, 2017.
- [31] T. La Fond, G. Sanders, C. Klymko, and V. E. Henson, “An ensemble framework for detecting community changes in dynamic networks,” in High Performance Extreme Computing Conference (HPEC), IEEE, 2017.
- [32] D. Zhuzhunashvili and A. Knyazev, “Preconditioned spectral clustering for stochastic block partition streaming graph challenge (preliminary version at arxiv.),” in High Performance Extreme Computing Conference (HPEC), IEEE, 2017.
- [33] T. M. Low, V. N. Rao, M. Lee, D. Popovici, F. Franchetti, and S. McMillan, “First look: Linear algebra-based triangle counting without matrix multiplication,” in High Performance Extreme Computing Conference (HPEC), IEEE, 2017.
- [34] A. J. Uppal, G. Swope, and H. H. Huang, “Scalable stochastic block partition,” in High Performance Extreme Computing Conference (HPEC), IEEE, 2017.
- [35] S. Mowlaei, “Triangle counting via vectorized set intersection,” in High Performance Extreme Computing Conference (HPEC), IEEE, 2017.
- [36] J. Kepner and H. Jananthan, Mathematics of big data: Spreadsheets, databases, matrices, and graphs. MIT Press, 2018.
- [37] A. Buluç and J. R. Gilbert, “The combinatorial BLAS: Design, implementation, and applications,” The International Journal of High Performance Computing Applications, vol. 25, no. 4, pp. 496–509, 2011.
- [38] J. Kepner, W. Arcand, W. Bergeron, N. Bliss, R. Bond, C. Byun, G. Condon, K. Gregson, M. Hubbell, J. Kurz, A. McCabe, P. Michaleas, A. Prout, A. Reuther, A. Rosa, and C. Yee, “Dynamic Distributed Dimensional Data Model (D4M) database and computation system,” in 2012 IEEE International Conference on Acoustics, Speech and Signal Processing (ICASSP), pp. 5349–5352, IEEE, 2012.
- [39] R. Pearce, “Triangle counting for scale-free graphs at scale in distributed memory,” in High Performance Extreme Computing Conference (HPEC), IEEE, 2017.
- [40] M. Halappanavar, H. Lu, A. Kalyanaraman, and A. Tumeo, “Scalable static and dynamic community detection using grappolo,” in High Performance Extreme Computing Conference (HPEC), IEEE, 2017.
- [41] A. S. Tom, N. Sundaram, N. K. Ahmed, S. Smith, S. Eyerman, M. Kodiyath, I. Hur, F. Petrini, and G. Karypis, “Exploring optimizations on shared-memory platforms for parallel triangle counting algorithms,” in High Performance Extreme Computing Conference (HPEC), IEEE, 2017.
- [42] O. Green, J. Fox, E. Kim, F. Busato, N. Bombieri, K. Lakhotia, S. Zhou, S. Singapura, H. Zeng, R. Kannan, V. Prasanna, and D. Bader, “Quickly finding a truss in a haystack,” in High Performance Extreme Computing Conference (HPEC), IEEE, 2017.
- [43] H. Kabir and K. Madduri, “Parallel k-truss decomposition on multicore systems,” in High Performance Extreme Computing Conference (HPEC), IEEE, 2017.
- [44] S. Zhou, K. Lakhotia, S. G. Singapura, H. Zeng, R. Kannan, V. K. Prasanna, J. Fox, E. Kim, O. Green, and D. A. Bader, “Design and implementation of parallel pagerank on multicore platforms,” in High Performance Extreme Computing Conference (HPEC), IEEE, 2017.
- [45] D. Hutchison, “Distributed triangle counting in the graphulo matrix math library,” in High Performance Extreme Computing Conference (HPEC), IEEE, 2017.
- [46] M. M. Wolf, M. Deveci, J. W. Berry, S. D. Hammond, and S. Rajamanickam, “Fast linear algebra-based triangle counting with kokkoskernels,” in High Performance Extreme Computing Conference (HPEC), IEEE, 2017.
- [47] L. Milechin, V. Gadepally, and J. Kepner, “Database operations in d4m.jl,” in 2018 IEEE High Performance extreme Computing Conference (HPEC), pp. 1–5, Sep. 2018.
- [48] P. Cailliau, T. Davis, V. Gadepally, J. Kepner, R. Lipman, J. Lovitz, and K. Ouaknine, “Redisgraph graphblas enabled graph database,” in 2019 IEEE International Parallel and Distributed Processing Symposium Workshops (IPDPSW), pp. 285–286, May 2019.
- [49] T. Mattson, D. Bader, J. Berry, A. Buluc, J. Dongarra, C. Faloutsos, J. Feo, J. Gilbert, J. Gonzalez, B. Hendrickson, J. Kepner, C. Leiseron, A. Lumsdaine, D. Padua, S. Poole, S. Reinhardt, M. Stonebraker, S. Wallach, and A. Yoo, “Standards for graph algorithm primitives,” in High Performance Extreme Computing Conference (HPEC), IEEE, 2013.
- [50] J. Kepner, D. Bader, A. Buluç, J. Gilbert, T. Mattson, and H. Meyerhenke, “Graphs, matrices, and the GraphBLAS: Seven good reasons,” Procedia Computer Science, vol. 51, pp. 2453–2462, 2015.
- [51] J. Kepner, P. Aaltonen, D. Bader, A. Buluç, F. Franchetti, J. Gilbert, D. Hutchison, M. Kumar, A. Lumsdaine, H. Meyerhenke, S. McMillan, J. D. Owens, C. Yang, M. Zalewski, T. Mattson, and J. Moreira, “Mathematical foundations of the GraphBLAS,” in High Performance Extreme Computing Conference (HPEC), IEEE, 2016.
- [52] A. Buluç, T. Mattson, S. McMillan, J. Moreira, and C. Yang, “Design of the GraphBLAS API for C,” in Parallel and Distributed Processing Symposium Workshops (IPDPSW), 2017 IEEE International, pp. 643–652, IEEE, 2017.
- [53] T. Davis, “SuiteSparse:GraphBLAS,” in High Performance Extreme Computing Conference (HPEC), IEEE, 2017.
- [54] J. Kepner, V. Gadepally, L. Milechin, S. Samsi, W. Arcand, D. Bestor, W. Bergeron, C. Byun, M. Hubbell, M. Houle, M. Jones, A. Klein, P. Michaleas, J. Mullen, A. Prout, A. Rosa, C. Yee, and A. Reuther, “Streaming 1.9 billion hypersparse network updates per second with d4m,” in 2019 IEEE High Performance Extreme Computing Conference (HPEC), pp. 1–6, Sep. 2019.
- [55] J. Kepner, T. Davis, C. Byun, W. Arcand, D. Bestor, W. Bergeron, V. Gadepally, M. Hubbell, M. Houle, M. Jones, et al., “75,000,000,000 streaming inserts/second using hierarchical hypersparse graphblas matrices,” IPDPS GrAPL 2020, 2020.
- [56] W. S. Song, V. Gleyzer, A. Lomakin, and J. Kepner, “Novel graph processor architecture, prototype system, and results,” in High Performance Extreme Computing Conference (HPEC), IEEE, 2016.
- [57] M. Bisson and M. Fatica, “Static graph challenge on gpu,” in High Performance Extreme Computing Conference (HPEC), IEEE, 2017.
- [58] K. Date, K. Feng, R. Nagi, J. Xiong, N. S. Kim, and W.-M. Hwu, “Collaborative (cpu+ gpu) algorithms for triangle counting and truss decomposition on the minsky architecture: Static graph challenge: Subgraph isomorphism,” in High Performance Extreme Computing Conference (HPEC), IEEE, 2017.
- [59] E. P. DeBenedictis, J. Cook, S. Srikanth, and T. M. Conte, “Superstrider associative array architecture,” in High Performance Extreme Computing Conference (HPEC), IEEE, 2017.
- [60] S. Manne, B. Chin, and S. K. Reinhardt, “If you build it, will they come?,” IEEE Micro, vol. 37, no. 6, pp. 6–12, 2017.
- [61] P. M. Kogge, “Graph analytics: Complexity, scalability, and architectures,” in Parallel and Distributed Processing Symposium Workshops (IPDPSW), 2017 IEEE International, pp. 1039–1047, IEEE, 2017.
- [62] R. Gioiosa, A. Tumeo, J. Yin, T. Warfel, D. Haglin, and S. Betelu, “Exploring datavortex systems for irregular applications,” in Parallel and Distributed Processing Symposium (IPDPS), 2017 IEEE International, pp. 409–418, IEEE, 2017.
- [63] G. P. Krawezik, P. M. Kogge, T. J. Dysart, S. K. Kuntz, and J. O. McMahon, “Implementing the jaccard index on the migratory memory-side processing emu architecture,” in 2018 IEEE High Performance extreme Computing Conference (HPEC), pp. 1–6, Sep. 2018.
- [64] I. Kacher, M. Portaz, H. Randrianarivo, and S. Peyronnet, “Graphcore c2 card performance for image-based deep learning application: A report,” arXiv preprint arXiv:2002.11670, 2020.
- [65] S. Lie, “Wafer-scale deep learning,” Hot Chips, 2019.
- [66] C. Seshadhri, T. G. Kolda, and A. Pinar, “Community structure and scale-free collections of erdős-rényi graphs,” Physical Review E, vol. 85, no. 5, p. 056109, 2012.
- [67] J. Kepner and J. Gilbert, Graph algorithms in the language of linear algebra. SIAM, 2011.
- [68] G. Sanders, R. Pearce, T. La Fond, and J. Kepner, “On large-scale graph generation with validation of diverse triangle statistics at edges and vertices,” in 2018 IEEE International Parallel and Distributed Processing Symposium Workshops (IPDPSW), pp. 287–296, May 2018.
- [69] J. Kepner and R. Robinett, “Radix-net: Structured sparse matrices for deep neural networks,” in 2019 IEEE International Parallel and Distributed Processing Symposium Workshops (IPDPSW), pp. 268–274, May 2019.
- [70] J. Kepner, “Perfect power law graphs: Generation, sampling, construction and fitting,” in SIAM Annual Meeting, 2012.
- [71] V. Gadepally and J. Kepner, “Using a power law distribution to describe big data,” in High Performance Extreme Computing Conference (HPEC), IEEE, 2015.
- [72] J. Kepner, S. Samsi, W. Arcand, D. Bestor, B. Bergeron, T. Davis, V. Gadepally, M. Houle, M. Hubbell, H. Jananthan, M. Jones, A. Klein, P. Michaleas, R. Pearce, L. Milechin, J. Mullen, A. Prout, A. Rosa, G. Sanders, C. Yee, and A. Reuther, “Design, generation, and validation of extreme scale power-law graphs,” in 2018 IEEE International Parallel and Distributed Processing Symposium Workshops (IPDPSW), pp. 279–286, May 2018.
- [73] S. Samsi, V. Gadepally, M. Hurley, M. Jones, E. Kao, S. Mohindra, P. Monticciolo, A. Reuther, S. Smith, W. Song, D. Staheli, and J. Kepner, “Graphchallenge.org: Raising the bar on graph analytic performance,” in 2018 IEEE High Performance extreme Computing Conference (HPEC), pp. 1–7, Sep. 2018.
- [74] P. Dreher, C. Byun, C. Hill, V. Gadepally, B. Kuszmaul, and J. Kepner, “Pagerank pipeline benchmark: Proposal for a holistic system benchmark for big-data platforms,” in Parallel and Distributed Processing Symposium Workshops, 2016 IEEE International, pp. 929–937, IEEE, 2016.
- [75] S. Samsi, V. Gadepally, M. Hurley, M. Jones, E. Kao, S. Mohindra, P. Monticciolo, A. Reuther, S. Smith, W. Song, D. Staheli, and J. Kepner, “Static graph challenge: Subgraph isomorphism,” in High Performance Extreme Computing Conference (HPEC), IEEE, 2017.
- [76] E. Kao, V. Gadepally, M. Hurley, M. Jones, J. Kepner, S. Mohindra, P. Monticciolo, A. Reuther, S. Samsi, W. Song, D. Staheli, and S. Smith, “Streaming Graph Challenge - Stochastic Block Partition,” in High Performance Extreme Computing Conference (HPEC), IEEE, 2017.
- [77] J. Kepner, S. Alford, V. Gadepally, M. Jones, L. Milechin, R. Robinett, and S. Samsi, “Sparse deep neural network graph challenge,” in 2019 IEEE High Performance Extreme Computing Conference (HPEC), pp. 1–7, Sep. 2019.
- [78] A. Pavan, K. Tangwongsan, S. Tirthapura, and K.-L. Wu, “Counting and sampling triangles from a graph stream,” Proc. VLDB Endow., vol. 6, pp. 1870–1881, Sept. 2013.
- [79] M. M. Wolf, J. W. Berry, and D. T. Stark, “A task-based linear algebra building blocks approach for scalable graph analytics,” in 2015 IEEE High Performance Extreme Computing Conference (HPEC), Sept 2015.
- [80] P. Burkhardt, “Graphing trillions of triangles,” Information Visualization, 2016.
- [81] A. Azad, A. Buluç, and J. Gilbert, “Parallel triangle counting and enumeration using matrix algebra,” in Proceedings of the 2015 IEEE International Parallel and Distributed Processing Symposium Workshop, IPDPSW ’15, (Washington, DC, USA), pp. 804–811, IEEE Computer Society, 2015.
- [82] J. Cohen, “Graph twiddling in a mapreduce world,” Computing in Science and Engg., vol. 11, pp. 29–41, July 2009.
- [83] L. Wang, Y. Wang, C. Yang, and J. D. Owens, “A comparative study on exact triangle counting algorithms on the gpu,” in Proceedings of the ACM Workshop on High Performance Graph Processing, HPGP ’16, (New York, NY, USA), pp. 1–8, ACM, 2016.
- [84] M. Bisson and M. Fatica, “Update on static graph challenge on gpu,” in 2018 IEEE High Performance extreme Computing Conference (HPEC), pp. 1–8, Sep. 2018.
- [85] Y. Hu, H. Liu, and H. H. Huang, “High-performance triangle counting on gpus,” in 2018 IEEE High Performance extreme Computing Conference (HPEC), pp. 1–5, Sep. 2018.
- [86] A. Yaşar, S. Rajamanickam, M. Wolf, J. Berry, and . V. Çatalyürek, “Fast triangle counting using cilk,” in 2018 IEEE High Performance extreme Computing Conference (HPEC), pp. 1–7, Sep. 2018.
- [87] J. Fox, O. Green, K. Gabert, X. An, and D. A. Bader, “Fast and adaptive list intersections on the gpu,” in 2018 IEEE High Performance extreme Computing Conference (HPEC), pp. 1–7, Sep. 2018.
- [88] V. S. Mailthody, K. Date, Z. Qureshi, C. Pearson, R. Nagi, J. Xiong, and W. Hwu, “Collaborative (cpu + gpu) algorithms for triangle counting and truss decomposition,” in 2018 IEEE High Performance extreme Computing Conference (HPEC), pp. 1–7, Sep. 2018.
- [89] J. Zhang, D. G. Spampinato, S. McMillan, and F. Franchetti, “Preliminary exploration of large-scale triangle counting on shared-memory multicore system,” in 2018 IEEE High Performance extreme Computing Conference (HPEC), pp. 1–6, Sep. 2018.
- [90] T. A. Davis, “Graph algorithms via suitesparse: Graphblas: triangle counting and k-truss,” in 2018 IEEE High Performance extreme Computing Conference (HPEC), pp. 1–6, Sep. 2018.
- [91] E. Donato, M. Ouyang, and C. Peguero-Isalguez, “Triangle counting with a multi-core computer,” in 2018 IEEE High Performance extreme Computing Conference (HPEC), pp. 1–7, Sep. 2018.
- [92] C. Kuo, C. N. Hang, P. Yu, and C. W. Tan, “Parallel counting of triangles in large graphs: Pruning and hierarchical clustering algorithms,” in 2018 IEEE High Performance extreme Computing Conference (HPEC), pp. 1–6, Sep. 2018.
- [93] R. Pearce and G. Sanders, “K-truss decomposition for scale-free graphs at scale in distributed memory,” in 2018 IEEE High Performance extreme Computing Conference (HPEC), pp. 1–6, Sep. 2018.
- [94] A. Conte, D. De Sensi, R. Grossi, A. Marino, and L. Versari, “Discovering -trusses in large-scale networks,” in 2018 IEEE High Performance extreme Computing Conference (HPEC), pp. 1–6, Sep. 2018.
- [95] T. M. Low, D. G. Spampinato, A. Kutuluru, U. Sridhar, D. T. Popovici, F. Franchetti, and S. McMillan, “Linear algebraic formulation of edge-centric k-truss algorithms with adjacency matrices,” in 2018 IEEE High Performance extreme Computing Conference (HPEC), pp. 1–7, Sep. 2018.
- [96] A. Fox, G. Sanders, and A. Knyazev, “Investigation of spectral clustering for signed graph matrix representations,” in 2018 IEEE High Performance extreme Computing Conference (HPEC), pp. 1–7, Sep. 2018.
- [97] O. Green, J. Fox, A. Watkins, A. Tripathy, K. Gabert, E. Kim, X. An, K. Aatish, and D. A. Bader, “Logarithmic radix binning and vectorized triangle counting,” in 2018 IEEE High Performance extreme Computing Conference (HPEC), pp. 1–7, Sep. 2018.
- [98] S. Ghosh, M. Halappanavar, A. Tumeo, A. Kalyanaraman, and A. H. Gebremedhin, “Scalable distributed memory community detection using vite,” in 2018 IEEE High Performance extreme Computing Conference (HPEC), pp. 1–7, Sep. 2018.
- [99] S. Huang, M. El-Hadedy, C. Hao, Q. Li, V. S. Mailthody, K. Date, J. Xiong, D. Chen, R. Nagi, and W. Hwu, “Triangle counting and truss decomposition using fpga,” in 2018 IEEE High Performance extreme Computing Conference (HPEC), pp. 1–7, Sep. 2018.
- [100] F. Sadi, J. Sweeney, S. McMillan, T. M. Low, J. C. Hoe, L. Pileggi, and F. Franchetti, “Pagerank acceleration for large graphs with scalable hardware and two-step spmv,” in 2018 IEEE High Performance extreme Computing Conference (HPEC), pp. 1–7, Sep. 2018.
- [101] A. J. Uppal and H. H. Huang, “Fast stochastic block partition for streaming graphs,” in 2018 IEEE High Performance extreme Computing Conference (HPEC), pp. 1–6, Sep. 2018.
- [102] S. Pandey, X. S. Li, A. Buluc, J. Xu, and H. Liu, “H-index: Hash-indexing for parallel triangle counting on gpus,” in 2019 IEEE High Performance Extreme Computing Conference (HPEC), pp. 1–7, Sep. 2019.
- [103] R. Pearce, T. Steil, B. W. Priest, and G. Sanders, “One quadrillion triangles queried on one million processors,” in 2019 IEEE High Performance Extreme Computing Conference (HPEC), pp. 1–5, Sep. 2019.
- [104] S. Acer, A. Yaşar, S. Rajamanickam, M. Wolf, and . V. Catalyürek, “Scalable triangle counting on distributed-memory systems,” in 2019 IEEE High Performance Extreme Computing Conference (HPEC), pp. 1–5, Sep. 2019.
- [105] A. Yaşar, S. Rajamanickam, J. Berry, M. Wolf, J. S. Young, and . V. ÇatalyÜrek, “Linear algebra-based triangle counting via fine-grained tasking on heterogeneous environments : (update on static graph challenge),” in 2019 IEEE High Performance Extreme Computing Conference (HPEC), pp. 1–4, Sep. 2019.
- [106] L. Hoang, V. Jatala, X. Chen, U. Agarwal, R. Dathathri, G. Gill, and K. Pingali, “Disttc: High performance distributed triangle counting,” in 2019 IEEE High Performance Extreme Computing Conference (HPEC), pp. 1–7, Sep. 2019.
- [107] X. Wang, Z. Lin, C. Yang, and J. D. Owens, “Accelerating dnn inference with graphblas and the gpu,” in 2019 IEEE High Performance Extreme Computing Conference (HPEC), pp. 1–6, Sep. 2019.
- [108] C. Gui, L. Zheng, P. Yao, X. Liao, and H. Jin, “Fast triangle counting on gpu,” in 2019 IEEE High Performance Extreme Computing Conference (HPEC), pp. 1–7, Sep. 2019.
- [109] C. Pearson, M. Almasri, O. Anjum, V. S. Mailthody, Z. Qureshi, R. Nagi, J. Xiong, and W. Hwu, “Update on triangle counting on gpu,” in 2019 IEEE High Performance Extreme Computing Conference (HPEC), pp. 1–7, Sep. 2019.
- [110] M. Bisson and M. Fatica, “A gpu implementation of the sparse deep neural network graph challenge,” in 2019 IEEE High Performance Extreme Computing Conference (HPEC), pp. 1–8, Sep. 2019.
- [111] M. Blanco, T. M. Low, and K. Kim, “Exploration of fine-grained parallelism for load balancing eager k-truss on gpu and cpu,” in 2019 IEEE High Performance Extreme Computing Conference (HPEC), pp. 1–7, Sep. 2019.
- [112] T. A. Davis, M. Aznaveh, and S. Kolodziej, “Write quick, run fast: Sparse deep neural network in 20 minutes of development time via suitesparse:graphblas,” in 2019 IEEE High Performance Extreme Computing Conference (HPEC), pp. 1–6, Sep. 2019.
- [113] J. A. Ellis and S. Rajamanickam, “Scalable inference for sparse deep neural networks using kokkos kernels,” in 2019 IEEE High Performance Extreme Computing Conference (HPEC), pp. 1–7, Sep. 2019.
- [114] S. Ghosh, M. Halappanavar, A. Tumeo, and A. Kalyanarainan, “Scaling and quality of modularity optimization methods for graph clustering,” in 2019 IEEE High Performance Extreme Computing Conference (HPEC), pp. 1–6, Sep. 2019.
- [115] X. Liu, J. S. Firoz, M. Zalewski, M. Halappanavar, K. J. Barker, A. Lumsdaine, and A. H. Gebremedhin, “Distributed direction-optimizing label propagation for community detection,” in 2019 IEEE High Performance Extreme Computing Conference (HPEC), pp. 1–6, Sep. 2019.
- [116] M. Almasri, O. Anjum, C. Pearson, Z. Qureshi, V. S. Mailthody, R. Nagi, J. Xiong, and W. Hwu, “Update on k-truss decomposition on gpu,” in 2019 IEEE High Performance Extreme Computing Conference (HPEC), pp. 1–7, Sep. 2019.
- [117] X. Wang, Z. Lin, C. Yang, and J. D. Owens, “Accelerating dnn inference with graphblas and the gpu,” in 2019 IEEE High Performance Extreme Computing Conference (HPEC), pp. 1–6, Sep. 2019.
- [118] F. Wanye, V. Gleyzer, and W. Feng, “Fast stochastic block partitioning via sampling,” in 2019 IEEE High Performance Extreme Computing Conference (HPEC), pp. 1–7, Sep. 2019.
- [119] J. Wang, Z. Huang, L. Kong, J. Xiao, P. Wang, L. Zhang, and C. Li, “Performance of training sparse deep neural networks on gpus,” in 2019 IEEE High Performance Extreme Computing Conference (HPEC), pp. 1–5, Sep. 2019.
- [120] S. Huang, C. Pearson, R. Nagi, J. Xiong, D. Chen, and W. Hwu, “Accelerating sparse deep neural networks on fpgas,” in 2019 IEEE High Performance Extreme Computing Conference (HPEC), pp. 1–7, Sep. 2019.
- [121] M. H. Mofrad, R. Melhem, Y. Ahmad, and M. Hammoud, “Multithreaded layer-wise training of sparse deep neural networks using compressed sparse column,” in 2019 IEEE High Performance Extreme Computing Conference (HPEC), pp. 1–6, Sep. 2019.
Appendix A 2018 Triangle Counting Submissions
Appendix B 2019 Triangle Counting Submissions