Present Address: ]Centre for Quantum Technologies, National University of Singapore, Singapore Present Address: ]National Institute of Advanced Industrial Science and Technology, Tsukuba, Ibaraki, Japan
Electron Spin Resonance with up to 20 Spin Sensitivity Measured using a Superconducting Flux Qubit
Abstract
We report on electron spin resonance spectroscopy measurements using a superconducting flux qubit with a sensing volume of 6 fl. The qubit is read out using a frequency-tunable Josephson bifurcation amplifier, which leads to an inferred measurement sensitivity of about 20 spins in a 1 s measurement. This sensitivity represents an order of magnitude improvement when compared with flux-qubit schemes using a dc-SQUID switching readout. Furthermore, noise spectroscopy reveals that the sensitivity is limited by flicker () flux noise.
pacs:
In recent years there has been an increased interest in using superconducting circuits to perform electron spin resonance (ESR) at millikelvin temperatures due to the improved sensitivity and the highly polarized spins. For example, by inductively coupling a spin ensemble with a superconducting lumped-element resonator with a small mode volume inductor that is combined with a parametric amplifier, a state-of-the-art sensitivity value of about 12 spins Hz-1/2 has been reported Ranjan et al. (2020). Sensitivity improvements utilizing quantum squeezing have also been achieved Bienfait et al. (2017). Since these inductive-detection schemes typically employ fixed-frequency resonators that operate near their resonance, they are generally limited to magnetic field-dependent studies. However, to fully characterize more complicated spin systems (for example, anisotropic systems, or systems with hyperfine and quadrupole interactions), magnetic field- and frequency-dependent ESR spectroscopy is required Wiemann et al. (2015); Chen et al. (2018). This can be achieved by using a broadband waveguide Wiemann et al. (2015), a tunable resonator Chen et al. (2018), or by using the magnetic flux detection capabilities of superconducting loop structures such as a direct current-superconducting quantum interference device (dc-SQUID) Toida et al. (2016); Yue et al. (2017), a frequency-tunable Josephson bifurcation amplifier (JBA) Budoyo et al. (2018a), or a flux qubit Bal et al. (2012); Toida et al. (2019). Recently flux qubit ESR spectroscopy with sensitivity of 400 spins Hz-1/2 has been reported Toida et al. (2019).
In this paper, we report on further improvements in the sensitivity of ESR using a flux qubit, which is achieved by changing the readout scheme. The previous flux qubit ESR spectroscopy was performed using a dc-SQUID switching readout Toida et al. (2019). However, in this measurement protocol, the repetition rate is limited by heating due to the dc-SQUID switching to a voltage state. Consequently the qubit readout is now replaced with a tunable JBA switching readout Lupaşcu et al. (2006); Vijay, Devoret, and Siddiqi (2009), which allows an order of magnitude higher repetition rates as the JBA remains in a superconducting state thus creating no heat on the sample chip. In addition a flux qubit with a significantly smaller loop size is employed hence reducing the sensing volume by a factor of 8. This modification yields a sensitivity improvement by an order of magnitude to 20 spins for a 1 second measurement, making this result comparable to the best sensitivity values for inductive-coupling schemes employing a fixed-frequency resonator Probst et al. (2017). Lastly, noise spectroscopy reveals that this sensitivity is limited by flux noise in the SQUID structure of the JBA.
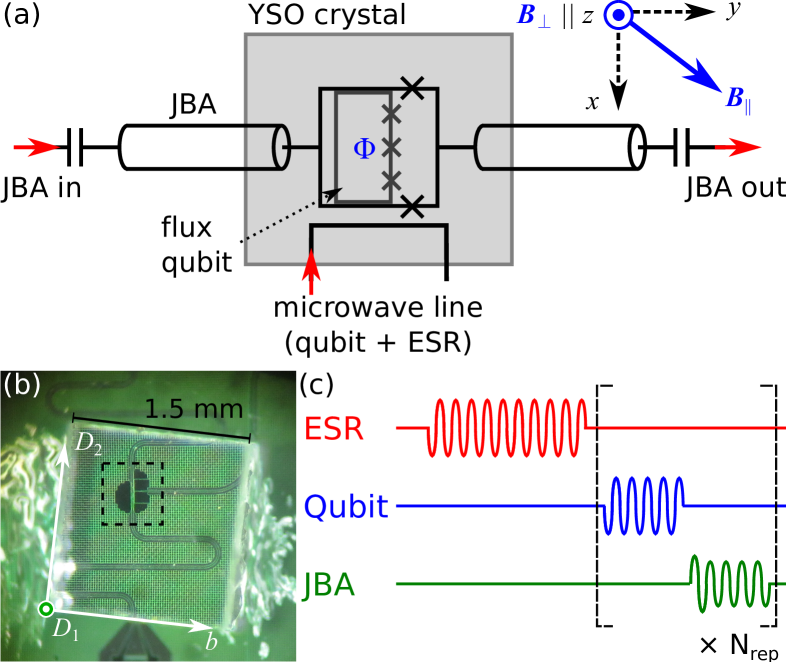
Figure 1(a) shows a simplified measurement schematic. A standard three junction flux qubit with a 6 m2 loop size is embedded inside and shares its edges with a dc-SQUID of the JBA Vijay, Devoret, and Siddiqi (2009); Kakuyanagi et al. (2015). A single microwave line was used for both the qubit and the ESR excitation signals. An isotopically purified Er3+ doped yttrium orthosilicate (Y2SiO5/YSO) crystal (91.8% 167Er isotopes with electron spin and nuclear spin , with 50 ppm total Er abundance) was used in this study and it was placed on top of the qubit chip as shown in Fig. 1(b). Er dopants can lie on two crystallographic sites in YSO crystal, with two subclasses for each site related by rotation. A 2d vector magnet enabled magnetic field to be applied parallel to the surface of the chip to polarize the spin ensemble. A second, much smaller magnetic field was applied perpendicular to the chip to flux bias the qubit. The system was then cooled to millikelvin temperature ranges using a dilution refrigerator, that was connected to a standard flux qubit measurement setup.
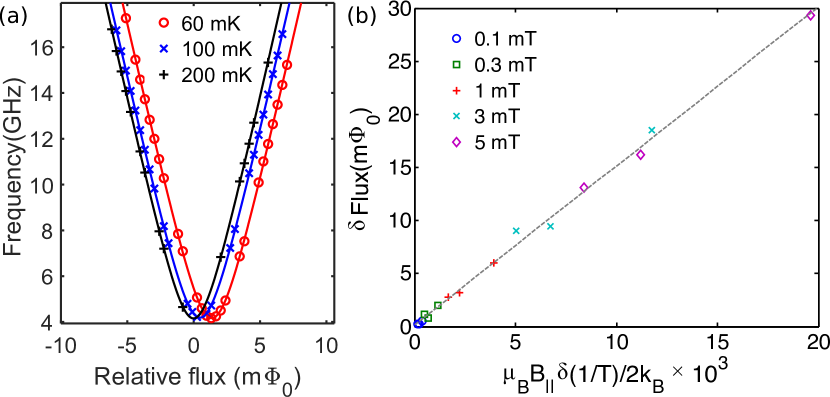
The system was initially characterized by measuring the magnetization induced by the spin ensemble on the qubit at different temperature and values. More specifically was oriented along the axis of the crystal, where the two subclasses for each site are equivalent. Due to the anisotropy of the -factor tensor of Er:YSO, there is a nonzero magnetization perpendicular to the chip surface. For each and value, the qubit spectroscopy was performed at a range of applied flux bias values and the resultant spectra were fitted for the qubit frequency given by the standard flux qubit expression , where is the flux qubit energy gap. The flux-dependent detuning is given by , where is the flux quantum and is the persistent current ( nA for the qubit used). The offset flux depends on and and it includes the effect of the magnetization from the spins, any stray magnetic field from the environment, any misalignment of , and the possible presence of vortices. Since is measured after a change in while is unchanged, the latter three effects are identical with the same and different . As a result, the change in magnetization flux due to temperature change can be defined as .
Figure 2(a) shows a plot of as a function of with for several temperatures, where an apparent change in magnetization is observed with a change in temperature. Although no spin magnetization is expected when total , a small magnetization may emerge from the applied nonzero , and/or from a stray environmental magnetic field. To account for these effects, is plotted as a function of in Fig. 2(b), with the Bohr magneton, and .
For a spin-1/2 system with zero nuclear spin, the spin magnetization follows
| (1) |
where is the saturation magnetization level and is the g-factor. For ,
| (2) |
For 167Er:YSO contributions from the two sites, the anisotropy of -factor tensors, as well as the presence of nuclear spins () need to be considered, but simulations Toida et al. (2019); Stoll and Schweiger (2006) show that the magnetization for small still approximately follows Eq. 2 with an effective g-factor for this measurement configuration. The linear fit in Fig. 2(b) confirms that the spin magnetization follows Eq. 2 with , and this is consistent with previous spin detection measurements of Er:YSO Toida et al. (2016); Budoyo et al. (2018a); Toida et al. (2019).
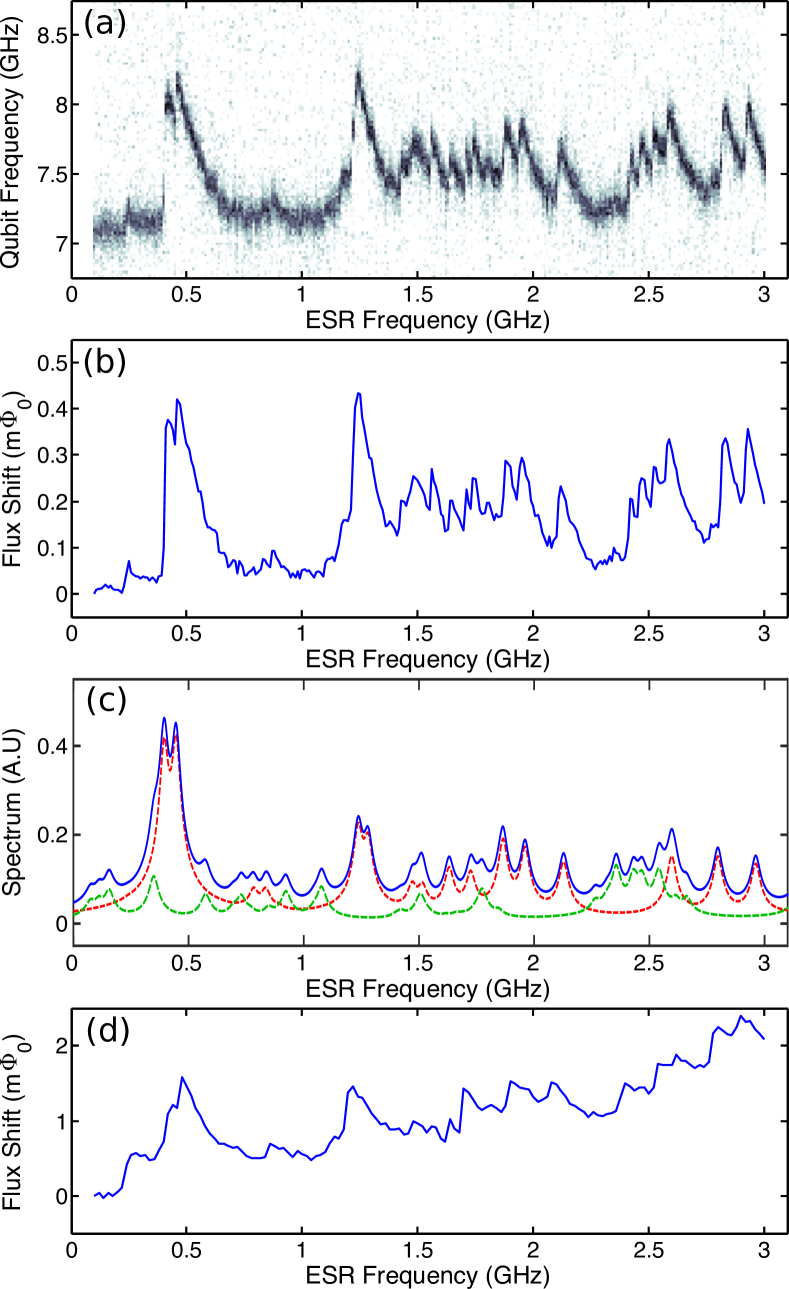
Next, ESR was performed by measuring the change in the qubit spectrum as a function of ESR excitation frequency. Figure 1(c) shows the pulse sequence utilized for the microwave excitations, with the applied flux set at a constant value away from the qubit degeneracy point. Figures 3(a) and 3(b) show the ESR measurement data acquired at mK, with mT oriented along the axis of the YSO crystal. This ESR spectrum shows asymmetric peaks due to the slowed phonon-bottleneck relaxation of Er Budoyo et al. (2018b). This spectrum should also follow the standard spin Hamiltonian Abragam and Bleaney (1970)
| (3) |
where , is the nuclear magneton, is the electron spin operator, is the nuclear spin operator, is the electron g-factor tensor, is the hyperfine tensor, is the quadrupole tensor, and is the nuclear g-factor. Moreover, the two crystallographic sites have different sets of anisotropic , , and tensors. Due to these characteristics, 167Er:YSO is a prime example of materials that requires frequency- and field-dependent ESR spectroscopy for a full characterization of the spin properties. In fact, recent measurements reported slightly different 167Er:YSO , , and values Guillot-Noël et al. (2006); Chen et al. (2018); Horvath et al. (2019) depending on the measurement methods, microwave frequencies, and magnetic field directions and strengths used. Accurate values of these spin tensors are of interest due to the predicted existence of zero first-order Zeeman (ZEFOZ) transitions with significantly improved coherence McAuslan et al. (2012). Fig. 3(c) shows the simulated ESR spectrum Stoll and Schweiger (2006) of 167Er:YSO for the same field value as in Figs. 3(a). The simulation used the most recently reported spin tensor values, obtained using Raman heterodyne spectroscopy for site 1 Horvath et al. (2019) and using a tunable cavity ESR spectroscopy for site 2 Chen et al. (2018). The simulated transition frequencies and strengths show good agreement with the spectrum taken using the flux qubit. Flux qubit spectroscopy in various magnetic field orientation and strengths should contribute further in the determination of 167Er:YSO spin tensors.
The flux qubit has an area of m2 with an effective thickness Marcos et al. (2010); Toida et al. (2016) of m which yields an effective sensing volume of fl and thus spins within this volume. The optimal sensitivity of the flux qubit ESR scheme (see also the Supplementary Material) can be expressed as Toida et al. (2019)
| (4) |
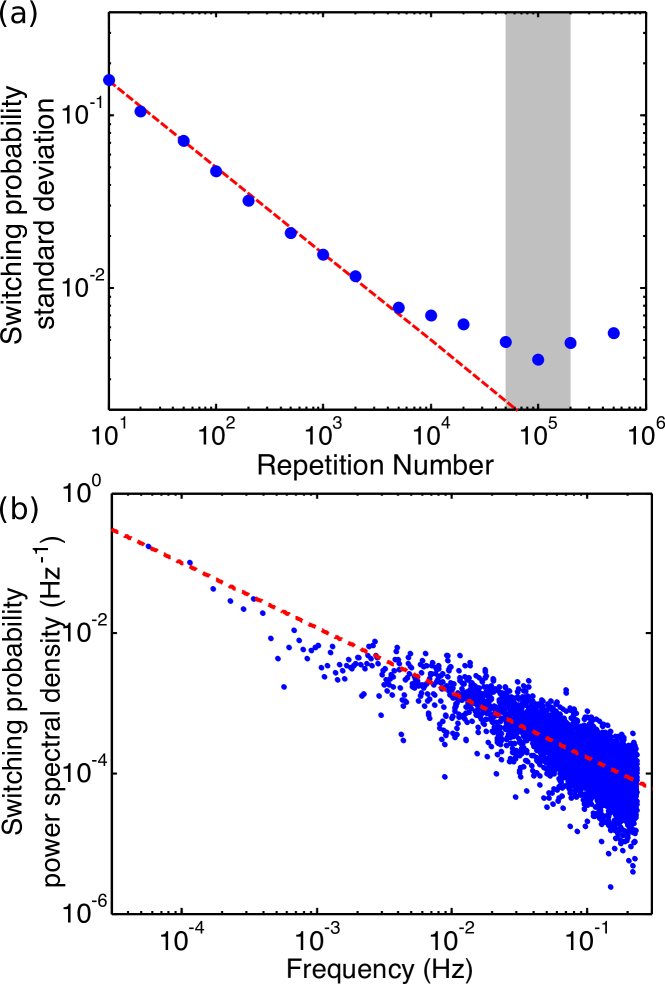
where is the JBA switching probability noise, is the measurement visibility, is the line width of the qubit spectrum, is the magnetic flux generated by a single spin, and is the change in the flux qubit’s frequency from the spin magnetization. In the standard flux qubit spectroscopy scheme, optimal values for and MHz at temperatures below 100 mK. The spin polarization detection measurement enables to be derived. To estimate , several hundred sequential measurements of switching probability were performed with varying repetition numbers at similar bias conditions to those used in the ESR spectroscopy where . Figure 4(a) shows the resulting switching probability standard deviation as a function of with a repetition time of 10 s. For low values, the standard deviation follows the binomial standard deviation that approaches a constant value of at large . Assuming , a typical repetition time between 5 and 20 s infers a sensitivity of about 20 spins in a 1 second measurement.
This performance represents nearly three orders of magnitude improvement than the spin sensitivity for the JBA ESR Budoyo et al. (2018a). Direct comparison between the flux qubit ESR and JBA ESR can be made by comparing Fig. 3(b) and Fig. 3(d), which is the ESR spectrum of the same Er:YSO sample obtained using the same JBA taken at the same magnetic field and temperature. Both spectra show the same general structure, but the flux qubit-obtained spectrum can resolve more spin transitions as would be expected from a more sensitive measurement scheme. More significantly, the 20 spin sensitivity value also corresponds to an order of magnitude improvement than the sensitivity determined from the flux qubit ESR using the dc-SQUID switching readout Toida et al. (2019). Since the repetition rate in the current measurement is about 20 times faster than the repetition rate using the dc-SQUID, a factor improvement in sensitivity is expected by changing the readout scheme. The other sensitivity improvements arose from the greater visibility with the JBA readout in comparison to dc-SQUID switching readout, as well as the qubit’s narrower line width.
To understand the limiting factor for at large , a continuous measurement of was performed for approximately 7 hours. Figure 4(b) shows the Welch power spectral density calculated from the resultant data where slow drifts due to any changes in the measurement environment (effective spin temperature or ambient field) are accounted for. This noise spectrum shows a (flicker) noise behavior given by
| (5) |
where is the noise level at 1 Hz with a best fit value of [red dashed line in Fig. 4(b)]. Flicker noise behavior is commonly seen in the flux noise of SQUIDs Wellstood, Urbina, and Clarke (1987); Anton et al. (2013); Kumar et al. (2016) and superconducting qubits Yoshihara et al. (2006); Bialczak et al. (2007); Bylander et al. (2011) with a typical of 0.9, and a 1 Hz noise level of /Hz. The presence of flicker noise limits the minimum detectable signal McDowell, Ren, and Yang (2008) in a sensor and thus causes saturation of in Fig. 4(a). Assuming originates from flux noise, the flicker flux noise level in the JBA SQUID loop can be estimated as /Hz. Since this noise level is consistent with previously reported values for SQUIDs and flux qubits, it can be surmised that the ESR sensitivity of this setup is limited by the flux noise from the SQUID. The qubit’s flux noise can also be independently measured using Ramsey interferometry Yan et al. (2012) and dissipation spectral analysis methods Bylander et al. (2011); Yan et al. (2013), with similar noise levels. As qubit flux noise contributes to in Eq. 4Yoshihara et al. (2006); Bylander et al. (2011), it also limits the sensitivity.
Although the sensitivity is comparable to the best values for superconducting devices, several approaches to further improve the sensitivity can be identified. For instance, surface spins are thought to contribute to flux noise Sendelbach et al. (2008); Kumar et al. (2016); de Graaf et al. (2017) and surface treatments have been shown to reduce their noise level in some SQUIDs Kumar et al. (2016). Furthermore, the sensitivity quantified in Eq. 4 depends on the noise level in the switching probability and also , which can be reduced by optimizing the JBA design and bias level. Longer-lived flux qubits Stern et al. (2014); Yan et al. (2016); Abdurakhimov et al. (2019) have reduced but also smaller persistent current . Thus, it remains as a future work whether such qubits improves the sensitivity. Additionally, implementation of alternate flux qubit readout schemes such as the commonly used dispersive readout with parametric amplification Lin et al. (2013) can be explored for possible sensitivity improvements.
In summary, an improvement in the sensitivity of ESR is demonstrated using a flux qubit that is readout via a Josephson bifurcation amplifier which enables the detection of an estimated 20 spins in 1 second measurement. More fundamentally this sensitivity is found to be limited by the intrinsic flux noise of the dc-SQUID loop of the JBA.
See the Supplementary Material for the comparison between the ESR signal detected by flux qubit with the ESR signal detected using a conventional cavity ESR spectrometer, and their dependences to the relaxation time and coherence time of the detected spins.
The authors thank I. Mahboob for valuable discussions and critical reading of the manuscript and W. J. Munro and Y. S. Yap for valuable discussions. This work was supported by CREST (JPMJCR1774), JST.
References
- Ranjan et al. (2020) V. Ranjan, S. Probst, B. Albanese, T. Schenkel, D. Vion, D. Esteve, J. Morton, and P. Bertet, arXiv:2002.03669 (2020).
- Bienfait et al. (2017) A. Bienfait, P. Campagne-Ibarcq, A. H. Kiilerich, X. Zhou, S. Probst, J. J. Pla, T. Schenkel, D. Vion, D. Esteve, J. J. L. Morton, K. Moelmer, and P. Bertet, Phys. Rev. X 7, 041011 (2017).
- Wiemann et al. (2015) Y. Wiemann, J. Simmendinger, C. Clauss, L. Bogani, D. Bothner, D. Koelle, R. Kleiner, M. Dressel, and M. Scheffler, Appl. Phys. Lett. 106, 193505 (2015).
- Chen et al. (2018) Y.-H. Chen, X. Fernandez-Gonzalvo, S. P. Horvath, J. V. Rakonjac, and J. J. Longdell, Phys. Rev. B 97, 024419 (2018).
- Toida et al. (2016) H. Toida, Y. Matsuzaki, K. Kakuyanagi, X. Zhu, W. J. Munro, K. Nemoto, H. Yamaguchi, and S. Saito, Appl. Phys. Lett. 108, 052601 (2016).
- Yue et al. (2017) G. Yue, L. Chen, J. Barreda, V. Bevara, L. Hu, L. Wu, Z. Wang, P. Andrei, S. Bertaina, and I. Chiorescu, Appl. Phys. Lett. 111, 202601 (2017).
- Budoyo et al. (2018a) R. P. Budoyo, K. Kakuyanagi, H. Toida, Y. Matsuzaki, W. J. Munro, H. Yamaguchi, and S. Saito, Phys. Rev. Materials 2, 011403 (2018a).
- Bal et al. (2012) M. Bal, C. Deng, J.-L. Orgiazzi, F. R. Ong, and A. Lupascu, Nat. Commun. 3, 1324 (2012).
- Toida et al. (2019) H. Toida, Y. Matsuzaki, K. Kakuyanagi, X. Zhu, W. J. Munro, H. Yamaguchi, and S. Saito, Commun. Phys. 2, 33 (2019).
- Lupaşcu et al. (2006) A. Lupaşcu, E. F. C. Driessen, L. Roschier, C. J. P. M. Harmans, and J. E. Mooij, Phys. Rev. Lett. 96, 127003 (2006).
- Vijay, Devoret, and Siddiqi (2009) R. Vijay, M. H. Devoret, and I. Siddiqi, Rev. Sci. Instrum. 80, 111101 (2009).
- Probst et al. (2017) S. Probst, A. Bienfait, P. Campagne-Ibarcq, J. J. Pla, B. Albanese, J. F. D. S. Barbosa, T. Schenkel, D. Vion, D. Esteve, K. Mølmer, J. J. L. Morton, R. Heeres, and P. Bertet, Appl. Phys. Lett. 111, 202604 (2017).
- Kakuyanagi et al. (2015) K. Kakuyanagi, T. Baba, Y. Matsuzaki, H. Nakano, S. Saito, and K. Semba, New J. Phys. 17, 063035 (2015).
- Stoll and Schweiger (2006) S. Stoll and A. Schweiger, J. Magn. Reson. 178, 42 (2006).
- Budoyo et al. (2018b) R. P. Budoyo, K. Kakuyanagi, H. Toida, Y. Matsuzaki, W. J. Munro, H. Yamaguchi, and S. Saito, Appl. Phys. Express 11, 043002 (2018b).
- Abragam and Bleaney (1970) A. Abragam and B. Bleaney, Electron Paramagnetic Resonance of Transition Ions (Oxford University Press, Oxford, 1970).
- Guillot-Noël et al. (2006) O. Guillot-Noël, P. Goldner, Y. L. Du, E. Baldit, P. Monnier, and K. Bencheikh, Phys. Rev. B 74, 214409 (2006).
- Horvath et al. (2019) S. P. Horvath, J. V. Rakonjac, Y.-H. Chen, J. J. Longdell, P. Goldner, J.-P. R. Wells, and M. F. Reid, Phys. Rev. Lett. 123, 057401 (2019).
- McAuslan et al. (2012) D. L. McAuslan, J. G. Bartholomew, M. J. Sellars, and J. J. Longdell, Phys. Rev. A 85, 032339 (2012).
- Marcos et al. (2010) D. Marcos, M. Wubs, J. M. Taylor, R. Aguado, M. D. Lukin, and A. S. Sørensen, Phys. Rev. Lett. 105, 210501 (2010).
- Wellstood, Urbina, and Clarke (1987) F. C. Wellstood, C. Urbina, and J. Clarke, Appl. Phys. Lett. 50, 772 (1987).
- Anton et al. (2013) S. M. Anton, J. S. Birenbaum, S. R. O’Kelley, V. Bolkhovsky, D. A. Braje, G. Fitch, M. Neeley, G. C. Hilton, H.-M. Cho, K. D. Irwin, F. C. Wellstood, W. D. Oliver, A. Shnirman, and J. Clarke, Phys. Rev. Lett. 110, 147002 (2013).
- Kumar et al. (2016) P. Kumar, S. Sendelbach, M. A. Beck, J. W. Freeland, Z. Wang, H. Wang, C. C. Yu, R. Q. Wu, D. P. Pappas, and R. McDermott, Phys. Rev. Applied 6, 041001 (2016).
- Yoshihara et al. (2006) F. Yoshihara, K. Harrabi, A. O. Niskanen, Y. Nakamura, and J. S. Tsai, Phys. Rev. Lett. 97, 167001 (2006).
- Bialczak et al. (2007) R. C. Bialczak, R. McDermott, M. Ansmann, M. Hofheinz, N. Katz, E. Lucero, M. Neeley, A. D. O’Connell, H. Wang, A. N. Cleland, and J. M. Martinis, Phys. Rev. Lett. 99, 187006 (2007).
- Bylander et al. (2011) J. Bylander, S. Gustavsson, F. Yan, F. Yoshihara, K. Harrabi, G. Fitch, D. G. Cory, Y. Nakamura, J.-S. Tsai, and W. D. Oliver, Nat. Phys. 7, 565 (2011).
- McDowell, Ren, and Yang (2008) E. J. McDowell, J. Ren, and C. Yang, Opt. Express 16, 6822 (2008).
- Yan et al. (2012) F. Yan, J. Bylander, S. Gustavsson, F. Yoshihara, K. Harrabi, D. G. Cory, T. P. Orlando, Y. Nakamura, J.-S. Tsai, and W. D. Oliver, Phys. Rev. B 85, 174521 (2012).
- Yan et al. (2013) F. Yan, S. Gustavsson, J. Bylander, X. Jin, F. Yoshihara, D. G. Cory, Y. Nakamura, T. P. Orlando, and W. D. Oliver, Nat. Commun. 4, 2337 (2013).
- Sendelbach et al. (2008) S. Sendelbach, D. Hover, A. Kittel, M. Mück, J. M. Martinis, and R. McDermott, Phys. Rev. Lett. 100, 227006 (2008).
- de Graaf et al. (2017) S. E. de Graaf, A. A. Adamyan, T. Lindström, D. Erts, S. E. Kubatkin, A. Y. Tzalenchuk, and A. V. Danilov, Phys. Rev. Lett. 118, 057703 (2017).
- Stern et al. (2014) M. Stern, G. Catelani, Y. Kubo, C. Grezes, A. Bienfait, D. Vion, D. Esteve, and P. Bertet, Phys. Rev. Lett. 113, 123601 (2014).
- Yan et al. (2016) F. Yan, S. Gustavsson, A. Kamal, J. Birenbaum, A. P. Sears, D. Hover, T. J. Gudmundsen, D. Rosenberg, G. Samach, S. Weber, J. L. Yoder, T. P. Orlando, J. Clarke, A. J. Kerman, and W. D. Oliver, Nat. Commun. 7, 12964 (2016).
- Abdurakhimov et al. (2019) L. V. Abdurakhimov, I. Mahboob, H. Toida, K. Kakuyanagi, and S. Saito, Appl. Phys. Lett. 115, 262601 (2019).
- Lin et al. (2013) Z. R. Lin, K. Inomata, W. D. Oliver, K. Koshino, Y. Nakamura, J. S. Tsai, and T. Yamamoto, Appl. Phys. Lett. 103, 132602 (2013).