Multiwavelength Study of an X-ray Tidal Disruption Event Candidate in NGC 5092
Abstract
We present multiwavelength studies of a transient X-ray source, XMMSL1 J131952.3+225958, associated with the galaxy NGC 5092 at detected in the XMM-Newton SLew survey (XMMSL). The source brightened in the 0.2–2 keV band by a factor of in 2005 as compared with previous flux limits and then faded by a factor of as observed with XMM-Newton in 2013 and with Swift in 2018. At the flaring state, the X-ray spectrum can be modeled with a blackbody at a temperature of 60 eV and an overall luminosity of erg s-1. A UV flare and optical flare were also detected with the Galaxy Evolution Explorer and the Sloan Digital Sky Survey, respectively, within several months of the X-ray flare, whose nonstellar UV–optical spectrum can be described with a blackbody at a temperature of K and a luminosity of erg s-1. Interestingly, mid-infrared monitoring observations of NGC 5092 with the Wide-field Infrared Survey Explorer 5–13 yr later show a continuous flux decline. These dramatic variability properties, from the X-ray through UV and optical to infrared, appear to be orderly, suggestive of a stellar tidal disruption event (TDE) by a massive black hole, confirming the postulation by Kanner et al. (2013). This TDE candidate belongs to a rare sample with contemporaneous bright emission detected in the X-ray, UV, and optical, which are later echoed by dust-reprocessed light in the mid-infrared. The black hole has a mass of , residing in a galaxy that is dominated by a middle-aged stellar population of 2.5 Gyr.
1 Introduction
A tidal disruption event (TDE) occurs when a star passes so close to a supermassive black hole (SMBH) at the center of a galaxy that the tidal force of the SMBH is able to overcome the self-gravity of the star and disrupt it. During this process, roughly half of the stellar material is accreted onto the SMBH, resulting in a flare of radiation peaking in soft X-ray and UV band, fading away on time scales of months to years (Rees, 1988). These events are a unique probe of quiescent SMBHs at the center of normal galaxies, which are otherwise difficult to detect and may contribute to the growth and evolution of SMBHs. Meanwhile, TDEs are an ideal laboratory for studying the accretion around SMBHs, as we may witness the whole process where the accretion rate varies from low to super-Eddington, which normally takes millennia or more in active galactic nuclei (AGN; e.g., Komossa, 2015). In TDEs, since the debris of the stars are accreted to the BHs from a close distance, the compact TDE disks will emit mostly X-rays. The first TDE was detected in soft X-ray in the [H II]-like nucleus of NGC 5905 (Bade et al., 1996; Komossa & Bade, 1999). The X-ray luminosity showed a variability amplitude larger than a factor of 150 within 2 yr, with an extremely soft X-ray spectrum in the high state (photon index 4). All these properties are consistent with the expectations of the TDE model. So far, only about two dozen TDEs have been discovered by the detection of their X-ray flares (e.g., Komossa & Greiner, 1999; Esquej et al., 2008; Lin et al., 2011; Saxton et al., 2012, 2017, 2019, refer to Komossa, 2015 for a recent review). The observed X-ray light curves of TDEs typically follow a power-law decline approximately by over timescales of months to years, roughly consistent with the theoretical prediction (e.g., Rees, 1988). Their X-ray spectra are mostly very soft, with power-law photon index 4–5, and can be described with blackbody emission with a temperature around 40–100 eV (corresponding to K; Komossa, 2002). There is also a class of transients that shows luminous and energetic flaring in hard X-ray and -ray bands accompanied by radio emission. Here, the rapid variability, huge X-ray peak luminosity, blazar-like spectral energy distribution (SED), and optically inactive host galaxy can all be explained by the launch of a relativistic jet following the tidal disruption of a star. TDEs with jets could provide new insight into the formation and launch of radio jets (e.g. Bloom et al., 2011; Burrows et al., 2011; Levan et al., 2011; Zauderer et al., 2011; Cenko et al., 2012; Brown et al., 2015).
In recent years, thanks to the development of high-cadence optical and UV surveys, a number of TDEs have been found as optical and UV transients on time scales of months to years (Gezari et al., 2006, 2008, 2012; Holoien et al., 2014; Hung et al., 2017; van Velzen et al., 2019; Holoien et al., 2019; see van Velzen, 2018 for a recent compilation). The optical and UV SED can normally be fitted with blackbody radiation at temperatures (1–3) 104 K (van Velzen, 2018). The origin of the optical and UV emission in TDEs is unclear yet, as the peak temperature is much lower than that expected from the canonical TDE models (e.g., 105–106 K). Current models for the optical emission mainly include (1) thermal emission from a disk (Lodato & Rossi, 2011); (2) emission during the formation of the accretion disk, in which the emission is powered by shocks from intersecting stellar debris streams (Piran et al., 2015); and (3) reprocessing of the hotter disk emission by the outer envelope, where the envelope is formed by outflow during the accretion process (Guillochon et al., 2014; Metzger & Stone, 2016) or stellar debris (Loeb & Ulmer, 1997). Only a few TDEs have contemporaneous X-ray and optical detections, e.g., ASASSN-14li (Miller et al., 2015; Cenko et al., 2016; Holoien et al., 2016), XMMSL1 J074008.2-853927 (Saxton et al., 2017), AT2018fyk (Wevers et al., 2019), AT2018zr (van Velzen et al., 2019), and ASASSN-19bt (Holoien et al., 2019). A unified, viewing-angle-dependent model has been proposed by Dai et al. (2018) for interpreting the various classes of observed TDEs. In this model, the X-ray emission, originating from the inner disk, would be obscured by the optically thick super-Eddington disk wind when viewed close to the disk plane, and optical TDEs are produced by the reprocessing of the X-ray photons. When viewing high above the disk, where the gas is optically thin to absorption, one would expect to see both the X-ray and optical/UV emission. The detection of strong Bowen fluorescence lines in the optical spectrum of several TDEs with X-ray nondetections supports this scenario (Leloudas et al., 2019).
TDEs in gas-rich environments may illuminate circum-nuclear material, and the reprocessed emission lines provide us valuable information for the study of the cores of quiescent galaxies (e.g., Komossa et al., 2008; Wang et al., 2011, 2012). If the TDE takes place in a dusty environment, most of the UV/optical photons will be absorbed by dust grains in the vicinity of the BH and reradiated in infrared (IR), which is the IR echo of TDE (Komossa et al., 2009; Dou et al., 2016, 2017; Jiang et al., 2016, 2017; Lu et al., 2016; van Velzen et al., 2016; Wang et al., 2018). The TDE research is currently hampered by the small number of known events. Many questions remain, including the event rate and luminosity function of TDEs, origin of the diversity of two classes of TDEs, how the jets form, the relation of the TDE incidence to the host galaxy, and the star forming history. To answer these questions, a large number of TDEs are needed, especially those showing X-ray flares.
The XMM-Newton SLew survey (XMMSL; Saxton et al., 2008) contains data taken with the EPIC-pn camera during slews from one pointed observation to another. In the second XMMSL catalog (XMMSL2),111https://www.cosmos.esa.int/web/xmm-newton/xmmsl2-ug 84% of the sky has been covered with a flux limit of 6 10-13 erg s-1 cm-2 and a mean exposure time of 6 s in the energy band of 0.2–2 keV. Comparison of source fluxes in the XMMSL survey with those measured in the previous ROSAT All-Sky Survey (RASS; Voges et al., 1999) performed in the 1990s has allowed the detection of five sources that are suggested to be TDEs: XMMSL1 J1115+1806 (Esquej et al., 2008), XMMSL1 J1323+4827 (Esquej et al., 2008), XMMSL1 J1201+3003 (Saxton et al., 2012), XMMSL1 J0740-8539 (Saxton et al., 2017), and XMMSL2 J1446+6857 (Saxton et al., 2019). All five of these TDEs show soft X-ray flux variations greater than a factor of 50 in optically inactive galaxies. For three (XMMSL1 J1115+1806, XMMSL1 J1323+4827, XMMSL J1201+3003) of these five TDEs, the outburst X-ray spectra are very soft, with photon index 3–4 if fitted with a single power-law. TDE XMMSL1 J0740-8539 shows both a thermal and a non-thermal component with a spectrum that may be modeled with thermal emission in the UV band, a power law with 2 dominating in the X-ray band above 2 keV, and a soft X-ray excess with an effective temperature of 86 eV. XMMSL2 J14466857 has flat X-ray flux for 100 days and then falls by a factor of 100 over the following 500 days. Throughout the evolution of the event, the X-ray spectrum can be modeled with a power law of 2.6 and may be solely due to Compton upscattering of thermal photons from the disk.
In this paper, we present the multiwavelength studies of a TDE candidate, XMMSL1 J131952.3+225958 (hereafter XMMSL1 J1319+2259), associated with the galaxy NGC 5092 at a redshift of . The X-ray source was first detected in the XMMSL survey in 2005. It was noted as a possible TDE candidate in a sample study of X-ray transients selected from the XMMSL by Kanner et al. (2013), based on variability by a factor of 10 compared to the previous RASS upper limit, though there was a lack of further compelling evidence. Its X-ray flux was found to be 240 times fainter in a pointed observation with XMM-Newton in 2013. The Sloan Digital Sky Survey (SDSS; York et al., 2000) and Galaxy Evolution Explorer (GALEX; Morrissey et al., 2005, Martin et al., 2005) observations in 2005 show that there was also an optical and UV flare in the nucleus of NGC 5092. This galaxy showed a continuous decline of the Wide-field Infrared Survey Explorer (WISE; Wright et al., 2010) infrared flux from 2010 to 2018, suggesting an infrared echo following the optical/UV/X-ray flare.
In Section 2, we describe the X-ray observations, data reduction, and analysis of XMMSL1 J1319+2259. In Section 3, we compile and study the multiwavelength observations, from IR to UV, of the nuclear and host galaxy of this source, and an optical spectral analysis is performed in Section 4. The results are summarized and discussed in Section 5. Details of the data reduction and analysis are described in Appendix.
Throughout this paper, we adopt a flat cosmology with km s-1 Mpc-1, , and . The redshift of NGC 5092 () corresponds to a luminosity distance of 100.2 Mpc.
2 X-Ray data analysis
2.1 The X-Ray Source XMMSL1 J1319+2259 and X-Ray Observations
The source XMMSL1 J1319+2259 was first detected in the soft X-ray band (0.2–2 keV) on 2005 July 15 during an XMM slew observation, with an exposure time of 4.6 s. The source position, taken from the XMMSL2 catalog, is at R.A.=, decl.= (J2000), with a position error of 8″in radius at the 68% confidence level (Saxton et al., 2008). Within this error circle, there is only one cataloged bright source (see Figure 1), the galaxy NGC 5092, at R.A.=, decl.= (Gaia Collaboration et al., 2018), with a redshift of 0.023. By analyzing the XMMSL data, we find that the source is detected only in the 0.2–2 keV soft X-ray band with a count rate of counts s-1, and has a upper limit of 1.0 counts s-1 in the 2–10 keV band, indicative of a soft X-ray spectrum. There was another slew coverage of NGC 5092 in 2002 with an exposure time of 10 s, setting an upper limit count rate of 0.4 counts s-1 ( 10-13 erg s-1 cm-2; see Section 2.1.1) in the 0.2–2 keV band. The galaxy NGC 5092 was not detected in the RASS in 1990 July, which yields an upper limit of 0.04 counts s-1 in the 0.2–2 keV band, or erg s-1 cm-2 in flux (Section 2.1.1). This sets a stringent upper limit on the X-ray luminosity of 4.2 erg s-1, indicating that NGC 5092 does not host a strong AGN.
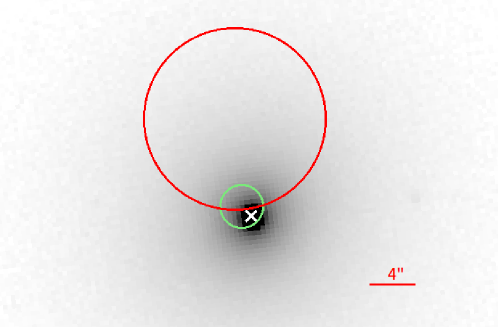
An XMM-Newton pointed observation with an exposure of 8600 s was carried out on 2013 December 21 (PI: Richard Mushotzky; ObsID=0721830301). We perform data reduction following the standard procedures with the software XMM-Newton Science Analysis System (sas version 16.0.0; Gabriel et al., 2004), and the details are described in Appendix A.1. The refined source position given in the 3XMM-DR8 (Rosen et al., 2016) is R.A.=, decl.=, with a source position error of 1.9″at the 68% confidence level (shown as green circle in Figure 1). Detailed observational information of the three detectors (pn, MOS1, and MOS2), including the good exposure time and count rates, is summarized in Table 1.
There was also an observation performed by the X-ray Telescope (XRT; Burrows et al., 2005) on board the Neil-Gehrels Swift Observatory (Gehrels et al., 2004) in 2018 August with an exposure time of 576 s, setting a upper limit of 0.005 counts s-1, or erg s-1 cm-2 assuming a power-law spectral model with modified by Galactic absorption (see Section 2.1.1). Table 1 summarizes the information of all the available X-ray observations of this source and its detection. Among the five observations, the source was detected in two, namely, the XMMSL in 2005 and the pointed XMM observation in 2013.
| Obs. Date | ObsID | Mission/Ins. | Exposure | Energy Band | Count Rate | Unabs. Flux |
|---|---|---|---|---|---|---|
| (s) | (keV) | (counts s-1) | (10-13 erg s-1 cm-2) | |||
| 1990 Jul 11 | ROSAT | 337 | 0.2–2 | |||
| 2002 Jul 06 | 9047100005 | XMM/pn | 10 | 0.2–2 | ||
| 2005 Jul 15 | 9102500005 | XMM/pn | 5 | 0.2–2 | ||
| 2013 Dec 21 | 0721830301 | XMM/pn | 1467 | 0.2–2 | ||
| ′′ | ′′ | ′′ | ′′ | 2–8 | ||
| ′′ | ′′ | XMM/MOS1 | 7182 | 0.2–2 | ||
| ′′ | ′′ | ′′ | ′′ | 2–8 | ||
| ′′ | ′′ | XMM/MOS2 | 7157 | 0.2–2 | ||
| ′′ | ′′ | ′′ | ′′ | 2–8 | ( | |
| 2018 Aug 24 | 03106172001 | Swift/XRT | 576 | 0.2–2 |
Note. — The unabsorbed fluxes with error and upper limits are estimated using xspec as described in Section 2.1.1.
2.1.1 X-Ray Spectral Analysis
Here we perform spectral analysis for the XMMSL and XMM pointed observation using xspec (version 12.9.1; Arnaud, 1996). We extract photons detected in the range of 0.2–10 keV, where the data are best calibrated and are in the most sensitive range for XMM-Newton EPIC cameras. For the XMM pointed observation, the MOS1 and MOS2 spectra are combined, taking into account the responses, background, and ancillary files. The combined MOS and the pn spectrum are jointly fitted in all the analyses below. Given the small number of photons of the detections, the combined MOS spectrum is binned with a minimum of three counts per bin, and the pn spectra in the XMMSL and XMM pointed observation are binned to have only one photon per group in 0.2–10 keV, and the C-statistic is used for the fitting. The Galactic equivalent column density toward NGC 5092 is cm-2 (Willingale et al., 2013), which is always taken into account and modeled by tbabs with the element abundances set to those in Wilms et al. (2000). We find that in all the spectral fits below, no additional absorption, neutral or ionized, is required. The fitting results are summarized in Table 2. Note that the quoted uncertainties of the fitted parameters are at the 90% confidence range.
| Obs | Model | (dof) | ||
|---|---|---|---|---|
| pointed | tbabs*(zpo) | 17.5(33) | ||
| slew | tbabs*(zpo) | 8.9(11) | ||
| ′′ | tbabs*(zbb) | 9.2(11) | ||
| ′′ | tbabs*(zpo+zbb) | 2.1(fixed) | 9.2(11) |
Note. — All fits include absorption by Galactic column (model tbabs, =1.22 atoms cm-2, abundances from Wilms et al., 2000). For the XMMSL spectrum, while fitted with model tbabs*(zpo+zbb), parameters of the power law model are fixed at values from XMM pointed spectrum fitting. Errors are at 90% confidence level.
For the XMM pointed observation, a power law modified by Galactic absorption, tbabszpowerlaw, provides an acceptable fit to the pn+MOS spectrum with a photon index . The corresponding unabsorbed (corrected for Galactic absorption) 0.2–2 keV flux is erg s-1 cm-2, with a rest-frame luminosity of erg s-1. The Eddington ratio is estimated to be (, please refer to Section 4 for the BH mass estimation). We note that this value should be an upper limit, as the emission from the host galaxy may significantly contribute to the detected flux at such a low luminosity level.
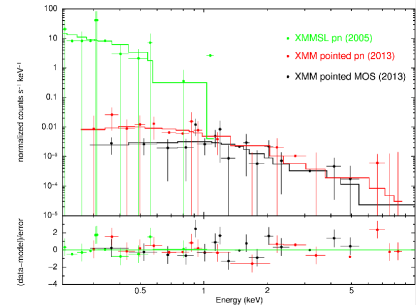
For the pn spectrum taken in the XMMSL observation, which is very soft, we first try two simple models of the source emission: a power law (zpowerlaw) and a blackbody (zblackbody). The blackbody model provides a good fit to the data, yielding a temperature of eV, which is consistent with measurements from previous TDEs (e.g., Komossa, 2002). In the rest-frame keV band, the unabsorbed flux is erg s-1 cm-2, corresponding to a luminosity of erg s-1, and thus an Eddington ratio . The overall luminosity of the blackbody emission is erg s-1 (). A power-law model also gives an equally good fit with . We also try to fit the spectrum with a blackbody plus a power-law model, but find that the addition of a power law component does not improve the fit. Figure 2 shows the two X-ray spectra and model fits. The spectrum became harder from 2005 to 2013, and the flux dropped by a factor of 240.
For the nondetections in the remaining observations, the flux limits are estimated (see Table 1) by assuming the source spectra to be the same as those found in the XMM pointed observation, since the source appeared to be at a low state in all these observations.
2.1.2 X-Ray light curve
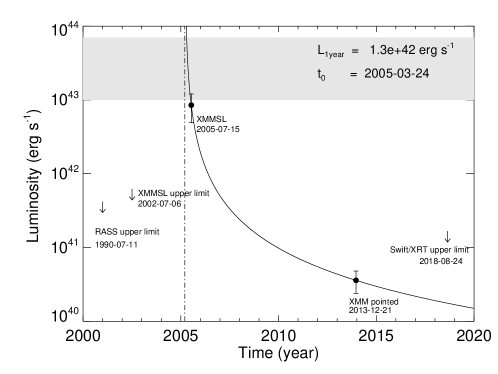
The obtained unabsorbed 0.2–2 keV fluxes and upper limits are plotted in Figure 3. The flux increased by a factor of more than 20 in 2005 compared to the RASS observation and then dropped by a factor of 240 from 2005 to 2013 as observed in the XMM pointed observation, remaining in a low state till the Swift observation in 2018. Though the data points are scarce, such a large-amplitude X-ray flare resembles those of the known X-ray-selected TDEs (see Komossa, 2015 for review). In the process of tidal disruption, the X-ray flare is ignited when the most bound material returns to the pericenter after completing one orbit. Assuming that the material is uniformly distributed in the disrupted stellar debris, as demonstrated by numerical simulations, the mass fallback rate after one post-disruption orbit is
| (1) |
where is the time at which the disruption process occurs (Evans & Kochanek, 1989; Ayal et al., 2000). The X-ray radiation power is assumed to evolve following this law. Assuming that this is a TDE and the debris evolution follows the above fallback model, the luminosity declines following the canonical law
| (2) |
where is the luminosity 1 yr after the disruption occurring at . The two parameters, and can be determined by using the two detected data points (luminosities), giving erg s-1 and , i.e. the disruption time is somewhere around 2005 February to April. Assuming that the flux begins to decrease at an epoch from about 1 to 3 months after the disruption,222This has been observed to be the case for TDEs detected in the optical/UV band (Stone et al., 2013, van Velzen et al., 2019), and we assume that the X-ray rising and peaking timescales are comparable to those of the optical/UV flares. the derived peak luminosity in keV is in the range of (1–7) erg s-1. We note that the X-ray properties of this variable source, the amplitude of the flare, the very soft spectral shape, and the peak luminosity are typical of the TDEs known so far.
3 Optical, UV, and infrared data analysis
The galaxy NGC 5092 was covered in several surveys, e.g., the All-sky Imaging Survey (AIS) conducted by GALEX in UV, the SDSS in optical, the Two-Micron All Sky Survey (2MASS; Skrutskie et al., 2006) in near-infrared (NIR), and the all-sky survey performed by WISE in mid-infrared (MIR). The galaxy was also observed by the optical/UV instruments onboard the XMM-Newton and Swift during the X-ray pointed observations. An optical spectrum was taken in the SDSS in 2008. Information of the multiwavelength observations, from far-UV (FUV) to IR, and the photometry results are summarized in Table 3. In this section, we describe the data reduction and analysis, and some of the technique details can be found in Appendix A for each of the instruments.
| Obs. Date | Survey or Mission | Filter | Exposure (s) | Magnitude | Aperture (arcsec) |
|---|---|---|---|---|---|
| 2007 May 6 | GALEX | FUV | 108 | 20 | |
| 2005 May 28 | GALEX | NUV | 108 | 20 | |
| 2005 Jun 11 | GALEX | NUV | 90 | 20 | |
| 2007 May 6 | GALEX | NUV | 106 | 20 | |
| 2018 Aug 24 | Swift (UVOT) | UW1 | 288 | 20 | |
| 2018 Aug 24 | Swift (UVOT) | 274 | 30 | ||
| 2013 Dec 21 | XMM (OM) | 5000 | 20 | ||
| 2005 Mar 10 | SDSS DR7 | 54 | 30 | ||
| 2005 Mar 10 | SDSS DR7 | 54 | 35 | ||
| 2005 Mar 10 | SDSS DR7 | 54 | 35 | ||
| 2005 Mar 10 | SDSS DR7 | 54 | 35 | ||
| 2005 Mar 10 | SDSS DR7 | 54 | 35 | ||
| 2005 Apr 2 | SDSS DR7 | 54 | 30 | ||
| 2005 Apr 2 | SDSS DR7 | 54 | 35 | ||
| 2005 Apr 2 | SDSS DR7 | 54 | 35 | ||
| 2005 Apr 2 | SDSS DR7 | 54 | 35 | ||
| 2005 Apr 2 | SDSS DR7 | 54 | 35 | ||
| 1999 Jun 8 | 2MASS | 355 | 30 | ||
| 1999 Jun 8 | 2MASS | 355 | 30 | ||
| 1999 Jun 8 | 2MASS | 355 | 30 |
Note. — This table gives the aperture photometric magnitude of the whole galaxy in multiple bands within the apertures of radii listed in the last column. All the magnitudes are in the AB magnitude system.
3.1 Optical imaging and photometric data analysis
3.1.1 SDSS Imaging Data
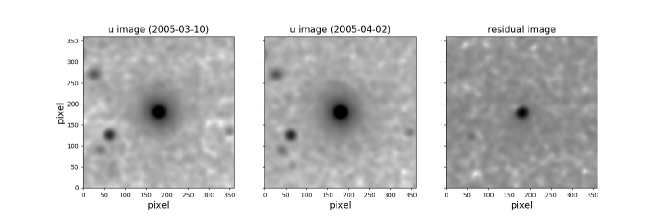
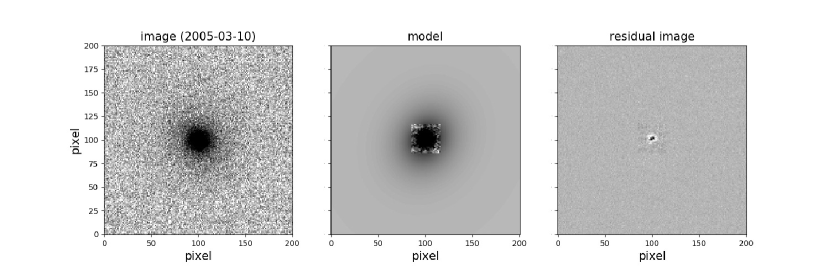
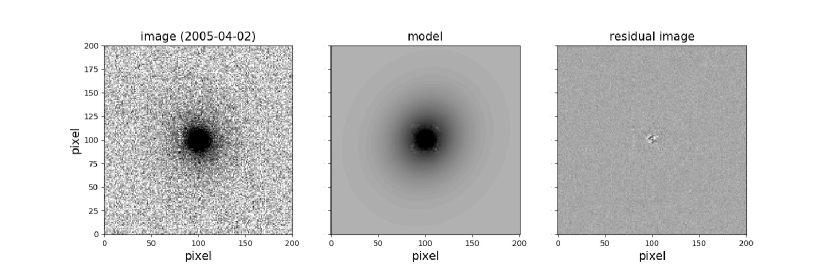
NGC 5092 was observed for broadband photometric imaging in the bands in the SDSS on 2005 March 10 (run 5183, camcol 6, field 441) and 2005 April 2 (run 5224, camcol 1, field 299). The detailed data analysis can be found in Appendix A.2.1 and the obtained magnitudes of the galaxy are listed in Table 3. The two SDSS imaging observations, performed near the inferred epoch of the tidal disruption, can also be used to examine any possible optical flare using the image subtraction method. Compared to the 2005 March 10 images, there is a clear excess in the core of the galaxy in the 2005 April 2 images, indicating a brightening, and thus a non-stellar process in the nuclear region (see Figure 4). To quantify this possible flare, we decompose the nuclear emission from the host galaxy for the drC images using the 2D imaging analysis tool galfit (Peng et al., 2002). Figure 5 shows, for the band as demonstration, the resultant model and residual images from the image decomposition, as well as the radial profiles of the surface brightness and their model components of the galaxy. The fitted parameters of the nuclear emission (point-spread function [PSF]) and the galactic components are summarized in Table 4. The fitted positional offset of the flare and the nucleus is only subpixel (0.396″per pixel), or less than 150 pc. We thus consider the optical flareto have most likely originated from the central SMBH. Please refer to Appendix A.2.1 for the details of the image subtraction and decomposition.
| PSF_mag | Srsic_mag | Srsic_re | Exp’t_mag | Exp’t_rs | |||
|---|---|---|---|---|---|---|---|
| Obs | Filter | (mag) | (mag) | (arcsec) | (mag) | (arcsec) | |
| (1) | (2) | (3) | (4) | (5) | (6) | (7) | (8) |
| 5224 | 15.93 | 16.34 | 0.91 | 15.90 | 6.70 | 1.02 | |
| 5183 | 16.26 | … | … | … | … | 1.03 | |
| 5224 | 15.97 | 13.98 | 7.58 | 14.82 | 9.12 | 0.45 | |
| 5183 | 16.12 | … | … | … | … | 0.34 | |
| 5224 | 16.29 | 12.97 | 9.76 | 14.33 | 9.95 | 0.26 | |
| 5183 | 16.30 | … | … | … | … | 0.27 | |
| 5224 | 16.72 | 12.70 | 8.18 | 13.62 | 10.32 | 0.26 | |
| 5183 | 16.77 | … | … | … | … | 0.27 | |
| 5224 | 16.88 | 12.42 | 8.34 | 13.48 | 9.27 | 0.65 | |
| 5183 | 17.21 | … | … | … | … | 0.66 |
Note. — Column(1): SDSS observation ID, 5224 for observation on 2005 April 2, 5183 for observation on 2005 March 10. Column (2): SDSS filter. Column (3): integrated magnitude of the PSF component. Column (4): integrated magnitude of the Srsic component. Column (5): effective radius of the Srsic component. Column (6): integrated magnitude of the exponential disk component. Column (7): scale length of the exponential disk component. Column (8): best for fitting. The magnitudes are not corrected for Galactic extinction.

3.1.2 XMM OM and Swift UVOT data
During the XMM-Newton observation in 2013, the source was also observed with the Optical/UV Monitor (OM; Mason et al., 2001) in image mode using the filter, which is centered at 3440 Å. The observation was split into five parts with exposures of 1120s in length for each. We present the detailed analysis in Appendix A.2.2 and summarize the photometric results in Table 5 for each exposure. We then take the mean and standard deviation of the five exposures as the aperture AB magnitude measurement of the galaxy, which is .
| ExpID | Duration (s) | Source Counts | Source_corr_factor | Bkg Counts | Bkg_corr_factor | Mag |
|---|---|---|---|---|---|---|
| (1) | (2) | (3) | (4) | (5) | (6) | (7) |
| S006 | 1120 | 46094 215 | 1.1 | 20437 143 | 1.1 | 15.66 0.01 |
| S401 | 1120 | 45958 214 | 1.1 | 20487 143 | 1.1 | 15.68 0.01 |
| S402 | 1120 | 46262 215 | 1.1 | 20959 145 | 1.1 | 15.67 0.01 |
| S403 | 1120 | 45603 214 | 1.2 | 20602 144 | 1.1 | 15.67 0.01 |
| S404 | 1120 | 46049 215 | 1.1 | 20562 143 | 1.1 | 15.66 0.01 |
Note. — Column (1): identification of each exposure. Column (2): duration of each exposure, in unit of second. Column (3): source counts in a circular with radius of 20″, measured by DS9 tool. Column (4): source correction factor for coincidence loss taken from the relevant exposure SWSRLI files. Column (5): background counts in a circular region with radius of 20″. Column (6): background correction factor for coincidence loss taken from the relevant exposure SWSRLI files. Column (7): magnitude calculated with the corrected source and background count rates in each exposure.
The Ultraviolet/Optical Telescope (UVOT; Roming et al., 2005) observations were obtained in (3465 Å) and UVW1 (2600 Å) (Poole et al., 2008) bands in image mode during the Swift observation in 2018. We measure the aperture magnitude using the UVOT software task uvotsource and present the results in Table 3. Compared to the SDSS observation in 2005, the source was about 1 magn fainter in the band.
3.2 GALEX UV data
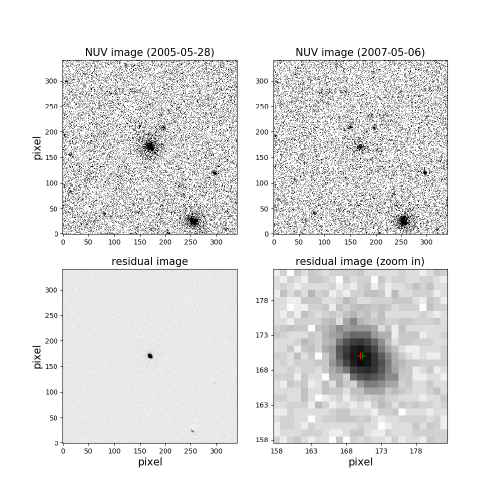
The galaxy NGC 5092 was also imaged and detected by GALEX three times in near-UV (NUV, 1771–2831 Å) on 2005 May 28, 2005 June 11, and 2007 May 6 and once in FUV (1344–1786 Å) on 2007 May 6. The NUV imaging observations, performed from just a few months to two years after the tidal disruption, provide valuable data to examine any UV radiation of the nucleus possibly associated with the X-ray flare. We perform image subtraction on the calibrated NUV images between the 2005 May and 2007 observations and find the nuclear emission to be much brighter in 2005 than in 2007 (see Figure 6), indicating an NUV flare originating from the activity of the SMBH, likely associated with the X-ray flare. To quantify the amplitude of the variability, the fluxes of the entire galaxy are measured from the reduced images by using gPhoton (Million et al., 2016) tool gAperture, with a photometry aperture of 20″. The aperture magnitudes for all the three NUV observations and the one FUV observations are presented in Table 3. Compared to the 2007 observation, the source was brighter by 3 mag in the NUV band in 2005. Details of the aperture photometry and image subtraction are described in Appendix A.3.
3.3 UV-Optical flare
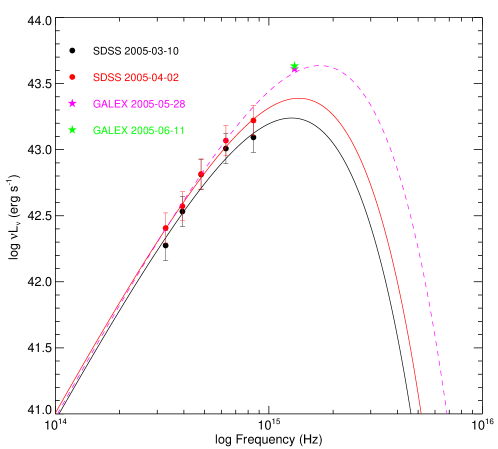
Figure 7 shows a summary of the photometric results of the galaxy NGC 5092 obtained above taken in various optical and UV bands (without Galactic extinction correction). Clearly, the GALEX NUV and optical () fluxes dropped significantly by about 3 and 1 mag, respectively,333Although the bandpasses of three filters SDSS-, OM-U and UVOT-U are not the same, we find that differences among their measured magnitudes are less than 0.2 by comparing stars in the fields of view of the observations. on timescales of a few years or longer. Now we study the quasi-simultaneous optical-UV spectra of the flare, which were taken 1–2 months apart. The optical luminosities of the galactic nucleus are calculated at the central frequencies of the five SDSS filters. To do this, the PSF fluxes derived from the 2D image decomposition in Section 3.1.1 are used for the 2005-03 and 2005-04 observations, which are assumed to be dominated by the flare emission. The resulting optical spectra of the flare at the two epochs are shown in Figure 8. The two spectra can be well fitted with a blackbody model with temperatures of 1.6 K (2005-03) and 1.7 K (2005-04) (90% uncertainties), respectively. The relatively large uncertainties are due to the fact that the peak or turnover of the spectrum is not sampled by observations.

We also calculate the ultraviolet luminosity of the flare from the GALEX NUV photometry by subtracting the galaxy contribution, which is estimated from the SED fitting of the galaxy starlight (see Section 5.4). The luminosities at 2305 Å for the 2005-05 and 2005-06 observations are overplotted in Figure 8. Assuming that the luminosities did not vary significantly between 2005-04 and 2005-05, we fit jointly the optical and NUV luminosities with a single blackbody, resulting in a temperature of 2.4 K. A powerlaw can also give a good fit to the data, with 0.2. Thus, the observed optical–UV flare emission around March–April, if assumed to be a blackbody, had a temperature of (1–2) K, consistent with those in previously reported optical TDEs (van Velzen, 2018). The integrated optical–UV luminosities, from 100 to 10000 Å, of the flare are estimated to be around (2–6) erg s-1, corresponding to an Eddington ratio of (3–9) .
We note that the possible existence of a weak, AGN-like activity in the galaxy cannot be ruled out (see Section 4), which might contribute to the PSF fluxes. While in band, the whole galaxy in 2005 April was about 1 mag brighter than that in the UVOT observation in 2018, suggesting that the PSF flux in at least the -band must be dominated by the flare. The blackbody temperature calculated by using only the band PSF flux in 2005 April and the NUV in 2005 May is 35,000 K, also in the range of those previously reported TDEs.
3.4 WISE and 2MASS
In the MIR band, NGC 5092 was bright enough to be detected in a single exposure with WISE in the (3.4 m) and (4.6 m) bands. We analyzed the WISE observational data for NGC 5092, which were taken from 2010 to 2018, and extracted light curves with 12 time bins in the two wavebands. The details of the data analysis are described in Appendix A.4. The MIR light curves are overplotted in Figure 7, which show a trend of fading over a time span of about 6 yr, and appear to remain mostly constant in the observations of the last several epochs. To estimate the contribution from the host galaxy, we consider the last five epochs for and the last one epoch for as the quiescent state, which have averaged magnitudes of and . Assuming that the emission in the and bands originates from a blackbody, we calculate the temperatures in each epoch using the host-galaxy-substracted fluxes. We find that the temperatures spread in the range of 600–1500 K, consistent with those of the previously reported TDE IR echoes (Komossa et al., 2009; Dou et al., 2016, 2017; Jiang et al., 2016, 2017; van Velzen et al., 2016; Wang et al., 2018). We also obtained the NIR images from 2MASS and measured the aperture magnitudes as shown in Table 3.
4 Optical spectral analysis
An optical spectrum of NGC 5092 was obtained by the SDSS on 2008 February 11, which is about 3 yr after the optical/UV flare. The fiber was centered at the nucleus of the galaxy with a radius of 3″. Figure 9 shows the spectrum of NGC 5092, which is dominated by host starlight. There seem to be no apparent emission lines in this spectrum by visual check. Hence, it necessitates proper model and subtraction of the stellar continuum to examine possible weak emission-line features. Generally, we conducted the continuum fitting following the procedures described in Zhou et al. (2006); for details see Appendix A.5.1. As shown in figure 9, the galaxy starlight model (orange) gives a reasonable fit to the optical spectrum (black), with a dominant middle-aged stellar population of 2.5 Gyr. The best-fit stellar velocity dispersion is km s-1 (corrected for instrumental broadening of 56 km s-1 as measured from arc spectra and tabulated by the SDSS). We can thus estimate the mass of the central BH of the galaxy from using the formalism of Ferrarese & Ford, 2005:
| (3) |
yielding .
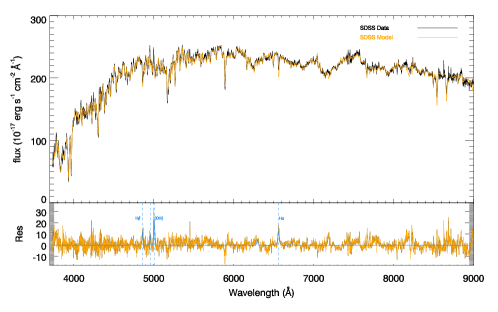
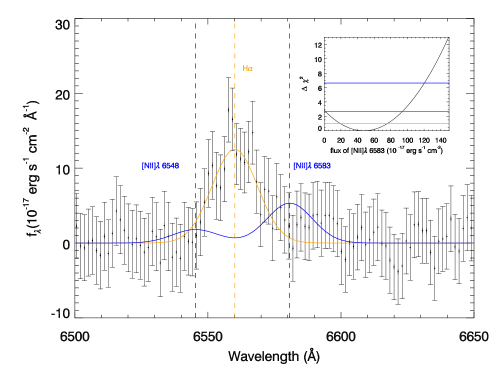
After removing the continuum, several narrow emission lines, including [O III] and Balmer lines, are found in the residual spectrum, and no broad-line features are detected. The fitting methods are detailed in the Appendix A.5.2. Among these emission lines, [O III] and H are detected with a signal-to-noise ratio (S/N) of ¿ 3, and H is marginally detected with S/N 2.4. Note that, apart from the statistical uncertainty in the line fitting, the uncertainty introduced by continuum subtraction has also been considered in the estimation of S/N; for details see Appendix A.5.2. The line measurements, including the fluxes and equivalent widths (EWs), are summarized in Table 6, and the EWs are consistent with those given by MPA-JHU catalogs444https://www.sdss.org/dr14/spectro/galaxy_mpajhu/ based on the methods of Brinchmann et al. (2004), Kauffmann et al. (2003a), and Tremonti et al. (2004), e.g., versus for EW ([O III]), versus for EW (H).
| [O III] | H | H | [N II] | [S II] | [S II] | |
|---|---|---|---|---|---|---|
| Flux (10-17 erg s-1 cm-2)a | 382.4 78.8 | 268.5 78.8 | 186.2 78.8 | 94.2 | 54.2 | 126.0 |
| Equivalent width (Å)b | 1.8 0.4 | 1.1 0.3 | 0.9 0.4 | 0.4 | 0.2 | 0.6 |
Note. — a Fluxes or 90% upper limits of the emission lines after subtracting the starlight (please refer to Appendix A.5.2 for the details of the measurements). b Equivalent widths (EWs) of the emission lines after correcting stellar absorption.
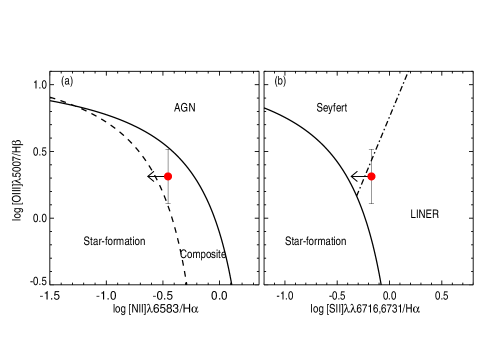
The narrow-line diagnostic diagram, the so-called BPT diagram (Baldwin et al., 1981), is used to investigate the mechanism of the line emission. As [N II] and [S II] are not robustly detected, their flux upper limits (see Appendix A.5.3 for details) are adopted to calculate the line ratios. The locations of NGC 5092 on the diagram of [O III]/ H [N II]/H and [O III]/ H [N II]/H are shown in Figure 10. As can be seen, the location of the line ratios of NGC 5092 is close to the boundaries among the AGN, low-ionization nuclear emission-line region (LINER), and star-formation regions. Given the relatively large uncertainties of the line ratios due to the weakness of the lines, a reliable classification of emission line mechanism is hard to achieve, though the [O III]/H-[N II]/H diagram may hint at LINER.
5 Discussion
5.1 XMMSL1 J1319+2259: A TDE in NGC 5092
The X-ray source XMMSL1 J1319+2259 with a 0.2–2 keV luminosity of erg s-1 as detected in the XMMSL in 2005 July, brightened by a factor of as compared with the previous RASS upper limit, and faded to a flux 240 times fainter when it was reobserved 8 yr later. The X-ray spectrum of the flare is very soft and can be described with a blackbody at 60 eV, with an overall luminosity of erg s-1. The features are hardly explained by a supernova but resemble those of X-ray TDEs reported previously. Assuming a t-5/3 law of flux decline characteristic of TDEs, the disruption time is derived to be around 2005 February to April, and the 0.2–2 keV peak luminosity around (1–7) erg s-1, assuming that the flux began to decrease from 1 to 3 months after the disruption. Interestingly enough, an optical–UV flare is also found to occur at the galactic nucleus around the epoch of the X-ray flux, suggesting their physical association. The optical–UV flare can be fitted with blackbody radiation at a temperature of (1–2) K. Assuming a spherical geometry, following the Stefan–Boltzmann law, the sizes of the optical/UV and X-ray emission regions are around 100 and several , respectively, where is the gravitational radius (), for the derived BH mass of from the – relationship. Besides, the continuous decline in the MIR fluxes of the galaxy in the WISE and bands from 2010 to 2018 can be naturally attributed to the dust-reprocessed light of the flare at higher energy bands (Jiang et al., 2016; Lu et al., 2016; van Velzen et al., 2016). All these features are characteristic of TDEs observed previously, which we consider to be the most likely interpretation for this object, albeit the sparse data sampling.
The X-ray emission as observed with XMM-Newton in 2013 had a much lower luminosity of erg s-1 and the spectrum became much harder with . At such a low luminosity level, the contribution from the host galaxy may not be negligible. Assuming that only 10% of the observed flux comes from the TDE process, the derived tidal disruption time would be around 2006-06 and the derived peak luminosity in 0.2–2 keV is erg s-1. Although the derived disruption time might be later than the optical/UV brightening, we note that it is subject to large uncertainty, as it depends on the estimation of the flux and the assumed decline law. XMMSL1 J1319+2259 is a rare example of a TDE candidate that shows contemporaneous X-ray and optical flares, while the majority of observed TDEs were detected either in optical/UV or in X-ray. According to Dai et al. (2018), the diversity could be interpreted by a unified model where the spectral properties of the TDE depend mainly on the viewing angle with respect to the orientation of the disk.
5.2 AGN variability?
Although all the observed properties of XMMSL1 J1319+2259 and its associated multiwavelength flares are typical of the previously reported TDEs, the possibility of AGN variability may not be ruled out completely, due to the possible existence of weak nuclear activity in the host galaxy, as revealed from the ratios of the weak emission lines shown in the optical spectrum of the galaxy. Radio emission, which is commonly used to be an important diagnostic of AGN activity, is not detected in NGC 5092 either in the Faint Images of the Radio Sky at Twenty cm (FIRST; White et al., 1997) or in the NRAO VLA Sky Survey (Condon et al., 1998) database, with the upper limit given by FIRST to be 0.2 mJy. We note that the X-ray emission of NGC 5092 at the nonflaring states is rather weak, e.g. erg s-1 from the XMM-Newton pointed observation in 2013. Such a luminosity is comparable to typical X-ray emission from inactive galaxies, which can be estimated from the NIR fluxes (2MASS bands) to be erg s-1, with a standard deviation of 0.5 dex, using the X-ray–NIR luminosity relation for early-type galaxies (Ellis & O’Sullivan, 2006). This sets a strong constraint that even if there exists a nuclear activity in NGC 5092, it has to be rather weak. This is also supported by the color from the WISE measurements, which indicates the lack of a strong AGN in NGC 5092.
However, analysis of the optical spectrum taken in 2008, about 3 yr after the disruption event, shows that NGC 5092 may be located in the Seyfert/LINER regime in the BPT diagram, although the classification is rather uncertain owing to the large uncertainties in the measured line ratios. Assuming that the narrow emission lines, [O III] and H, are from the persistent weak AGN radiation, the expected AGN luminosity is erg s-1, comparable to that measured with the XMM-Newton observation in 2013, based on the relation between the X-ray luminosities and optical emission lines for local AGNs555Please note that although the correlations between X-ray and optical emission lines are of relatively large scatter, the luminosity in the XMM-Newton pointed observation in 2013 is comparable to that expected from the best-fit correlations. (Panessa et al., 2006). Thus, the possibility cannot be ruled out that this galaxy hosts a weak AGN. However, the very soft X-ray spectrum at the flaring state () as well as the spectral hardening with time, is typical of TDEs rather than AGNs. Furthermore, those weak emission lines ([O III] and H) are found to be relatively broader (FWHM900 km s-1) than those of most of AGNs (Zhang & Hao, 2018), which may be explained as originating from the TDE process. In this work we argue that the observed flare in the X-ray and multiple wavebands originated most likely from a TDE, although an extreme AGN variability event of a possible weakly active nucleus in NGC 5092 cannot be ruled out.
5.3 Infrared echo
The WISE observations show a continuous decline in the MIR light curves as described in Section 3.4. Similar flaring and fading in the MIR light curves have also been found in several TDEs (Dou et al., 2016, 2017; Jiang et al., 2016, 2017; van Velzen et al., 2016; Wang et al., 2018), which is explained as emission from dust in the nuclear region by reprocessing the high-energy radiation of the TDE. Such an echo radiation lags the primary radiation by a delay time of approximately , assuming the central symmetric geometry of the irradiated dust, with a distance to the central source and where is the speed of light. The echo luminosity depends on the bolometric luminosity of the primary radiation and the covering factor of the dust subtended to the central source.
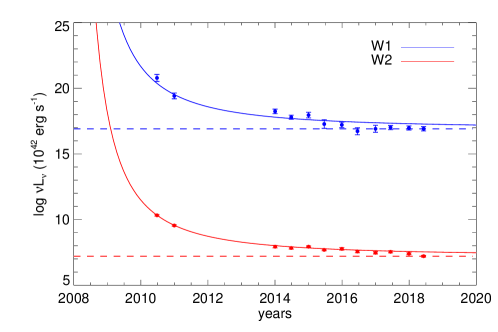
We consider the MIR light curves observed in NGC 5092 with WISE as the fading echo of dust irradiation of the TDE flaring, and we attempt to reproduce them with a simple model. We assume that the bolometric luminosity of the TDE decreases with time as as the X-ray luminosity does, and the energy absorbed by the dust is completely reradiated away. The IR luminosity is calculated as multiplied by the covering factor of the irradiated dust , with a time lag ,
| (4) |
where is the bolometric correction factor in the X-ray band of the TDE and is assumed to be constant over time. The luminosities in the and bands can be calculated by assuming the dust emission to be blackbody with an effective temperature . As described in Section 3.4, the temperatures are found to lie in the range of K. As the first-order approximation, we try to reproduce the light curves in the W1 and W2 bands by fitting them jointly with a simple model assuming a constant temperature of 1000 K. We calculate the monochromatic luminosity in the and bands as
| (5) |
where is the luminosity of the host galaxy and erg s-1 for and erg s-1 for (see Section 3.4), and is the correction factor at the frequency at the temperature . For K, the ratio between and is 0.9. From Eq. 5 we have
| (6) |
where the time lag and are both free parameters (with ). We fit the model to the and data jointly by minimizing . The best-fit parameters are yr, , and the fitting result is plotted in Figure 11. Although the model is oversimplified, it can well reproduce the observed light curves of both and , indicating that the observed MIR flare may be explained by the reradiation of TDE primary photons by dust. To obtain a better constraint on the dust distribution and richness around the BH, well-covered light curves and accurate measurement of the TDE SED are needed.
5.4 Host galaxy
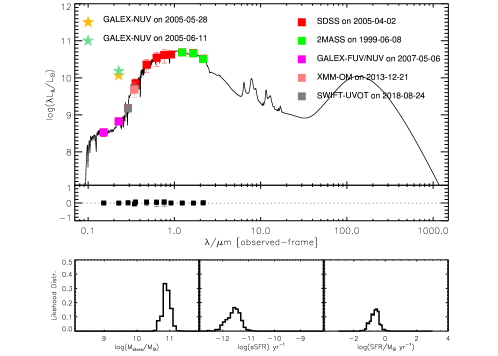
We perform host galaxy SED fitting with fluxes in bands derived by subtracting the PSF fluxes from the aperture fluxes of the SDSS 2005-04 observation. The fluxes are corrected for the Galactic extinction by employing the IDL code fm_unred.pro with (Schlegel et al., 1998), assuming the Milky Way (MW) extinction curve (Gordon et al., 2003). The code we use for galaxy SED modeling is model package Multi-wavelength Analysis of Galaxy Physical Properties (magphys), a self-contained, user-friendly model package to interpret the observed SED of galaxies in terms of galaxy-wide physical parameters pertaining the stars and the interstellar medium, following the approach described in da Cunha et al. (2008).
The galaxy SED thus obtained using the SDSS imaging photometric data only is compared with the measurements in the other bands analyzed in Section 3. It is found that all the measurements match the extrapolation of the galaxy SED well except for the two GALEX NUV fluxes in 2005, which clearly show excesses as contributed by the nuclear flare. We thus repeat the SED fitting using all the photometric data available for the galaxy except for the GALEX NUV ones. This leads to a good fit, as shown in Figure 12. The fitted stellar mass (68% conf.), and star formation rate (68% conf.). The SED modeling shows that there are five random bursts experienced by the galaxy, with the last burst of star formation ending 1.89 Gyr ago. With the relationship between black hole mass and bulge -band luminosity (Marconi & Hunt, 2003), we obtain a BH mass of using the point-source 2MASS magnitude of , with a systematic error of 0.3 dex (), which is consistent with that derived from the relationship. The optical spectral fitting shows that the starlight of NGC 5092 is dominated by a middle-aged stellar population of 2.5 Gyr.
For NGC 5092, the Lick index H, which is optimized for the stellar absorption from A stars (Worthey & Ottaviani, 1997), is Å and the EW of the H emission line after correcting the stellar absorption is Å. By analyzing the host galaxy spectra of eight optical/UV TDEs and comparing their features to the SDSS main galaxy spectroscopic sample, French et al. (2016) find that six of eight TDE host galaxies, but only 2.3% of local galaxies, have H Å, suggesting that TDEs may prefer the rare class of ‘E+A’ galaxies, which are consistent with a post-starburst history. Compared with the TDE host galaxies discussed in French et al. (2016), NGC 5092 is redder and dominated by older stellar population, with H Å. French et al. (2017) show that on the WHAN (Cid Fernandes et al., 2010) diagram, at least five of eight TDE host galaxies lie in the LINER-like region. This is not surprising owing to the possibility that interactions with the gas disk can increase the TDE rate by a factor of 10 (Kennedy et al., 2016), and NGC 5092 is also located around the LINER-like region in the WHAN diagram.
6 Summary
We present and analyze the multiwavelength photometric and spectroscopic observations of the TDE candidate XMMSL1 J1319+2259 discovered in the XMM-Newton Slew survey in 2005 July, which shows contemporaneous flaring in both X-ray and optical/UV bands. The source faded by a factor of 240 in the X-ray keV band, about 1 mag in the optical band when it was reobserved 8 yr later, and 3 mag in the NUV band 3 yr later. The X-ray spectrum of the flare is soft and can be modeled with a blackbody at with an overall luminosity of erg s-1 (). In the optical–UV band, the emission kept rising from 2005 March to 2005 June and can be modeled with a blackbody at K, with a luminosity of erg s-1 (), suggestive of an emission region of 100 in radius assuming a spherical geometry. Since the XMMSL observation in 2005 July is in the decline stage of the flare, the Eddington ratio during the UV observation in 2005 May should be . There was also a delayed continuous decline in the WISE infrared fluxes, from 5 to 13 yr after the disruption, which can be described with a simplified infrared echo model with a dust temperature of 1000 K. The host galaxy NGC 5092 is an early-type galaxy with a dominant stellar population of 2.5 Gyr, older than that of the favorable ’E+A’ type as suggested for TDE host galaxies (French et al., 2016). The mass of the central BH is estimated to be from the – relationship. Analysis of the optical spectrum taken 3 yr after the flare reveals faint emission lines, which locate the galaxy at the borderline between AGN, starburst, and LINER in classification diagrams. While this does not allow unambiguous optical classification at present, we also cannot rule out the possibility that the emission lines are actually not permanent, but were excited by the flare itself. We attribute the flare in the X-ray and optical/UV bands to a tidal disruption process, given the large-amplitude variabilities in multiple bands in the galactic nucleus and the ultra-soft outburst X-ray spectrum. XMMSL1 J1319+2259 is among the several TDEs that are detected to show bright flaring in both UV/optical and X-ray bands. Although containing few data points, TDEs discovered from archival data still provide important implications for statistical study, such as the event rate, the luminosity function, and the unification TDE model, as well as their host galaxy properties. To discover larger samples of TDE, especially in real time, future high-cadence time-domain surveys are needed, such as the Large Synoptic Survey Telescope in optical (LSST; Ivezic et al., 2008) and the Einstein Probe mission in the soft X-ray band (EP; Yuan et al., 2016a, Yuan et al., 2016b).
acknowledgements
This work is supported by the National Natural Science Foundation of China (grant NOs. 11803047, 11833007, 11873054), the gravitational wave pilot B (grant NO. XDB23040100), and the Strategic Pioneer Program on Space Science, Chinese Academy of Sciences, grant NOs. XDA15310300, XDA15052100, and we acknowledge the support from the Faculty of the European Space Astronomy Centre (ESAC). Tinggui Wang is warmly thanked for his helpful suggestions and comments. This work is mainly based on observations obtained with XMM-Newton, an ESA science mission with instruments and contributions directly funded by ESA Member States and NASA. This work also makes use of data products from ROSAT, Swift, GALEX, SDSS, WISE, and 2MASS. We use the ROSAT Data Archive of the Max-Planck-Institue für extraterrestrische Physik (MPE) at Garching, Germany. GALEX is operated for NASA by the California Institute of Technology under NASA contract NAS5-98034. WISE is a joint project of the University of California, Los Angeles, and the Jet Propulsion Laboratory/California Institute of Technology, funded by the National Aeronautics and Space Administration. 2MASS is a joint project of the University of Massachusetts and the Infrared Processing and Analysis Center/California Institute of Technology, funded by the National Aeronautics and Space Administration and the National Science Foundation. We acknowledge the use of public data from the Swift and SDSS data archive.
Appendix A Reduction and Analysis of the multiwavelength data
In this appendix, we present detailed accounts of the data reduction and analysis in the X-ray (Appendix A.1), optical (Appendix A.2), UV (Appendix A.3) and infrared (Appendix A.4). The details of the spectral analysis are described in Appendix A.5.
A.1 X-Ray data
We perform the XMM-Newton data reduction following the standard procedures with the software XMM-Newton Science Analysis System (sas version 16.0.0). XMMSL1 J1319+2259 was discovered in slew 9102500005 from XMM revolution 1025. With the slew data files (SDFs) downloaded from the XMM-Newton science archive666http://nxsa.esac.esa.int/nxsa-web, the calibrated photon event files for pn are produced with sas task eslewchain. Since the source did not suffer from pileup problems in this observation, the pn spectrum was extracted with patterns . The source spectrum has been extracted from a circle of radius and a region of the same size was used for the background. The technique described in Read et al. (2008) was used to create the ancillary file, and the canned response file was used for the redistribution matrix.
The XMM-Newton pointed observation was carried out on 2013 December 21, with all the three XMM-Newton EPIC cameras operating in the Full Frame (FF) mode and the thick filter in place. With the observation data files (ODFs), the calibration files and calibrated photon event files for pn and MOS are produced with the tasks epchain and emchain. Source photons are extracted from a circular region with a radius centered on the object, and background counts from a circular source-free region on the same CCD chip. High background periods (count rates greater than 0.4/0.35 counts s-1 for the pn/MOS camera) caused by high-energy protons in orbit are filtered by creating good time intervals. The pn spectrum is extracted from X-ray events with patterns from 0 to 4 and the MOS spectra from 0 to 12. Ancillary files and response matrices are generated using the arfgen and rmfgen sas tasks, respectively.
A.2 Optical data
A.2.1 SDSS optical data
In the two SDSS observations taken on 2005 March 10 and 2005 April 2, the psField files777File with preliminary photometric calibration, as well as final PSF fit, for a single field in an imaging run, which provides the 2D reconstruction of the PSF. and the drC images888The corrected image frame, having been bias subtracted, flat-fielded, purged of bright stars, and header updated with the latest calibrations. are retrieved from the SDSS Data Archive Server999das.sdss.org/www/html/das2.html. All the SDSS drC images have a ‘soft bias’ of 1000 data numbers (DNs) added, so they can be stored as unsigned integers, as described in the SDSS image processing pipeline (Lupton et al., 2001). With the reduced drC images, the aperture fluxes of the galaxy are measured using Source Extractor (SExtractor, version 2.25.0; Bertin & Arnouts, 1996) within the aperture radii listed in the last column in Table 3, which are chosen in such a way that the surface brightness beyond the radius does not change with the radial distance to the galactic center. The image subtraction process is as follows: taking the -band images as an example, the PSF of the observed images is accessed by fitting the surface brightness of the unsaturated stars in the field of view with a two-Gaussian model, giving an FWHM (full phrase) of 147 and 158 for the 2005-03 and 2005-04 images,respectively. The images in the 2005-03 and 2005-04 observations are convolved with Gaussian profiles of FWHM=4.45″and 4.43″, respectively, to have matching PSFs, resulting in smoothed images with nearly identical PSFs of 4.59″in FWHM. The 2005-03 images are then scaled to the flux level of the 2005-04 images according to the counts measured of the nearby stars. The residual images are generated by subtracting the rescaled 2005-03 images from the 2005-04 images. The convolved images and the residual image after subtraction are shown in Figure 4. There is a clear excess in the core of the galaxy in the 2005-04 image compared to that in 2005-03, indicating brightening of the optical light, and thus a nonstellar process in the nuclear region.
To quantify this optical flaring emission, we decompose the nuclear emission from the host galaxy for the drC images using the 2D imaging analysis tool galfit (Peng et al., 2002). The exact information about the PSF for each image is written out to the relevant psField files. We use the standalone code, read_PSF, from the READATLASIMAGES-V5_4_11 program,101010http://www.astro.princeton.edu/~rh1/readAtlasImages to reconstruct the PSF at the position of the galaxy NGC 5092 in the frame. The obtained PSF image has a standard size of 51 pixels on each side, and the background level is set to the standard soft bias of 1000 DN. For each drC image, a cutout of 200 pixels on each side centered on the core of NGC 5092 is used to ensure that enough pixels are retained to properly determine the background. The 1000 DNs soft bias is removed from the cutouts and PSF images prior to fitting.
The background is calculated by selecting a source-free region and is always included. The host galaxy is modeled with an exponential disk and a Srsic bulge (the index fixed at 4). A point-like source, modeled by the PSF of the images, is added to account for any nonstellar nuclear emission. For the 2005-03 observation, the stellar components (exponential disk and Srsic) are fixed to those fitted from the 2005-04 observation in all bands. Such a model gives acceptable fits to all the images by visually examining the residual images. The estimation of the overall uncertainties of the fitted parameters is nontrivial (only statistical errors are given by galfit). As a rough estimation, we compare the total fluxes of the model to the data fluxes for each of the images and find differences %. We then simply take 30 per cent as the flux uncertainties of each model component in this work. The offset of the fitted PSF and the nucleus is subpixel (0396per pixel), or less than 150 pc.
A.2.2 XMM-OM and Swift UVOT data
With the ODF downloaded from the XMM-Newton science archive, we extract the background-subtracted photometric data using the omichain processing pipeline with the default parameter setting as recommended by the sas threads. The source partly overlaps the central ring of emission caused by the scattered background light and is larger than the upper limit of the extraction region, a circle with a radius of 24 pixels (corresponding to 11.4″), allowed by the interactive photometry task omsource. So we define our own regions using the DS9 tool and perform aperture photometry on the observing science window (OSW) IMAGE files obtained after running the omichain for each exposure. The source is extracted in a circle of 20″radius, and the background is estimated in a circle with the same size in a source-free region. Coincidence-loss, a phenomenon that occurs when the source count rate is high and the detector response will be nonlinear (Fordham et al., 2000), is corrected with the correction factor taken from the relevant exposure SWSRLI files. To convert the OM count rates into magnitudes and fluxes, the AB magnitude system for OM implemented by the OM team is used111111sas watch out page: https://www.cosmos.esa.int/web/xmm-newton/sas-watchout-uvflux..
For the UVOT observations, we follow the UVOT reduction threads121212https://www.swift.ac.uk/analysis/uvot/index.php for the data reduction work, with the ’Level 2’ UVOT FITS files for each of the filters retrieved from the Space Science Data Center131313http://www.ssdc.asi.it/mmia/index.php?mission=swiftmastr used for aperture photometry. Source counts are extracted from regions with a radius of 30″and 20″for U and UVW1 images, and a sky region of 40″radius is used to estimate and subtract the sky background using the UVOT software task uvotsource. To convert the count rates into magnitudes and fluxes, the most recent UVOT calibrations (Poole et al., 2008; Breeveld et al., 2010) are used.
A.3 GALEX UV data
There were three detections with GALEX in NUV on 2005 May 28, 2005 June 11, and 2007 May 6 and one detection in FUV on 2007 May 6. To generate calibrated light curves and images for the FUV and NUV observations, gPhoton (Million et al., 2016) is used, which is a suite of publicly available GALEX calibration/reduction pipeline software tools written in Python.
We perform image subtraction on the calibrated NUV intensity images, generated with gPhoton image creation tool gMap with 0.5 degree angular extent centered on the galaxy NGC 5092, between the 2005 May and 2007 May observations. The differential image exhibits a prominent excess—thus a flare in the NUV band—at the nucleus. We measure the position of this excess emission using the SExtractor as R.A.=, decl.=.0, which is consistent with that of the galactic nucleus (R.A.=, decl.=) derived from -band SDSS 2D image decomposition with galfit as described in Appendix A.2.1, within the positional uncertainty of 0.5 (Morrissey et al., 2007).
To quantify the amplitude of the variability, we measure the aperture photometry of the entire galaxy with gPhoton tool gAperture. The photometry aperture is a circle of 20″radius, and the background is selected from an annularregion with inner and outer radii of 25″and 30″, respectively.
A.4 Infrared data
The WISE has performed a full-sky imaging survey in four bands, (3.4 m), (4.6 m), (12 m) and (22 m), from 2010 February to August. WISE was in hibernation in 2011 February owing to the depletion of the solid hydrogen cryogen used to cool the and instrumentation, and was reactivated and renamed NEOWISE-R since 2013 October, using only the and . We download the and data from the ALLWISE (Wright et al., 2010) and NEOWISE (Mainzer et al., 2014) multiepoch photometry data release by IRSA141414https://irsa.ipac.caltech.edu/frontpage/. The best-quality single-frame images are used, by selecting only detections with good-quality frame (), low radiation hints (), not in the moon masking area (), without contamination and confusion (). The data mainly spread in 12 epochs at intervals of about 6 months, with each epoch containing about 12 single exposure observations performed within 1–2 days. To examine the long-term variability in IR, we smooth the light curves by measuring the median magnitudes and take the standard deviations as the magnitude uncertainties in each epoch. The magnitudes are then converted to the source flux density using the equations and parameters on the WISE data processing website151515http://wise2.ipac.caltecg.edu/docs/release/allsky/expsup/sec4_4h.html.
NGC 5092 was also covered in 2MASS (Skrutskie et al., 2006), and the Atlas images in each filter, used for aperture photometry, are accessible via the 2MASS Images Services,161616https://irsa.ipac.caltech.edu/applications/2MASS/IM/ which are administered by the Infrared Science Archive (IRSA)171717https://irsa.ipac.caltech.edu/frontpage/. To convert the calibrated magnitudes into fluxes, the fluxes for zero-magnitude conversion values from Cohen et al. (2003) are used.
A.5 Optical spectral analysis
A.5.1 Starlight modeling
A series of procedures, which have been developed and applied in our previous work (Lu et al., 2006; Zhou et al., 2006; Liu et al., 2018), are used to deal with starlight and continuum fitting in this work. The starlight is modeled using a combination of six synthesized galaxy templates derived from the spectral template library of simple stellar populations (SSPs; Bruzual & Charlot, 2003) using the Ensemble Learning Independent Component Analysis algorithm (see Lu et al., 2006 for details181818These galaxy templates have been applied in a series of spectral analyses in our previous work (e.g. Zhou et al. (2006), Dong et al. (2012), Liu et al. (2018), and demonstrated to be robust and effective in dealing with large dataset of spectra.). These templates have included most stellar features in SSPs and hence can avoid underlying overfit in most cases. These templates are broadened by convolving with a Gaussian of an alterable width to match the stellar velocity dispersion of the host galaxy. In addition, the starlight model is slightly shifted in wavelength in adaptive steps to correct the effect introduced by the possible uncertainty of the redshift provided by the SDSS pipeline, which can help to improve the fit and measurement of the host velocity dispersion. During the continuum fitting, two kinds of regions are masked out: (1) bad pixels as flagged by the SDSS pipeline, and (2) wavelength range that may be seriously affected by prominent emission lines. A composite SDSS quasar spectrum introduced by Vanden Berk et al. (2001) is initially adopted to determine the second mask regions. The starlight can be well modeled with a stellar population of 2.5 Gyr, and the fitting result is shown in Figure 9.
A.5.2 Emission-line measurements
After the subtraction of the stellar continuum, a residual pure emission-line spectrum is obtained, which is fitted as follows. Each of the narrow lines, including H, H, [O III], and [N II], are fitted using a Gaussian profile; the profiles and redshifts of these narrow lines are tied to those of narrow [O III], and the flux ratios of [O III] and [N II] doublets are fixed to their theoretical values, respectively. We note that the emission-line-fitting results are vulnerable to continuum subtraction. Thus, in order to check the significance of these emission lines, we try to estimate the uncertainties as described below. We find a series of fake emisson-line features from the residual spectrum where there are no prominent emission lines in theory. These so-called emission lines are fitted with one Gaussian, whose widths are fixed to that of [O III]. The standard deviation of the derived fluxes of these fake lines is then taken as uncertainty of the detected emission lines. As a result, [O III] and H are significantly detected with , while H is marginally detected with .
A.5.3 Upper Limits estimation
For lines of interest without robust detections, upper limits on their fluxes are derived by using the fitting technique, following the method used in Li et al. (2015) (see their Section 2.1). Here we take the measurement of the flux upper limit of [N II] as an example. The emission-line spectrum segment in a wavelength range covering the [N II]+H region (6500–6650Å) is used only. First, the line complex is modeled with a Gaussian for H and two Gaussians for the [N II] doublets. The spectral segment is fitted with this model by using the fitting procedure, resulting in the minimum and a set of best-fit parameters. We then vary the flux of [N II] over a wide range with an increment and fix it in a series of fits, resulting in a series of gradually increasing values. The 90% confidence range of the flux is determined by finding the corresponding = 2.706 (for one parameter of interest), which is 9.410-16 erg s-1 cm-2 for [N II]. Figure 13 shows the starlight-model-subtracted spectrum in the wavelength range of Å, with the best-fit H and 90% upper limits of the [N II] emission lines (blue). The inset plot shows the versus the flux of [N II] and the orange, red and green horizontal lines indicate the 68%,90%, and 99% confidence levels, with respectively.
References
- Arnaud (1996) Arnaud, K. A. 1996, Astronomical Society of the Pacific Conference Series, Vol. 101, XSPEC: The First Ten Years, ed. G. H. Jacoby & J. Barnes, 17
- Ayal et al. (2000) Ayal, S., Livio, M., & Piran, T. 2000, ApJ, 545, 772, doi: 10.1086/317835
- Bade et al. (1996) Bade, N., Komossa, S., & Dahlem, M. 1996, A&A, 309, L35
- Baldwin et al. (1981) Baldwin, J. A., Phillips, M. M., & Terlevich, R. 1981, PASP, 93, 5, doi: 10.1086/130766
- Bertin & Arnouts (1996) Bertin, E., & Arnouts, S. 1996, A&AS, 117, 393, doi: 10.1051/aas:1996164
- Bloom et al. (2011) Bloom, J. S., Giannios, D., Metzger, B. D., et al. 2011, Science, 333, 203, doi: 10.1126/science.1207150
- Breeveld et al. (2010) Breeveld, A. A., Curran, P. A., Hoversten, E. A., et al. 2010, MNRAS, 406, 1687, doi: 10.1111/j.1365-2966.2010.16832.x
- Brinchmann et al. (2004) Brinchmann, J., Charlot, S., White, S. D. M., et al. 2004, MNRAS, 351, 1151, doi: 10.1111/j.1365-2966.2004.07881.x
- Brown et al. (2015) Brown, G. C., Levan, A. J., Stanway, E. R., et al. 2015, MNRAS, 452, 4297, doi: 10.1093/mnras/stv1520
- Bruzual & Charlot (2003) Bruzual, G., & Charlot, S. 2003, MNRAS, 344, 1000, doi: 10.1046/j.1365-8711.2003.06897.x
- Burrows et al. (2005) Burrows, D. N., Hill, J. E., Nousek, J. A., et al. 2005, Space Sci. Rev., 120, 165, doi: 10.1007/s11214-005-5097-2
- Burrows et al. (2011) Burrows, D. N., Kennea, J. A., Ghisellini, G., et al. 2011, Nature, 476, 421, doi: 10.1038/nature10374
- Cenko et al. (2012) Cenko, S. B., Krimm, H. A., Horesh, A., et al. 2012, ApJ, 753, 77, doi: 10.1088/0004-637X/753/1/77
- Cenko et al. (2016) Cenko, S. B., Cucchiara, A., Roth, N., et al. 2016, ApJ, 818, L32, doi: 10.3847/2041-8205/818/2/L32
- Cid Fernandes et al. (2010) Cid Fernandes, R., Stasińska, G., Schlickmann, M. S., et al. 2010, MNRAS, 403, 1036, doi: 10.1111/j.1365-2966.2009.16185.x
- Cohen et al. (2003) Cohen, M., Wheaton, W. A., & Megeath, S. T. 2003, AJ, 126, 1090, doi: 10.1086/376474
- Condon et al. (1998) Condon, J. J., Cotton, W. D., Greisen, E. W., et al. 1998, AJ, 115, 1693, doi: 10.1086/300337
- da Cunha et al. (2008) da Cunha, E., Charlot, S., & Elbaz, D. 2008, MNRAS, 388, 1595, doi: 10.1111/j.1365-2966.2008.13535.x
- Dai et al. (2018) Dai, L., McKinney, J. C., Roth, N., Ramirez-Ruiz, E., & Miller, M. C. 2018, ApJ, 859, L20, doi: 10.3847/2041-8213/aab429
- Dong et al. (2012) Dong, X.-B., Ho, L. C., Yuan, W., et al. 2012, ApJ, 755, 167, doi: 10.1088/0004-637X/755/2/167
- Dou et al. (2017) Dou, L., Wang, T., Yan, L., et al. 2017, ApJ, 841, L8, doi: 10.3847/2041-8213/aa7130
- Dou et al. (2016) Dou, L., Wang, T.-g., Jiang, N., et al. 2016, ApJ, 832, 188, doi: 10.3847/0004-637X/832/2/188
- Ellis & O’Sullivan (2006) Ellis, S. C., & O’Sullivan, E. 2006, MNRAS, 367, 627, doi: 10.1111/j.1365-2966.2005.09982.x
- Esquej et al. (2008) Esquej, P., Saxton, R. D., Komossa, S., et al. 2008, A&A, 489, 543, doi: 10.1051/0004-6361:200810110
- Evans & Kochanek (1989) Evans, C. R., & Kochanek, C. S. 1989, ApJ, 346, L13, doi: 10.1086/185567
- Ferrarese & Ford (2005) Ferrarese, L., & Ford, H. 2005, Space Sci. Rev., 116, 523, doi: 10.1007/s11214-005-3947-6
- Fordham et al. (2000) Fordham, J. L. A., Moorhead, C. F., & Galbraith, R. F. 2000, MNRAS, 312, 83, doi: 10.1046/j.1365-8711.2000.03155.x
- French et al. (2016) French, K. D., Arcavi, I., & Zabludoff, A. 2016, ApJ, 818, L21, doi: 10.3847/2041-8205/818/1/L21
- French et al. (2017) —. 2017, ApJ, 835, 176, doi: 10.3847/1538-4357/835/2/176
- Gabriel et al. (2004) Gabriel, C., Denby, M., Fyfe, D. J., et al. 2004, Astronomical Society of the Pacific Conference Series, Vol. 314, The XMM-Newton SAS - Distributed Development and Maintenance of a Large Science Analysis System: A Critical Analysis, ed. F. Ochsenbein, M. G. Allen, & D. Egret, 759
- Gaia Collaboration et al. (2018) Gaia Collaboration, Brown, A. G. A., Vallenari, A., et al. 2018, A&A, 616, A1, doi: 10.1051/0004-6361/201833051
- Gehrels et al. (2004) Gehrels, N., Chincarini, G., Giommi, P., et al. 2004, ApJ, 611, 1005, doi: 10.1086/422091
- Gezari et al. (2006) Gezari, S., Martin, D. C., Milliard, B., et al. 2006, ApJ, 653, L25, doi: 10.1086/509918
- Gezari et al. (2008) Gezari, S., Basa, S., Martin, D. C., et al. 2008, ApJ, 676, 944, doi: 10.1086/529008
- Gezari et al. (2012) Gezari, S., Chornock, R., Rest, A., et al. 2012, Nature, 485, 217, doi: 10.1038/nature10990
- Gordon et al. (2003) Gordon, K. D., Clayton, G. C., Misselt, K. A., Land olt, A. U., & Wolff, M. J. 2003, ApJ, 594, 279, doi: 10.1086/376774
- Guillochon et al. (2014) Guillochon, J., Manukian, H., & Ramirez-Ruiz, E. 2014, ApJ, 783, 23, doi: 10.1088/0004-637X/783/1/23
- Holoien et al. (2014) Holoien, T. W. S., Prieto, J. L., Bersier, D., et al. 2014, MNRAS, 445, 3263, doi: 10.1093/mnras/stu1922
- Holoien et al. (2016) Holoien, T. W. S., Kochanek, C. S., Prieto, J. L., et al. 2016, MNRAS, 455, 2918, doi: 10.1093/mnras/stv2486
- Holoien et al. (2019) Holoien, T. W. S., Vallely, P. J., Auchettl, K., et al. 2019, ApJ, 883, 111, doi: 10.3847/1538-4357/ab3c66
- Hung et al. (2017) Hung, T., Gezari, S., Blagorodnova, N., et al. 2017, ApJ, 842, 29, doi: 10.3847/1538-4357/aa7337
- Ivezic et al. (2008) Ivezic, Z., Axelrod, T., Brandt, W. N., et al. 2008, Serbian Astronomical Journal, 176, 1, doi: 10.2298/SAJ0876001I
- Jiang et al. (2016) Jiang, N., Dou, L., Wang, T., et al. 2016, ApJ, 828, L14, doi: 10.3847/2041-8205/828/1/L14
- Jiang et al. (2017) Jiang, N., Wang, T., Yan, L., et al. 2017, ApJ, 850, 63, doi: 10.3847/1538-4357/aa93f5
- Kanner et al. (2013) Kanner, J., Baker, J., Blackburn, L., et al. 2013, ApJ, 774, 63, doi: 10.1088/0004-637X/774/1/63
- Kauffmann et al. (2003a) Kauffmann, G., Heckman, T. M., Tremonti, C., et al. 2003a, MNRAS, 346, 1055, doi: 10.1111/j.1365-2966.2003.07154.x
- Kauffmann et al. (2003b) Kauffmann, G., Heckman, T. M., White, S. D. M., et al. 2003b, MNRAS, 341, 33, doi: 10.1046/j.1365-8711.2003.06291.x
- Kennedy et al. (2016) Kennedy, G. F., Meiron, Y., Shukirgaliyev, B., et al. 2016, MNRAS, 460, 240, doi: 10.1093/mnras/stw908
- Kewley et al. (2001) Kewley, L. J., Dopita, M. A., Sutherland, R. S., Heisler, C. A., & Trevena, J. 2001, ApJ, 556, 121, doi: 10.1086/321545
- Kewley et al. (2006) Kewley, L. J., Groves, B., Kauffmann, G., & Heckman, T. 2006, MNRAS, 372, 961, doi: 10.1111/j.1365-2966.2006.10859.x
- Komossa (2002) Komossa, S. 2002, Reviews in Modern Astronomy, 15, 27. https://arxiv.org/abs/astro-ph/0209007
- Komossa (2015) —. 2015, Journal of High Energy Astrophysics, 7, 148, doi: 10.1016/j.jheap.2015.04.006
- Komossa & Bade (1999) Komossa, S., & Bade, N. 1999, A&A, 343, 775. https://arxiv.org/abs/astro-ph/9901141
- Komossa & Greiner (1999) Komossa, S., & Greiner, J. 1999, A&A, 349, L45. https://arxiv.org/abs/astro-ph/9908216
- Komossa et al. (2008) Komossa, S., Zhou, H., Wang, T., et al. 2008, ApJ, 678, L13, doi: 10.1086/588281
- Komossa et al. (2009) Komossa, S., Zhou, H., Rau, A., et al. 2009, ApJ, 701, 105, doi: 10.1088/0004-637X/701/1/105
- Leloudas et al. (2019) Leloudas, G., Dai, L., Arcavi, I., et al. 2019, ApJ, 887, 218, doi: 10.3847/1538-4357/ab5792
- Levan et al. (2011) Levan, A. J., Tanvir, N. R., Cenko, S. B., et al. 2011, Science, 333, 199, doi: 10.1126/science.1207143
- Li et al. (2015) Li, Y., Yuan, W., Zhou, H. Y., et al. 2015, AJ, 149, 75, doi: 10.1088/0004-6256/149/2/75
- Lin et al. (2011) Lin, D., Carrasco, E. R., Grupe, D., et al. 2011, ApJ, 738, 52, doi: 10.1088/0004-637X/738/1/52
- Liu et al. (2018) Liu, H.-Y., Yuan, W., Dong, X.-B., Zhou, H., & Liu, W.-J. 2018, ApJS, 235, 40, doi: 10.3847/1538-4365/aab88e
- Lodato & Rossi (2011) Lodato, G., & Rossi, E. M. 2011, MNRAS, 410, 359, doi: 10.1111/j.1365-2966.2010.17448.x
- Loeb & Ulmer (1997) Loeb, A., & Ulmer, A. 1997, ApJ, 489, 573, doi: 10.1086/304814
- Lu et al. (2006) Lu, H., Zhou, H., Wang, J., et al. 2006, AJ, 131, 790, doi: 10.1086/498711
- Lu et al. (2016) Lu, W., Kumar, P., & Evans, N. J. 2016, MNRAS, 458, 575, doi: 10.1093/mnras/stw307
- Lupton et al. (2001) Lupton, R., Gunn, J. E., Ivezić, Z., Knapp, G. R., & Kent, S. 2001, Astronomical Society of the Pacific Conference Series, Vol. 238, The SDSS Imaging Pipelines, ed. J. Harnden, F. R., F. A. Primini, & H. E. Payne, 269
- Mainzer et al. (2014) Mainzer, A., Bauer, J., Cutri, R. M., et al. 2014, ApJ, 792, 30, doi: 10.1088/0004-637X/792/1/30
- Marconi & Hunt (2003) Marconi, A., & Hunt, L. K. 2003, ApJ, 589, L21, doi: 10.1086/375804
- Martin et al. (2005) Martin, D. C., Fanson, J., Schiminovich, D., et al. 2005, ApJ, 619, L1, doi: 10.1086/426387
- Mason et al. (2001) Mason, K. O., Breeveld, A., Much, R., et al. 2001, A&A, 365, L36, doi: 10.1051/0004-6361:20000044
- Metzger & Stone (2016) Metzger, B. D., & Stone, N. C. 2016, MNRAS, 461, 948, doi: 10.1093/mnras/stw1394
- Miller et al. (2015) Miller, J. M., Kaastra, J. S., Miller, M. C., et al. 2015, Nature, 526, 542, doi: 10.1038/nature15708
- Million et al. (2016) Million, C., Fleming, S. W., Shiao, B., et al. 2016, ApJ, 833, 292, doi: 10.3847/1538-4357/833/2/292
- Morrissey et al. (2005) Morrissey, P., Schiminovich, D., Barlow, T. A., et al. 2005, ApJ, 619, L7, doi: 10.1086/424734
- Morrissey et al. (2007) Morrissey, P., Conrow, T., Barlow, T. A., et al. 2007, ApJS, 173, 682, doi: 10.1086/520512
- Panessa et al. (2006) Panessa, F., Bassani, L., Cappi, M., et al. 2006, A&A, 455, 173, doi: 10.1051/0004-6361:20064894
- Peng et al. (2002) Peng, C. Y., Ho, L. C., Impey, C. D., & Rix, H.-W. 2002, AJ, 124, 266, doi: 10.1086/340952
- Piran et al. (2015) Piran, T., Svirski, G., Krolik, J., Cheng, R. M., & Shiokawa, H. 2015, ApJ, 806, 164, doi: 10.1088/0004-637X/806/2/164
- Poole et al. (2008) Poole, T. S., Breeveld, A. A., Page, M. J., et al. 2008, MNRAS, 383, 627, doi: 10.1111/j.1365-2966.2007.12563.x
- Read et al. (2008) Read, A. M., Saxton, R. D., Torres, M. A. P., et al. 2008, A&A, 482, L1, doi: 10.1051/0004-6361:200809456
- Rees (1988) Rees, M. J. 1988, Nature, 333, 523, doi: 10.1038/333523a0
- Roming et al. (2005) Roming, P. W. A., Kennedy, T. E., Mason, K. O., et al. 2005, Space Sci. Rev., 120, 95, doi: 10.1007/s11214-005-5095-4
- Rosen et al. (2016) Rosen, S. R., Webb, N. A., Watson, M. G., et al. 2016, A&A, 590, A1, doi: 10.1051/0004-6361/201526416
- Saxton et al. (2008) Saxton, R. D., Read, A. M., Esquej, P., et al. 2008, A&A, 480, 611, doi: 10.1051/0004-6361:20079193
- Saxton et al. (2012) —. 2012, A&A, 541, A106, doi: 10.1051/0004-6361/201118367
- Saxton et al. (2017) Saxton, R. D., Read, A. M., Komossa, S., et al. 2017, A&A, 598, A29, doi: 10.1051/0004-6361/201629015
- Saxton et al. (2019) —. 2019, A&A, 630, A98, doi: 10.1051/0004-6361/201935650
- Schlegel et al. (1998) Schlegel, D. J., Finkbeiner, D. P., & Davis, M. 1998, ApJ, 500, 525, doi: 10.1086/305772
- Skrutskie et al. (2006) Skrutskie, M. F., Cutri, R. M., Stiening, R., et al. 2006, AJ, 131, 1163, doi: 10.1086/498708
- Stone et al. (2013) Stone, N., Sari, R., & Loeb, A. 2013, MNRAS, 435, 1809, doi: 10.1093/mnras/stt1270
- Tremonti et al. (2004) Tremonti, C. A., Heckman, T. M., Kauffmann, G., et al. 2004, ApJ, 613, 898, doi: 10.1086/423264
- van Velzen (2018) van Velzen, S. 2018, ApJ, 852, 72, doi: 10.3847/1538-4357/aa998e
- van Velzen et al. (2016) van Velzen, S., Mendez, A. J., Krolik, J. H., & Gorjian, V. 2016, ApJ, 829, 19, doi: 10.3847/0004-637X/829/1/19
- van Velzen et al. (2019) van Velzen, S., Stone, N. C., Metzger, B. D., et al. 2019, ApJ, 878, 82, doi: 10.3847/1538-4357/ab1844
- Vanden Berk et al. (2001) Vanden Berk, D. E., Richards, G. T., Bauer, A., et al. 2001, AJ, 122, 549, doi: 10.1086/321167
- Voges et al. (1999) Voges, W., Aschenbach, B., Boller, T., et al. 1999, A&A, 349, 389. https://arxiv.org/abs/astro-ph/9909315
- Wang et al. (2018) Wang, T., Yan, L., Dou, L., et al. 2018, MNRAS, 477, 2943, doi: 10.1093/mnras/sty465
- Wang et al. (2012) Wang, T.-G., Zhou, H.-Y., Komossa, S., et al. 2012, ApJ, 749, 115, doi: 10.1088/0004-637X/749/2/115
- Wang et al. (2011) Wang, T.-G., Zhou, H.-Y., Wang, L.-F., Lu, H.-L., & Xu, D. 2011, ApJ, 740, 85, doi: 10.1088/0004-637X/740/2/85
- Wevers et al. (2019) Wevers, T., Pasham, D. R., van Velzen, S., et al. 2019, MNRAS, 488, 4816, doi: 10.1093/mnras/stz1976
- White et al. (1997) White, R. L., Becker, R. H., Helfand, D. J., & Gregg, M. D. 1997, ApJ, 475, 479, doi: 10.1086/303564
- Willingale et al. (2013) Willingale, R., Starling, R. L. C., Beardmore, A. P., Tanvir, N. R., & O’Brien, P. T. 2013, MNRAS, 431, 394, doi: 10.1093/mnras/stt175
- Wilms et al. (2000) Wilms, J., Allen, A., & McCray, R. 2000, ApJ, 542, 914, doi: 10.1086/317016
- Worthey & Ottaviani (1997) Worthey, G., & Ottaviani, D. L. 1997, ApJS, 111, 377, doi: 10.1086/313021
- Wright et al. (2010) Wright, E. L., Eisenhardt, P. R. M., Mainzer, A. K., et al. 2010, AJ, 140, 1868, doi: 10.1088/0004-6256/140/6/1868
- York et al. (2000) York, D. G., Adelman, J., Anderson, John E., J., et al. 2000, AJ, 120, 1579, doi: 10.1086/301513
- Yuan et al. (2016a) Yuan, W., Amati, L., Cannizzo, J. K., et al. 2016a, Space Sci. Rev., 202, 235, doi: 10.1007/s11214-016-0274-z
- Yuan et al. (2016b) Yuan, W., Komossa, S., Zhang, C., et al. 2016b, in IAU Symposium, Vol. 312, Star Clusters and Black Holes in Galaxies across Cosmic Time, ed. Y. Meiron, S. Li, F. K. Liu, & R. Spurzem, 68–70
- Zauderer et al. (2011) Zauderer, B. A., Berger, E., Soderberg, A. M., et al. 2011, Nature, 476, 425, doi: 10.1038/nature10366
- Zhang & Hao (2018) Zhang, K., & Hao, L. 2018, ApJ, 856, 171, doi: 10.3847/1538-4357/aab207
- Zhou et al. (2006) Zhou, H., Wang, T., Yuan, W., et al. 2006, ApJS, 166, 128, doi: 10.1086/504869