Ce:LaBr3 crystals with SiPM array readout and temperature control for the FAMU experiment at RAL
Abstract
Compact X-rays detectors made of 1/2” Ce:LaBr3 crystals of cubic shape with SiPM array readout have been developed for the FAMU experiment at RIKEN-RAL, to instrument regions of difficult access. Due to the high photon yield of Ce:LaBr3 it was possible to use a simple readout scheme based on CAEN V1730 digitizers, without a dedicated amplification stage. The drift with temperature of SiPM gain was corrected by using CAEN A7885D regulated power supply chips with temperature feedback. Energy resolutions (FWHM) around at the 137Cs peak and around at the 57Co peak were obtained.
1 Introduction
The FAMU (Fisica degli Atomi Muonici) experiment at RAL [1] is designed to measure the hyperfine splitting (HFS) in the ground state (1S) of the muonic hydrogen. It aims at a high accuracy determination of the proton Zemach radius [2], [3]. This experiment may contribute to solve the so-called “proton radius puzzle”: a large and still unsolved disagreement between the proton charge as measured with electrons or muons [4].
A high intensity pulsed low-energy muon beam, stopping in a hydrogen target, is used to produce muonic hydrogen (in a mixture of singlet F=0 and triplet F=1 states). A tunable mid-IR (MIR) pulsed high power laser then excites the hyperfine splitting (HFS) transition of the 1S muonic hydrogen (from F=0 to F=1 states). Making use of the muon transfer from muonic hydrogen to another higher-Z gas in the target (such as ), the HFS transition will be recognized by an increase of the number of X-rays from the cascade, during a laser frequency scan around the resonance value () . From the measurement of the Zemach radius of the proton may be computed with a precision up to , thus casting new light on the proton radius puzzle.
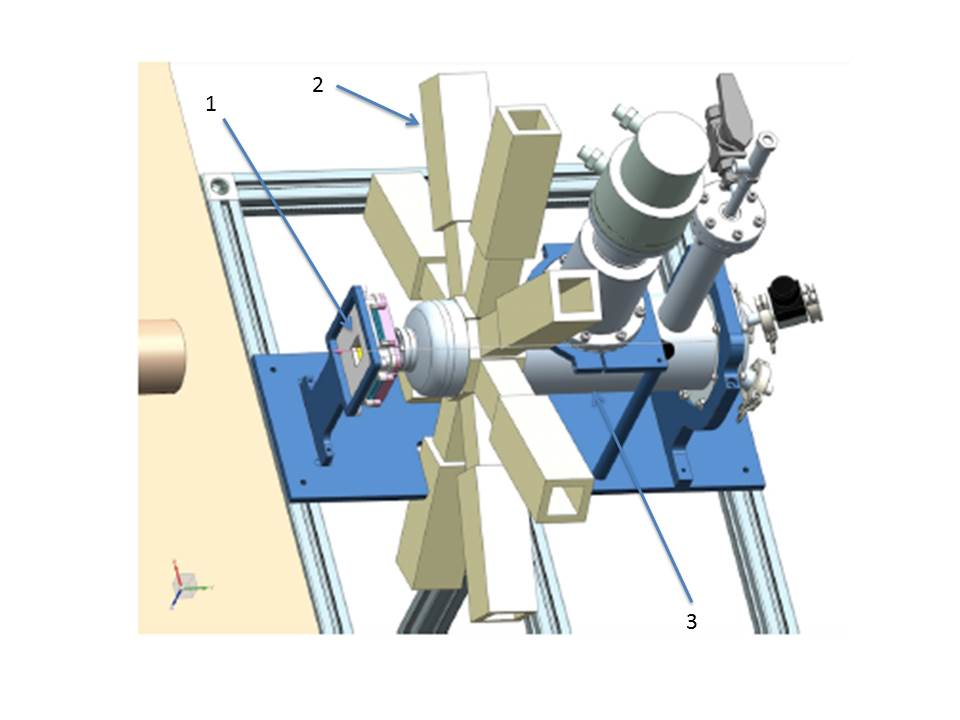
The FAMU experiment is performed in steps, starting from the study of the transfer rate from muonic hydrogen to another higher-Z gas and ending with the full working setup including the pump MIR laser and a multipass optical cavity 333to enhance the probability of laser light-muon interactions. The preliminary steps have allowed to determine the best mixture to be used inside the cryogenic target and optimize the operating conditions. A schematic layout of the experimental setup for the preliminary steps is shown in figure 1.
The RIKEN-RAL muon facility [5] at Rutherford Appleton Laboratory (UK) provides high intensity pulsed muon beams at four experimental ports. The primary proton beam at 800 MeV/c impinges on a secondary carbon target producing pions and then high intensity low energy pulsed muon beams. The muon beams reflect the primary beam structure: two pulses with a 70 ns FWHM and a 320 ns peak to peak distance are delivered, with a 50 Hz repetition rate. The FAMU experiment makes use of a negative decay muon beam at 60 MeV/c. For this experiment, an important issue is the optimal steering of the incoming high intensity pulsed muon beam onto the hydrogen target, to maximize the muonic hydrogen production rate. A system of three beam hodoscopes has been developed for this scope. The first two are based on square mm2 Bicron BCF12 scintillating fibers read by SiPMs, while the last one is based on square mm2 scintillating fibers of the same type, with white EMA coating, to avoid light cross-talk [6]. The muon beam intensity is around /s in a typical size cm2. The energy spread is around and the angular divergence around 60 mrad.
To extract the characteristic muonic X-rays lines (around 100 keV) with a good energy resolution and a minimal events pile-up, a system based on Ce:LaBr3 crystals and HPGe detectors has been developed. Even if they have better energy resolution, the HPGe detectors are slower, work at cryogenic temperatures and are more expensive. Therefore the main X-rays detector system for the experiment was based on 1" circular Ce:LaBr3 crystals, 1” long, read by UBA Hamamatsu R11265U-200 PMTs with active divider (up to eight arranged in two detachable half crowns). In addition, an R D was pursued to complement these detectors with crystals equipped with SiPM readout to instrument regions of more difficult access, see reference [7] for further details.
2 X-rays detectors with SiPM arrays readout
For our aims it is essential to detect low-energy X-rays in the range 100-200 keV. Pr:LuAG [8] and Ce:GAAG [9] crystals with respect to more conventional Ce:LaBr3, CeBr3[10] and NaI(Tl) crystals, have the advantage to be non hygroscopic and thus do not need encapsulation.
Results on their performances are reported in references [11], [12]. From laboratory tests a solution based on Ce:LaBr3 crystals was shown as still to be preferred. A crystal thickness of 0.33 (1.54) cm for attenuation at 100 (200) keV was computed from X-ray attenuation coefficients, as reported in [13]. It is apparent that for the detection of the O2 characteristic lines in the region 100-160 keV, corresponding to muon transfer, 1/2” long crystals are adequate. A more complete Monte Carlo simulation based on MNCP[14] provided an estimate of absorption for cubic crystals of 1/2” side with a source at a distance corresponding to the center of the foreseen target. Even in this case 1/2” long crystals were considered adequate.
The structure of a detector with a SiPM array readout is shown in figure 2. The optical contact between the crystal and the SiPM arrays is done through a Bicron BC631 silicone optical grease.
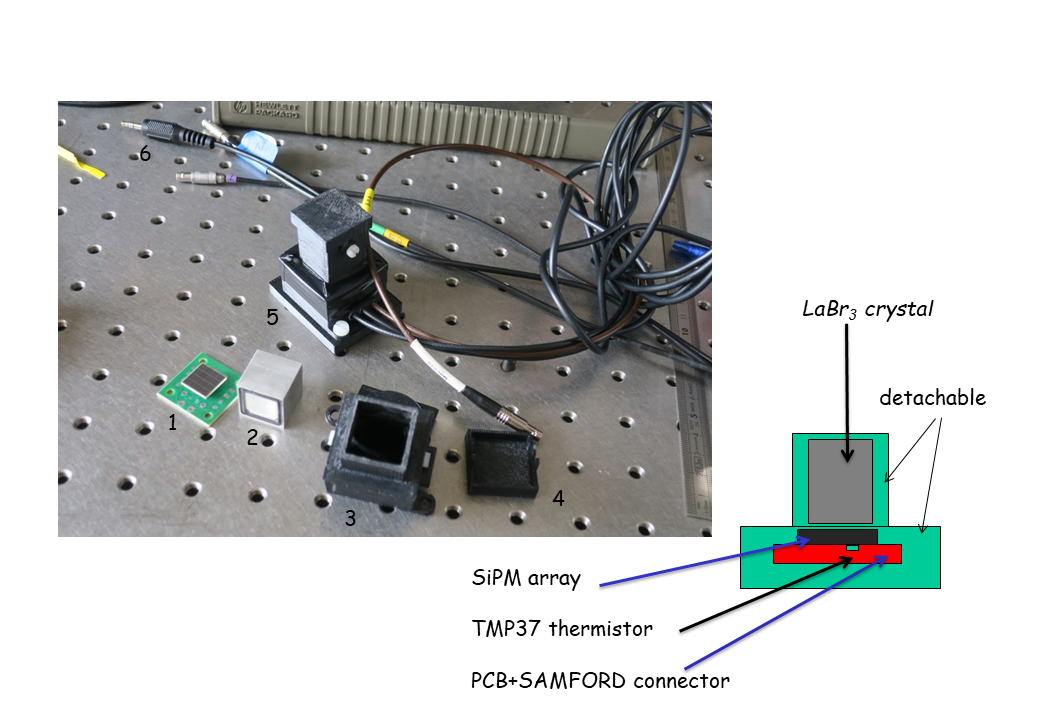
The crystal/PCB holder, realized with a 3D printer, is made in two pieces: one contains the crystal under test, while the other holds the readout electronics with the custom PCB, where a SiPM array is mounted on. The analog signals of the 16 SiPM of one array are summed together on the custom PCB. Signal acquisition may be realized with a standard spectroscopic chain (based on a Ortec 672 spectroscopic amplifier or a fast Ortec 579 Ortec amplifier) or with a fast digitizer. Due to the signal amplitude ( mV at the 137Cs peak ) no amplification is needed and a direct readout via a digitizer may be used. In our case we made use of a CAEN DT5730 digitizer (desktop version) or a V1730 digitizer (VME format). Both have been used via an optical link and have a bandwith of 500 MHz with a Vpp dynamic range.
In the first instance, we used different 4 4 arrays made from 3 3 mm2 SiPM array from Sensl, Advansid and Hamamatsu for their readout. Their main operation characteristics are resumed in table 1. Hamamatsu SiPM make use of the TSV (“through Silicon via”) technology that eliminates the need of a wire bonding pad, thus reducing dead space problems. The anode of each channel is traced to the backside pad by TSV. Typical gains are in the range 1.7 to 3 and depend on the applied overvoltages (), while the dark count rate is around 0.5 Mcps for all the considered SiPM arrays.
| PDE | range | |||||||
| (V) | (V) | (V) | (mV/C) | (V) | (nm) | ( | (nm) | |
| SenSL Array | 24-25 | 1-5 | 26 | 21.5 | 420 | 300-800 | ||
| SB-4-3035-CER | ||||||||
| Advansid | 26 | 2-6 | 29 | 26 | 420 | 350-900 | ||
| NUV3S-4x4TD | ||||||||
| Hamamatsu | 53.8 | 54 | 450 | 320-900 | ||||
| S13361-3050-AE (E) | ||||||||
| Hamamatsu | 54.2 | 54 | 450 | 280-900 | ||||
| S13361-3050-AS (S) | ||||||||
| Hamamatsu | 40.8 | 34 | 450 | 270-900 | ||||
| S14161-3050-HS (S) |
Preliminary results obtained with a standard spectroscopic chain were reported in references [11], [12] and show resolution at 662 keV from (Ce:LaBr3 crystals with Hamamatsu S13361-3050-AS SiPM arrays) to 8.4 (NaI crystals with the same readout). At lower X-rays energy ( keV), FWHM energy resolutions between the different crystals become more compatible: as an example while at 662 keV a Ce:LaBr3 crystal has a resolution a factor better than a NaI(Tl) crystal, at 122 keV this factor reduces only to .
The best results were obtained with Ce:LaBr3 crystals with a readout based on Hamamatsu SiPM arrays with a silicone window, that has a better transmission around 380 nm.
As the SiPM gain has a drift with temperature ( mV/∘C for the breakdown voltage of Hamamatsu S13361 SiPM) a temperature correction had to be implemented.
2.1 Temperature control of SiPM gain
The gain of SiPM depends on the applied voltages where the overvoltage is kept fixed: typically around 2-4 V. The breakdown voltage depends from temperature, according to equation:
| (2.1) |
where is the temperature coefficient of table 1 and a reference temperature, tipically 25 [15]. By correcting for the increase of breakdown voltage with the previous equation 2.1 one may obtain an excellent gain stabilization. The temperature correction may be obtained offline, by recording the temperature, or online with an active feedback.
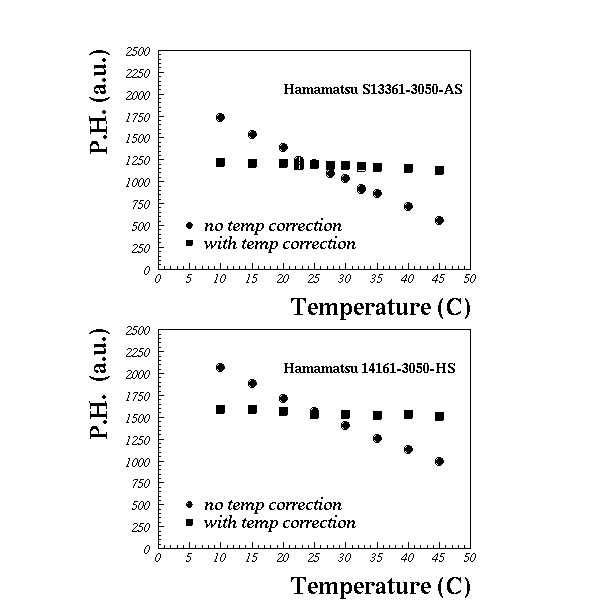
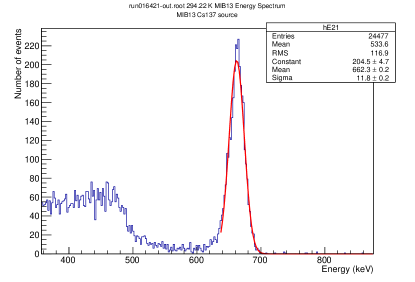
The effect to be corrected is shown in figure 3 (black circles) for two different Hamamatsu SiPM arrays. Data have been taken inside a Memmert IPV30 climatic chamber, with a temperature resolution of 0.1 ∘C between 10 ∘C and 40 ∘C. A typical detector is irradiated with a 137Cs source and data are read by a CAEN V1730 digitizer. The position of the pulse height peak is computed and then plotted as a function of temperature. We initially used single desktop power supply CAEN DT5485P 444 0.1 mV (pp) voltage ripple, mV setting precision, 1.2 mV setting resolution, with USB control, where the temperature feedback was based on a temperature sensor (TMP37 from Analog Devices) put on the backside of the PCB holding the SiPM array (see figure 2 for details). This temperature sensor is connected via a 3.5 mm stereo cable to the power supply module. Between 10 ∘C and 40 ∘C the detector pulse height response had a variation up to 60 . This effect is reduced to after temperature correction, via a CAEN DT5485P desktop module.
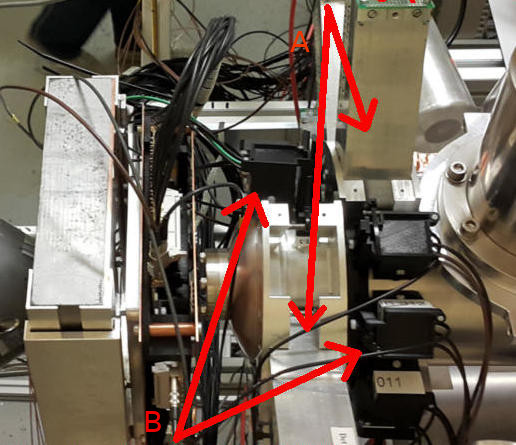
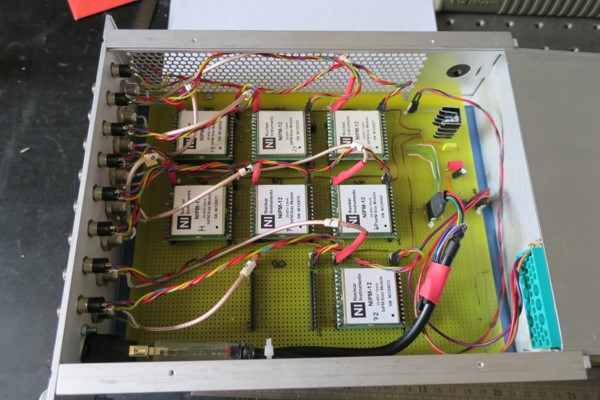
All results, based on laboratory tests, were made using such modules for powering the SiPM arrays. For the next future we have developed custom made NIM modules with up to eight HV channels each, based on CAEN A7585D chips. The communication with the host computer is done via an I2C protocol, followed by an USB-I2C converter, using on the computer side a proprietary software 555 Zeus software from Nuclear Instruments srl. that may control the setting of the power supply chips, monitor their erogated voltages and currents and record results on an Excel file. These modules realized with a wire wrap technique are shown in figure 3 and their use is foreseen for the next spectroscopic run of FAMU in late 2020. In these modules the primary voltage to feed the power supply chips is taken from the NIM backplane and the interface USB-I2C is realized via a FDTI C232HM-EDSHL-0 module. For data taken in December 2018 six DT5485P CAEN modules connected to an USB hub were used instead.
3 Results from laboratory tests.
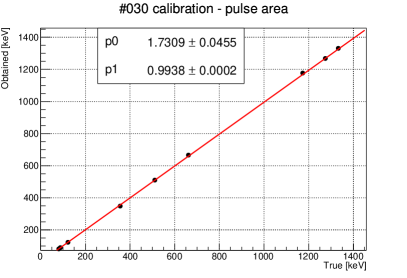
Results for a typical crystal are shown in figure 4 for both linearity and FWHM resolution (in ) using different laboratory sources in the range between 80 and 1300 keV. At the 137Cs peak a resolution was found, compatible with best results with the standard PMT readout.
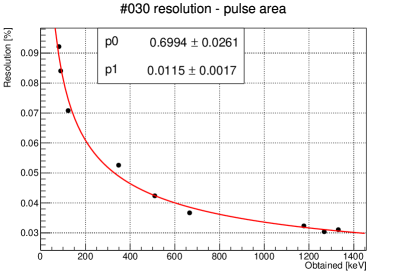
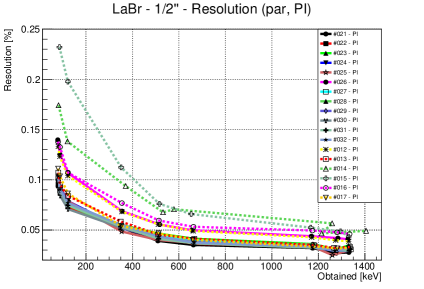
Results on linearity and FWHM resolution () are also shown in figure 5 for several Ce:LaBr3 detectors with size mm3 from Kinheng Ltd (no. 12-17) and mm3 from Ost Photonics (no. 21-32). Detectors with worse energy resolutions are equipped with Hamamatsu S13361 arrays with epoxy windows, that have a reduced transparency to the UV signal emitted from Ce:LaBr3 or have suffered from ageing problems (such as some older detectors from Kinheng, PRC). Around 122 keV FWHM energy resolutions up to are obtained.
4 Analysis of performances in beam
In the December 2018 run at Port 1 of RIKEN RAL, the two half-crown of 1” Ce:LaBr3 crystals with PMT readout were displaced of cm along the beam direction. They were complemented with four 1/2" Ce:LaBr3 detectors with SiPM readout, each. The first six detectors were powered via CAEN DT5475 modules with temperature feedback, the last two were powered by conventional ISEG NIM NHS-6001x power supply 666 with a voltage ripple less than 2-3 mV, 0.2 mV resolution voltage setting for cross-check. As the temperature in the experimental hall was quite stable (the run was done in winter) no appreciable temperature excursions were seen.
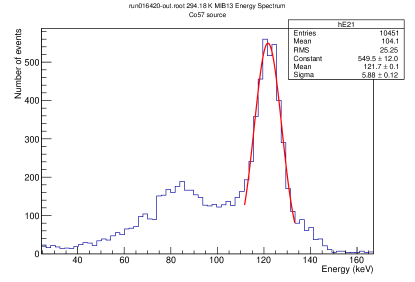
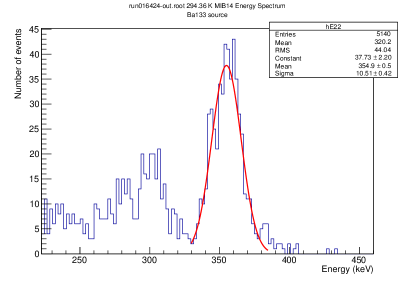
Calibration results in situ with 137Cs, 133Ba, 57Co sources are reported in figure 6 and are roughly compatible with laboratory measurements, even if FWHM resolutions are a little worse. This may be due to worse positioning of sources with respect to the detectors to be calibrated and environmental noise.
Data were then taken with a target filled with pure H2 for background studies and a mixture of O2 and H2 at various concentrations (from 0.3 to 4.6 weight) at a temperature around 80 K, at various pressures.
The timing properties of one typical detector are shown in figure 7. The two peaks structure of the beam is clearly visible with FWHM and peak-to-peak distance compatible with what expected.
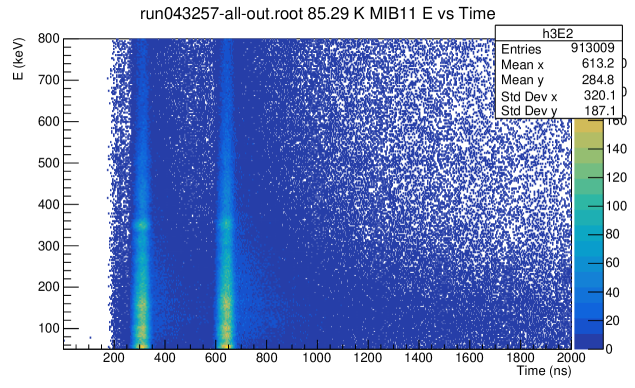
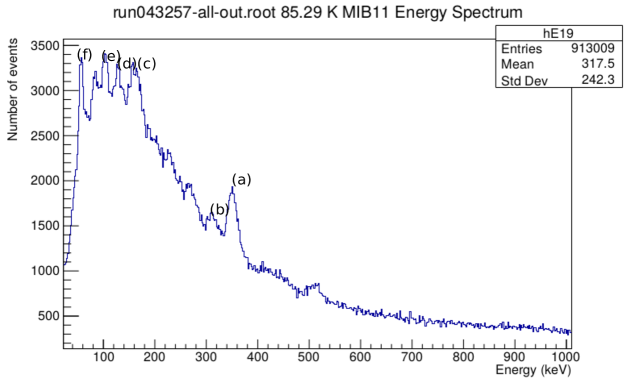
In figure 7 the full energy spectrum is reported for the same detector. Characteristic X-rays lines, mainly Nickel and Aluminium from materials present in the target, are evident from keV to around 400 keV.
5 Conclusions
Ce:LaBr3 detectors with SiPM array readout and temperature control for the power supply have been assembled and tested both in laboratory, at Sezione INFN Milano Bicocca and in beam at Port 1 at RIKEN RAL. Results show good perfomances and FWHM resolutions compatible with more bulky conventional detectors with PMT readout. Their use is foreseen, together with the NIM power supply module with temperature feedback, for the coming 2020 FAMU spectroscopic run.
Acknowledgements
We would like to thank S. Banfi, M. Gheigher (INFN Milano Bicocca) for help in mechanics setup. We acknowledge the help of Dr. M. Saviozzi of CAEN, Dr. A. Abba and Dr. V. Arosio of Nuclear Instruments for issues related to the regulated power supply chips for SiPM and their control program Zeus.
References
-
[1]
A. Vacchi et al., Measuring the size of
the proton, SPIE Newsroom (2012),
DOI:10.1117/2.1201207.004274;
A. Adamczack et al., Steps towards the hyperfine splitting measurement of the muonic hydrogen ground state: pulsed muon beam and detection system characterization, JINST 11/05 (2016) P05007;
M. Bonesini, The FAMU experiment at RIKEN RAL for a precise measure of the proton radius, PoS(EPS-HEP2019) 132;
C. Pizzolotto et al., The FAMU experiment: muonic hydrogen high precision spectroscopy studies, submitted to EPJ A. - [2] A.C. Zemach, Proton Structure and the Hyperfine Shift in Hydrogen, Phys. ReV. 104 (1956) 1771.
- [3] D. Bakalov et al., Experimental method to measure the hyperfine splitting of muonic hydrogen (, Phys. Lett. A172 (1993) 277.
-
[4]
R. Pohl et al., The size of the proton,
Nature 466 (2010) 213;
A. Antognini et al. Proton Structure from the Measurement of 2S-2P Transition Frequencies of Muonic Hydrogen, Science 339 (2013) 417 - [5] T. Matsuzaki et al., The RIKEN RAL pulsed muon facility, Nucl. Instr. Meth. A465 (2001) 365.
-
[6]
R. Carbone et al., The fiber-SiPM beam monitor
of the R484 experiment of the RIKEN-RAL muon facility, JINST 10
(2015) C03007;
M. Bonesini et al., The construction of the Fiber-SiPM beam monitor system of the R484 and R582 experiments at RIKEN RAL muon facility, JINST 12 (2017) C03035;
M. Bonesini et al., The upgraded beam monitor system of the FAMU experiment at RIKEN-RAL, Nucl. Instr. Meth A936 (2019) 592. - [7] A. Adamczack et al., The FAMU experiment at RIKEN RAL to study the muon transfer rate from hydrogen to other gases, JINST 13 (2018) P12033.
- [8] W. Drozdowski et al., Scintillation Properties of Praseodymium Activated Single Crystals, IEEE Trans. Nucl. Science 55 (2008) 2429
- [9] J.Y. Yeom et al., First Performance Results of Ce:GAGG Scintillation Crystals With Silicon Photomultipliers, IEEE Trans Nucl Science 60, no.2 (2013) 988.
- [10] F.G.A. Quarati et al., Scintillation and detection characteristics of high-sensitivity CeBr3 gamma-ray spectrometers, Nucl. Instr. Meth. A729 (2012) 596.
- [11] M. Bonesini et al., Characterization of new crystals for X-rays detector, PoS EPS-HEP2015 (2015) 244
- [12] M. Bonesini et al., Systematic study of innovative hygroscopic and non-hygroscopic crystals with SiPM array readout, PoS EPS-HEP2017 (2017) 777
-
[13]
https://www.nist.gov/pm/x-ray-mass-attenuation-coefficients;
Handbook of Chemistry and Physics, CRC Press, 67th Edition, 1986. - [14] L. Carter et al., Monte Carlo Development in Los Angeles, LA-5903-MS, 1975.
- [15] A.N. Otte et al., Characterization of three High Efficiency and Blue Sensitive Silicon Photomultipliers, Nucl. Instr. Meth. A846 (2017) 106.