Interaction of charged impurities and Rydberg excitons in cuprous oxide
Abstract
We investigate the influence of a static, uncorrelated distribution of charged impurities on the spectrum of bound excitons in the copper oxide Cu2O. We show that the statistical distribution of Stark shifts and ionisation rates leads to the vanishing of Rydberg resonances into an apparent continuum. The appearance of additional absorption lines due to the broken rotational symmetry, together with spatially inhomogeneous Stark shifts, leads to a modification of the observed line shapes that agree qualitatively with the changes observed in the experiment.
pacs:
78.20.Bh, 71.35.-y, 71.20.-NrI Introduction
Semiconductor Wannier excitons are quasi-particles comprised of an electron and a hole bound by their mutual Coulomb interaction Wannier (1937). These states have first been observed in the 1950s in Cu2O Gross and Karryev (1952); Gross (1956), where they appear as a series of resonances below the band gap and show remarkable resemblance to the hydrogenic Rydberg series. Recently, excitons with large principal quantum numbers of up to , termed Rydberg excitons, have been observed in Cu2O Kazimierczuk et al. (2014). These Rydberg excitons are very sensitive to perturbations of their surroundings, just like their atomic counterparts. For example, an intensity-dependent bleaching of the resonances has been observed Kazimierczuk et al. (2014), which has been interpreted as an excitonic Rydberg blockade. Furthermore, the deviations of the spectrum of Rydberg excitons from a purely hydrogenic series can be combined into a (phenomenological) quantum defect that is induced by the nonparabolic hole dispersion and other central-cell corrections Schöne et al. (2016); Schweiner et al. (2016); Alvermann and Fehske (2018).
Since their first observation, the influence of electric and magnetic fields on Rydberg excitons Schweiner et al. (2017); Kurz et al. (2017); Heckötter et al. (2018a); Zielinski et al. (2020); Artyukhin et al. (2018), the mutual dipole-dipole interaction between them Walther et al. (2018), their fluorescence Takahata and Naka (2018) and inter-excitonic transitions Krüger and Scheel (2019) have been studied. Additionally, proposals have been put forward to use them for the implementation of masers Ziemkiewicz and Zielińska-Raczyńska (2018, 2019) as well as the realisation of topological spin phases in lattice potentials Poddubny and Glazov (2019).
Another effect that has sparked substantial interest is the perturbation by free carriers, i.e. the electron-hole plasma Heckötter et al. (2018b); Semkat et al. (2019). It has been observed that the introduction of an electron-hole plasma by pumping above the band gap leads to a Mott transition for the Rydberg excitons. There, the band gap is lowered but the positions of the excitonic resonances are almost unaffected until the band gap crosses them, and the resonances vanish into the ionisation continuum Heckötter et al. (2018b). The apparent suppression of the highest exciton resonances follows a similar phenomenology as the Rydberg blockade mechanism. In addition to this plasma-induced shift of the band gap, the experiments revealed a static shift that is already present without the introduction of free charge carriers.
It has long been proposed that disorder introduced, e.g., by charged impurities might lead to the appearance of an exponential decay of the absorption coefficient below the band gap, as well as a shifted band gap Dow and Redfield (1972). Charged impurities may form in a compensated semiconductor, containing both acceptors and donors, as it can be energetically favourable for donor-acceptor pairs to ionise if their binding energies are sufficiently low (Yu and Cardona, 2010, Sec. 7.1.3). The main point defects present in a typical Cu2O crystal are Cu and O vacancies Biccari (2009); Ito and Masumi (1997) fulfilling this condition and acting as acceptors and donors, respectively. Depending on the density of these defects, however, the oxygen vacancies may form stable charged compound defects with copper vacancies Biccari (2009); Zouaghi et al. (1972) deep inside the band gap. In order for charge neutrality to be upheld, they would have to be compensated by an excess of charged copper vacancies or free electrons. These charged impurities introduce a static electric field in which the exciton resonances may shift or ionise. This can result in a downward shift of the edge of the absorption continuum which can be interpreted as a reduction of the band gap. The influence of the static charged impurities can, at least for low densities of the impurities, be modeled by methods originally derived for atomic systems in ionic plasmas, the micro-field distributions. These describe the statistical distribution of local electric fields which in turn induce statistically distributed Stark shifts and ionisation broadening for the excitonic states. In the absence of a screening plasma, the suitable micro-field distribution is the one derived by Holtsmark in 1919 Holtsmark (1919) as all assumptions (static, uncorrelated and (locally) homogeneous charge distribution) should be fulfilled. We will therefore use it in this work to assess the influence of charged impurities on the absorption spectra of the Rydberg excitons in Cu2O.
The article is structured as follows: In Sec. II we describe the modeling Hamiltonian used as well as the Holtsmark micro-field distribution and discuss the central assumptions. In Sec. III, we will present the numerical spectra, analyse their line parameters and compare them to experimental spectra. Finally, we will provide a discussion of our results and an outlook in Sec. IV.
II Theory of Stark-shifted excitons
The real-space Wannier equation for an exciton perturbed by external, static charges has the form
| (1) | |||
where is the unperturbed excitonic Hamiltonian, is the sign of the perturbing charge and is the crystal permittivity with Carabatos et al. (1968). Furthermore, denote the coordinates of the electron and hole that form the exciton, and the are the coordinates of the charged impurities. Focussing on only one of the charges, introducing center-of-mass and relative coordinates and , respectively, as well as gives for the interaction Hamiltonian
| (2) |
where and are the relative electron and hole masses, respectively. A Taylor expansion around up to first order in yields
| (3) |
and thus
| (4) | |||
where
| (5) |
is the total electric field of all charged impurities. Here, the implicit assumption has been made that the length scale on which varies is large compared to the extension of excitonic states. In this case, the center-of-mass and relative coordinates can be separated if also permits such a separation, and the truncation of the Taylor expansion after the first non-vanishing term is justified. We have tested this assumption via a Monte-Carlo ansatz, implying that within the range of interest (defined by the radius of the largest observable excitons), the median relative deviation from the linear approximation is .
Under the assumption of a static, uncorrelated and homogeneous distribution of perturbing charges, the micro-field distribution can be derived from Eq. (5), yielding the Holtsmark distribution Holtsmark (1919); Iakubov et al. (2013); Pradhan and Nahar (2011)
| (6) |
of the normalised electric field . The normalisation factor corresponds closely to the field induced by a single impurity at a distance of
| (7) |
where denotes the density of charged impurities. coincides roughly with the average distance of the nearest-neighbour impurity at any point. The signs of the perturbing charges are irrelevant, as long as the Taylor expansion in Eq. (3) is limited to the term linear in . Micro-field distributions for more involved scenarios have been derived including, e.g., a screening plasma and charge-carrier correlations Hooper Jr (1966, 1968).
We will focus on the simplest scenario of unscreened charges interacting with hydrogen-like excitons fulfilling the nonparabolic Wannier equation
| (8) |
where is the nonparabolic part of the hole dispersion which is responsible for the excitonic quantum defects. The approach to solve this equation based on reformulating it as a Sturmian Coulomb problem Szmytkowski (2012) has been outlined in Ref. Schöne et al. (2016). The relative absorption coefficients of the Stark spectra are then derived by diagonalisation of the Wannier equation (4) in the basis of the eigenstates of .
If the Hamiltonian of the unperturbed exciton has symmetry as in our model, the quantisation axis can be chosen parallel to . In this case, the excitonic quantisation axes are distributed statistically, which can be taken into account by regarding the exciting light field as unpolarised with respect to the quantisation axis, which leads to spectra independent of the field direction with some constant .
The resonance line shapes are modeled by asymmetric Lorentzians Toyozawa (1964)
| (9) |
where is the oscillator strength, the FWHM linewidth, the frequency and the asymmetry parameter of the -th resonance. For isolated -excitons, the asymmetry can be linked to the frequency dependence of the phononic scattering Toyozawa (1964). In the following, however, the have to be interpreted as empirical parameters used to describe and compare the shapes of the absorption lines in the experimental and numerical spectra as the apparent change in the asymmetry is induced by the superposition of multiple lines. In our model, all of these parameters except for the depend on the electric field . The function has been chosen as
| (10) |
The corresponding line shape resembles an asymmetric Lorentzian with constant asymmetry parameter in the vicinity of the resonance, and a symmetric Lorentzian far away from it. This line shape has been chosen as the use of asymmetric Lorentzians with constant asymmetry leads to a linearly decreasing absorption at the band gap due to the long range decay of all resonances below it. This behaviour is not observed in the experiment, where the absorption increases linearly at the band gap as predicted by Elliot Elliott (1957) and reproduced by symmetric Lorentzians with their long range decay . With this choice of , the transition between the asymmetric and symmetric Lorentzian happens at about . The choice of the parameter is somewhat arbitrary but the resulting spectra are not very sensitive to its exact choice.
The optical transition matrix elements from the crystal vacuum to the eigenstates of are proportional to Elliott (1957)
| (11) |
for unpolarised light, where denotes the radial part of the real-space envelope function. The relative oscillator strengths of the Stark excitons can then be calculated via
| (12) |
where is the -th algebraic eigenvector of the Hamiltonian in Eq. (4) and is the vector of the relative transition matrix elements in Eq. (11), expressed in the chosen basis. The oscillator strengths of the unperturbed excitons scale as due to the second-class nature of the transition from the crystal vacuum to the excitonic state Elliott (1957) (i. e. the transition between the pure Bloch states of valence and conduction band is dipole forbidden at the zone center due to parity).
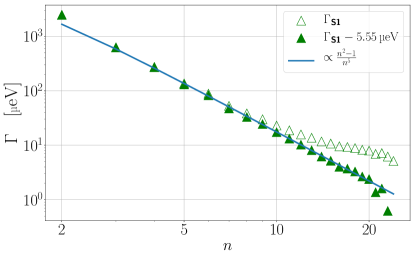
The linewidths were calculated as laid out in Ref. Stolz et al. (2018) for the unperturbed and excitons111Here and in the following refers to states with the orbital quantum numbers respectively, as is common in atomic physics. In general, is only a good quantum number if the Hamiltonian is invariant under the full rotation group , which cannot be the case in a solid state environment. In the cubic symmetry of Cu2O, however, a spherically symmetric approximation is sufficiently good Schöne et al. (2016) as reflected by our choice of . (see Tab. 1). They contain all relevant phononic scattering paths into the yellow and excitons, namely the scattering by LO phonons via the Fröhlich mechanism and the deformation potential scattering by the phonons. For the and excitons, the experimental linewidths are not well described by this theory. We did therefore use extrapolated experimental results from SHG spectra Mund et al. (2018) for the and state, respectively, giving and . In addition, the complete experimental spectra seem to be broadened by . Figure 1 shows the experimental linewidths of one particular absorption spectrum. The deviation from the theoretically expected scaling already observed in Ref. Kazimierczuk et al. (2014) could be explained by the convolution of the spectrum with a broadening Lorentzian, whose origin is unknown to us. We modeled it by adding to all input linewidths.
| 2 | 3 | ||||
|---|---|---|---|---|---|
| 4 | 5 | ||||
| 6 | 7 | ||||
| 8 | 9 | ||||
| 10 | 11 | ||||
| 12 | 13 | ||||
| 14 | 15 | ||||
| 16 | 17 | ||||
| 18 | 19 | ||||
| 20 | 21 | ||||
| 22 | 23 | ||||
| 24 |
The asymmetry of the lines was taken to be for all lines, derived from fits to experimental spectra. Clearly, the model Hamiltonian in Eq. (4) evaluated in a basis of bound excitonic states can only be a reasonable description for Stark-excitons that are themselves bound. This problem could be addressed by complex scaling techniques Zielinski et al. (2020) or the introduction of a complex absorbing potential Grimmel et al. (2017). Fortunately, the states above the classical ionisation threshold Gallagher (2005)
| (13) |
tend to be broadened by the ionisation as well as the averaging over the micro-field distribution as they are very sensitive to variations of the electric field. Our assumption is thus, that the ionised states only contribute to a continuous background to the absorption spectrum but do not account for prominent absorption lines. Once the Stark spectra are calculated, the Holtsmark spectra can be derived via
| (14) |
The integration was performed on a logarithmic grid in with for field strengths from to via the finite difference summation where .
To summarise this section, the central assumptions of our model are:
-
1.
The charged impurities are static and their distribution is homogeneous and uncorrelated.
-
2.
The electric field induced by the impurities varies on length scales considerably larger than the extension of the excitonic states of interest.
-
3.
The spectral structure is dominated by bound excitons below the classical ionisation threshold.
III Numerical results and comparison to experimental data
We will now apply our numerical method to the resonance spectrum of Rydberg excitons and compare with two experimental absorption spectra with maximum observable principal quantum numbers of (hereafter S1) and (hereafter S2). The spectrum S1 measured at is the one used in the Ref. Kazimierczuk et al. (2014) and S2 was measured at . The quantity denotes the principal quantum number above which the resonances form an apparent absorption continuum and no individual lines can be resolved. There is, of course, some uncertainty in the definition of the highest observable principal quantum number . In our analysis, a resonance was considered to have vanished as soon as its spectral range could not be reliably fitted with the line shape in Eq. (9). Figure 2 (a) compares S1 with a numerical spectrum derived for which was chosen to reproduce while (b) compares S2 to a numerical spectrum for . The numerical spectrum in Fig. 2 (b) shows weak additional lines corresponding predominantly to the -, - and excitons, which become dipole allowed due to the broken rotational symmetry (see inset). The original experimental spectra contain a background induced by the phonon-assisted absorption into the and states Schöne et al. (2017). This background has been subtracted for the comparison with the numerical spectra, leading to the appearance of a negative absorption coefficient on the high-energy side of the lower resonances.
For the numerical computation, we took into account all states with , as well as . This results in basis sets of dimension for and for . The calculation can be restricted to these three magnetic quantum numbers as the Stark Hamiltonian has cylindrical symmetry which ensures that remains a good quantum number (if the quantisation axis is chosen as ) and the optically active -states can only be mixed into other states with .
One observes that:
-
1.
Excitons with large principal quantum numbers smear out and form an absorption continuum while the total oscillator strength is conserved.
-
2.
The transition from negative asymmetry parameters for low principal quantum numbers to positive ones for the highest , which have been observed in experimental spectra, is reproduced.
-
3.
Due to the breaking of the rotational symmetries by the Stark effect, additional absorption lines – corresponding to initially dark states – appear in the numerical spectra for high impurity densities. The strongest additional lines correspond to the -, - and -states.
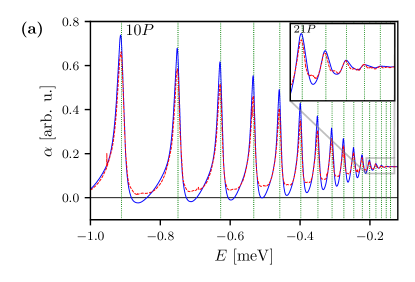
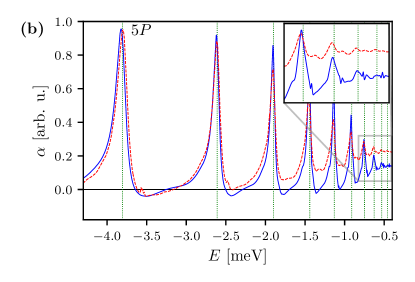
Figure 3 shows the line parameters derived by fits to the numerical spectra under the assumption that the underground below each line is constant over its width. The oscillator strength [Fig. 3 (a)] drops off steeply before the lines vanish starting at , an observation that could be explained by neither plasma nor phonon interactions Semkat et al. (2019). Compared to the experiment, however, the oscillator strength follows the scaling for longer and drops off more steeply for large . Note, that the experimental oscillator strengths in Fig. 3 (a) have been normalised to the numerical ones at as their absolute values cannot be compared.
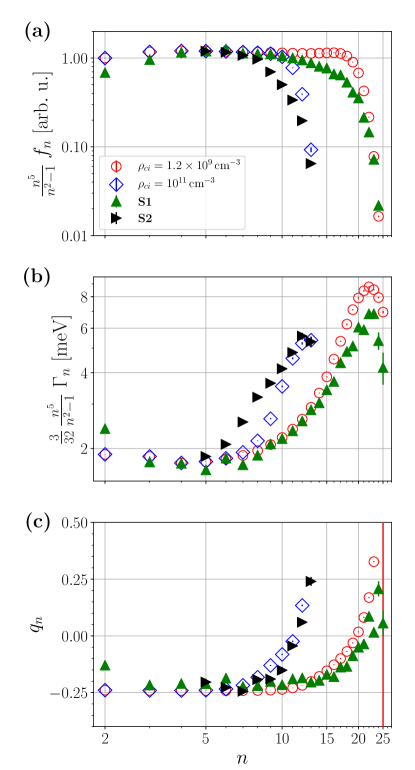
The FWHM linewidths [Fig. 3 (b)] start to deviate from the linewidths of the unperturbed resonances and drop off shortly before . Additional inhomogeneous broadening could be introduced by an inhomogeneous straining of the crystal, the ionisation of states below the classical ionisation threshold Heckötter et al. (2018a) or the higher orders of the Taylor expansion, Eq. (3), which will become relevant when the electric field varies on the length scale of the exciton diameter. Furthermore, there could be additional sources of micro fields with different micro-field distributions, for example optical phonons Dow and Redfield (1972) or surface charges. The asymmetry parameter [Fig. 3 (c)] deviates from the value for the unperturbed lines for large principal quantum numbers and changes sign for .
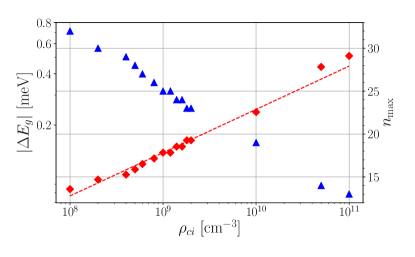
From the numerical spectra, we can extract the maximally observable principal quantum number as well as the shift of the band gap. Figure 4 shows the dependence of this band-gap shift on the density of charged impurities. To a good approximation, it follows a power law . This scaling agrees with the dependence of the band-gap shift on the plasma density derived from many-body theory Semkat et al. (2019). In our case, however, this is a purely empirical observation. We have not investigated whether this scaling holds outside the range of impurity densites given here. Clearly, it will have to break down at some point for large , as the assumptions made in the derivation of the Holtsmark distribution break down.
IV Discussion and Outlook
In this work, we have numerically investigated the influence of charged impurities on the spectrum of (Rydberg) excitons in Cu2O. Out calculations reproduce experimentally observed phenomena such as the vanishing of the resonances with high principal quantum numbers into an apparent absorption continuum, accompanied by a drop of the oscillator strength of the discernible lines, a broadening as well as a change of the line shape towards positive asymmetry parameters .
The breaking of the rotational symmetries inherent in our model leads to the redistribution of oscillator strength to initially dark states and the corresponding appearance of weak additional absorption lines in the spectra for impurity densities greater . In the experimental spectrum S2 (Fig. 2 (b)) there are indeed some indications for such peaks, however, the signal/noise ratio of the present spectrum does not allow for a conclusive analysis. In every case, the non-appearance of such peaks may be used to establish an upper bound on the charged impurity density of given crystal samples.
Acknowledgements.
We thank Prof. Manfred Bayer and his group at the TU Dortmund for sharing their experimental data and D. Semkat (Greifswald) for helpful discussions. We acknowledge support by the Deutsche Forschungsgemeinschaft (DFG) within the SPP 1929 “Giant Interactions in Rydberg Systems (GiRyd)”.References
- Wannier (1937) G. H. Wannier, The structure of electronic excitation levels in insulating crystals, Phys. Rev. 52, 191 (1937).
- Gross and Karryev (1952) E. F. Gross and N. A. Karryev, Opticheskii spektr eksitona, Doklady Akademii Nauk SSSR 84, 471 (1952).
- Gross (1956) E. F. Gross, Optical spectrum of excitons in the crystal lattice, Il Nuovo Cimento (1955-1965) 3, 672 (1956).
- Kazimierczuk et al. (2014) T. Kazimierczuk, D. Fröhlich, S. Scheel, H. Stolz, and M. Bayer, Giant Rydberg excitons in the copper oxide Cu2O, Nature 514, 343 (2014).
- Schöne et al. (2016) F. Schöne, S. O. Krüger, P. Grünwald, H. Stolz, S. Scheel, M. Aßmann, J. Heckötter, J. Thewes, D. Fröhlich, and M. Bayer, Deviations of the exciton level spectrum in Cu2O from the hydrogen series, Phys. Rev. B 93, 075203 (2016).
- Schweiner et al. (2016) F. Schweiner, J. Main, M. Feldmaier, G. Wunner, and C. Uihlein, Impact of the valence band structure of Cu2O on excitonic spectra, Phys. Rev. B 93, 195203 (2016).
- Alvermann and Fehske (2018) A. Alvermann and H. Fehske, Exciton mass and exciton spectrum in the cuprous oxide, J. Phys. B: At. Mol. Opt. Phys. 51, 044001 (2018).
- Schweiner et al. (2017) F. Schweiner, J. Main, G. Wunner, M. Freitag, J. Heckötter, C. Uihlein, M. Aßmann, D. Fröhlich, and M. Bayer, Magnetoexcitons in cuprous oxide, Phys. Rev. B 95, 035202 (2017).
- Kurz et al. (2017) M. Kurz, P. Grünwald, and S. Scheel, Excitonic giant-dipole potentials in cuprous oxide, Phys. Rev. B 95, 245205 (2017).
- Heckötter et al. (2018a) J. Heckötter, M. Freitag, D. Fröhlich, M. Aßmann, M. Bayer, M. A. Semina, and M. M. Glazov, Dissociation of excitons in Cu2O by an electric field, Phys. Rev. B 98, 035150 (2018a).
- Zielinski et al. (2020) P. Zielinski, P. Rommel, F. Schweiner, and J. Main, Rydberg excitons in electric and magnetic fields obtained with the complex-coordinate-rotation method, J. Phys. B: At. Mol. Opt. Phys. 53, 054004 (2020).
- Artyukhin et al. (2018) S. Artyukhin, D. Fishman, C. Faugeras, M. Potemski, A. Revcolevschi, M. Mostovoy, and P. H. van Loosdrecht, Magneto-absorption spectra of hydrogen-like yellow exciton series in cuprous oxide: excitons in strong magnetic fields, Scientific Reports 8, 1 (2018).
- Walther et al. (2018) V. Walther, S. O. Krüger, S. Scheel, and T. Pohl, Interactions between Rydberg excitons in Cu2O, Phys. Rev. B 98, 165201 (2018).
- Takahata and Naka (2018) M. Takahata and N. Naka, Photoluminescence properties of the entire excitonic series in Cu2O, Phys. Rev. B 98, 195205 (2018).
- Krüger and Scheel (2019) S. O. Krüger and S. Scheel, Interseries transitions between Rydberg excitons in Cu2O, Phys. Rev. B 100, 085201 (2019).
- Ziemkiewicz and Zielińska-Raczyńska (2018) D. Ziemkiewicz and S. Zielińska-Raczyńska, Proposal of tunable Rydberg exciton maser, Opt. Lett. 43, 3742 (2018).
- Ziemkiewicz and Zielińska-Raczyńska (2019) D. Ziemkiewicz and S. Zielińska-Raczyńska, Solid-state pulsed microwave emitter based on Rydberg excitons, Opt. Exp. 27, 16983 (2019).
- Poddubny and Glazov (2019) A. N. Poddubny and M. M. Glazov, Topological spin phases of trapped Rydberg excitons in Cu2 O, Phys. Rev. Lett. 123, 126801 (2019).
- Heckötter et al. (2018b) J. Heckötter, M. Freitag, D. Fröhlich, M. Aßmann, M. Bayer, P. Grünwald, F. Schöne, D. Semkat, H. Stolz, and S. Scheel, Rydberg excitons in the presence of an ultralow-density electron-hole plasma, Phys. Rev. Lett. 121, 097401 (2018b).
- Semkat et al. (2019) D. Semkat, H. Fehske, and H. Stolz, Influence of electron-hole plasma on Rydberg excitons in cuprous oxide, Phys. Rev. B 100, 155204 (2019).
- Dow and Redfield (1972) J. D. Dow and D. Redfield, Toward a unified theory of Urbach’s rule and exponential absorption edges, Phys. Rev. B 5, 594 (1972).
- Yu and Cardona (2010) P. Yu and M. Cardona, Fundamentals of semiconductors: physics and materials properties (Springer Verlag, Berlin, 2010).
- Biccari (2009) F. Biccari, Defects and Doping in Cu2O, Ph.D. thesis, Universita di Roma (2009).
- Ito and Masumi (1997) T. Ito and T. Masumi, Detailed examination of relaxation processes of excitons in photoluminescence spectra of Cu2O, J. Phys. Soc. Jpn. 66, 2185 (1997).
- Zouaghi et al. (1972) M. Zouaghi, B. Prevot, C. Carabatos, and M. Sieskind, Near infrared optical and photoelectric properties of cu2o. iii. interpretation of experimental results, phys. stat. sol. (a) 11, 449 (1972).
- Holtsmark (1919) J. Holtsmark, Über die Verbreiterung von Spektrallinien, Ann. Phys. 363, 577 (1919).
- Carabatos et al. (1968) C. Carabatos, A. Diffiné, and M. Sieskind, Contribution à l’étude des bandes fondamentales de vibration du réseau de la cuprite (Cu2O), Journal de Physique 29, 529 (1968).
- Iakubov et al. (2013) I. T. Iakubov, G. Kobzev, and M. Popovich, Transport and optical properties of nonideal plasma (Springer Science & Business Media, 2013).
- Pradhan and Nahar (2011) A. K. Pradhan and S. N. Nahar, Atomic astrophysics and spectroscopy (Cambridge University Press, 2011).
- Hooper Jr (1966) C. Hooper Jr, Electric microfield distributions in plasmas, Phys. Rev 149, 77 (1966).
- Hooper Jr (1968) C. Hooper Jr, Low-frequency component electric microfield distributions in plasmas, Phys. Rev. 165, 215 (1968).
- Szmytkowski (2012) R. Szmytkowski, Alternative approach to the solution of the momentum-space Schrödinger equation for bound states of the N-dimensional Coulomb problem, Annalen der Physik 524, 345 (2012).
- Toyozawa (1964) Y. Toyozawa, Interband effect of lattice vibrations in the exciton absorption spectra, J. Phy. Chem. Sol. 25, 59 (1964).
- Elliott (1957) R. Elliott, Intensity of optical absorption by excitons, Phys. Rev. 108, 1384 (1957).
- Stolz et al. (2018) H. Stolz, F. Schöne, and D. Semkat, Interaction of Rydberg excitons in cuprous oxide with phonons and photons: optical linewidth and polariton effect, New J. Phys. 20, 023019 (2018).
- Mund et al. (2018) J. Mund, D. Fröhlich, D. R. Yakovlev, and M. Bayer, High-resolution second harmonic generation spectroscopy with femtosecond laser pulses on excitons in Cu2O, Phys. Rev. B 98, 085203 (2018).
- Grimmel et al. (2017) J. Grimmel, M. Stecker, M. Kaiser, F. Karlewski, L. Torralbo-Campo, A. Günther, and J. Fortágh, Ionization spectra of highly Stark-shifted rubidium Rydberg states, Phys. Rev. A 96, 013427 (2017).
- Gallagher (2005) T. F. Gallagher, Rydberg atoms, Vol. 3 (Cambridge University Press, 2005).
- Schöne et al. (2017) F. Schöne, H. Stolz, and N. Naka, Phonon-assisted absorption of excitons in , Phys. Rev. B 96, 115207 (2017).