Recommending Deployment Strategies for Collaborative Tasks
Abstract
Our work contributes to aiding requesters in deploying collaborative tasks in crowdsourcing. We initiate the study of recommending deployment strategies for collaborative tasks to requesters that are consistent with deployment parameters they desire: a lower-bound on the quality of the crowd contribution, an upper-bound on the latency of task completion, and an upper-bound on the cost incurred by paying workers. A deployment strategy is a choice of value for three dimensions: Structure (whether to solicit the workforce sequentially or simultaneously), Organization (to organize it collaboratively or independently), and Style (to rely solely on the crowd or to combine it with machine algorithms). We propose StratRec, an optimization-driven middle layer that recommends deployment strategies and alternative deployment parameters to requesters by accounting for worker availability. Our solutions are grounded in discrete optimization and computational geometry techniques that produce results with theoretical guarantees. We present extensive experiments on Amazon Mechanical Turk, and conduct synthetic experiments to validate the qualitative and scalability aspects of StratRec.
1 Introduction
Despite becoming a popular mean of deploying tasks, crowdsourcing offers very little help to requesters. In particular, task deployment requires that requesters identify appropriate deployment strategies. A strategy involves the interplay of multiple dimensions: Structure (whether to solicit the workforce sequentially or simultaneously), Organization (to organize it collaboratively or independently), and Style (to rely on the crowd alone or on a combination of crowd and machine algorithms). A strategy needs to be commensurate to deployment parameters desired by a requester, namely, a lower-bound on quality, an upper-bound on latency, and an upper-bound on cost. For example, for a sentence translation task, a requester wants the translated sentences to be at least % as good as the work of a domain expert, in a span of at most days, and at a maximum cost of $. Till date, the burden is entirely on requesters to design deployment strategies that satisfy desired parameters. Our effort in this paper is to present a formalism and computationally efficient algorithms to recommend multiple strategies (namely ) to the requester that are commensurate to her deployment parameters, primarily for collaborative tasks.
A recent work (Borromeo et al., 2017) investigated empirically the deployment of text creation tasks in Amazon Mechanical Turk (AMT). The authors validated the effectiveness of different propose to automate strategy recommendation. This is particularly challenging because the estimation of the cost, quality and latency of a strategy for a given deployment request must account for many factors.
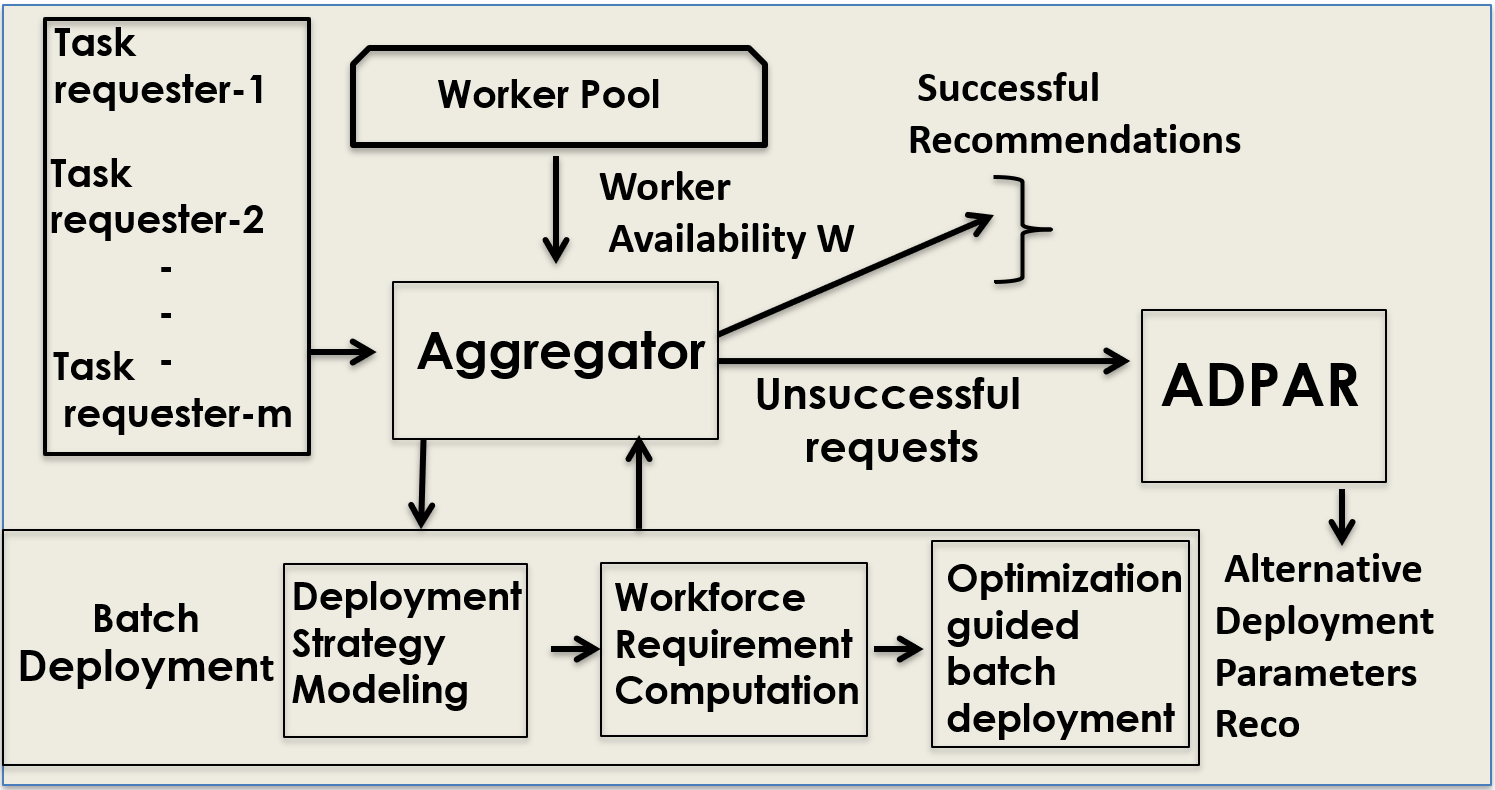
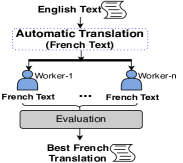
To realize our contributions, we develop StratRec (refer to Figure 1), an optimization-driven middle layer that sits between requesters, workers, and platforms. StratRec has two main modules: Aggregator and Alternative Parameter Recommendation (ADPaR in short). Aggregator is responsible for recommending strategies to a batch of such incoming strategies for different collaborative tasks, such as text summarization and text translation, and provided evidence for the need to guide requesters in choosing the right strategy. In this paper, we deployment requests, considering worker availability. If the platform does not have enough qualified workers to satisfy all requests, Aggregator triages them by optimizing platform-centric goals, i.e., to maximize throughput or pay-off (details in Section 2.2). Unsatisfied requests are sent to the Alternative Parameter Recommendation module (ADPaR), that recommends different deployment parameters for which strategies are available.
In principle, recommending deployment strategies involves modeling worker availability considering their skills for the tasks that require deployment. This gives rise to a complex function that estimates parameters (quality, latency, and cost) of a strategy considering worker skills, task types, and worker availability. As the first ever principled investigation of strategy recommendation in crowdsourcing, we first make a binary match between workers’ skills and task types and then estimate strategy parameters considering those workers’ availability. Worker availability is captured as a probability distribution function (pdf) by leveraging historical data on a platform. For example, the pdf can capture that there is a 70% chance of having of the workers and a 30% chance of having 2% of the workers available who are suitable to undertake a certain type of task. In expectation, this gives rise to % of available workers. If a platform has total workers available to undertake a certain type of task, that gives rise to a total of available workers in an expected sense. StratRec works with such expected values.
Contribution 1. Modeling and Formalism: We present a general framework StratRec for modeling quality, cost, and latency of a set of collaborative tasks, when deployed based on a strategy considering worker availability (Section 3.1). The first problem we study is Batch Deployment Recommendation inside to deploy a batch of tasks to maximize two different platform-centric criteria: task throughput and pay-off. After that, unsatisfied requests are sent one by one to the Alternative Parameter Recommendation module (ADPaR). ADPaR solves an optimization problem that recommends alternative parameters for which deployment strategies exist. For instance, if a request has a very small latency threshold that cannot be attained based on worker availability, ADPaR may recommend to increase the latency and cost thresholds to find legitimate strategies. ADPaR does not arbitrarily choose the alternative deployment parameters. It recommends those alternative parameters that are closest, i.e., minimizing the distance to the ones specified.
Contribution 2. Algorithms: In Section 3, we design BatchStrat, a unified algorithmic framework to solve the Batch Deployment Recommendation problem. BatchStrat is greedy in nature and provides exact results for the throughput maximization problem, and a -approximation factor for the pay-off maximization problem (which is NP-hard). In Section 4, we develop ADPaR-Exact to solve ADPaR that is geometric and exploits the fact that our objective function is monotone (Equation 3). Even though the original problem is defined in a continuous space, we present a discretized technique that is exact. ADPaR-Exact employs a sweep-line technique De Berg et al. (1997) that gradually relaxes quality, cost, and latency, and is guaranteed to produce the tightest alternative parameters for which deployment strategies exist.
Contribution 3. Experiments: We conduct comprehensive real-world deployments for text editing applications with real workers and rigorous synthetic data experiments (Section 5). The former validate that worker availability varies over time, and could be reasonably estimated through multiple real world deployments. It also shows with statistical significance that cost, quality, latency have a linear relationship with worker availability for text editing tasks. Our real data experiments (Section 5.1.2) also validate that when tasks are deployed considering recommendation of StratRec, with statistical significance, they achieve higher quality and lower latency, under the fixed cost threshold on an average, compared to the deployments that do not consult StratRec. These results validate the effectiveness of deployment recommendations of our proposed frameworks and its algorithms.
2 Framework and Problem
2.1 Data Model
Crowdsourcing Tasks: A platform is designed to crowdsource tasks, deployed by a set of requesters and undertaken by crowd workers. We consider collaborative tasks such as sentence translation, text summarization, and puzzle solving Pilourdault et al. (2017); Rahman et al. (2018).
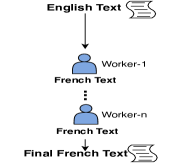
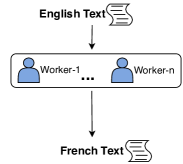
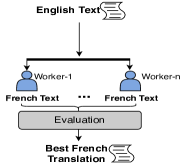
Deployment Strategies: A deployment strategy Kadi ([n.d.]) instantiates three dimensions: Structure (sequential or simultaneous), Organization (collaborative or independent), and Style (crowd-only or crowd and algorithms). We rely on common deployment strategies Kadi ([n.d.]); Borromeo et al. (2017) and refer to them as . Figure 2 enlists some strategies that are suitable for text translation tasks (from English to French in this example). For instance, SEQ-IND-CRO in Figure 2(a) dictates that workers complete tasks sequentially (SEQ), independently (IND) and with no help from algorithms (CRO). In SIM-COL-CRO (Figure 2(b)), workers are solicited in parallel (SIM) to complete a task collaboratively (COL) and with no help from algorithms (CRO). The last strategy SIM-IND-HYB dictates a hybrid work style (HYB) where workers are combined with algorithms, for instance with Google Translate.
A platform could provide the ability to implement some strategies. For instance, communication between workers enables SEQ while collaboration enables COL. Additionally, coordination between machines and humans may enable HYB. Therefore, strategies could be implemented inside or outside platforms. In the latter, a platform could be used solely for hiring workers who are then redirected to an environment where strategies are implemented. In all cases, we will assume a set of strategies for a given platform.
For the purpose of illustration, we will only use a few strategies in this paper. However, in principle, the number of possible strategies could be very large. The closest analogy is query plans in relational databases in which joins, selections and projections could be combined any number of times and in different orders. Let us assume a collaborative task that involves workers and that . Even when the same combination of Structure, Organization, and Style appears at most once in a strategy, the number of possible strategies is essentially of the order of
. That is, if Structure, Organization, and Style, have unique choices each, the number of possible strategies is in the order of . Now, if the same combination of Structure, Organization, and Style can appear any number of times, the number of possible strategies becomes infinite. Additionally, there exists multiple real world tools Turkomatic Kulkarni
et al. (2012) or Soylent Bernstein et al. (2010), that aid requesters in planning and solving collaborative tasks. In Turkomatic, while workers decompose and solve tasks, requesters can view the status of worker-designed workflows in real time; intervene to change tasks; and request new solutions. For instance, with tasks in the workflow, there are possible strategies (e.g., strategies for and ). Such tools would certainly benefit from strategy recommendation.
Task Requests and Deployment Parameters:
A requester intends to find one or more strategies (notationally , a small integer) for a deployment with parameters on quality, cost, and latency (, , ) such that, when a task in is deployed using strategy , it is estimated to achieve a crowd contribution quality , by spending at most , and the deployment will last at most .
| Quality | Cost | Latency | |
.
Example 1: Assume there are () task deployment requests for different types of collaborative sentence translation tasks. The first requester is interested in deploying sentence translation tasks for days (out of days), at a cost up to $ (out of max), and expects the quality of the translation to reach at least of domain expert quality. Table 1 presents these after normalization between . We set .
A strategy is suitable to be recommended to , if & & . Estimating the parameters , , for each and deployment requires accounting for the worker pool and their skills who are available to undertake tasks in . A simple yet reasonable approach to that is to first match task types in a deployment request with workers’ skills to select a pool of workers. Following that, we account for worker availability from this selected pool, since the deployed tasks are to be done by those workers. Thus, the (estimated) quality, cost and latency of a strategy for a task is a function of worker availability, considering a selected pool of workers who are suitable for the tasks.
Worker Availability: Worker availability is a discrete random variable and is represented by its corresponding distribution function (pdf), which gives the probability of the proportion of workers who are suitable and available to undertake tasks of a certain type within a specified time (refer to Example 2.1). This pdf is computed from historical data on workers’ arrival and departure on a platform. StratRec computes the expected value of this pdf to represent the available workforce , as a normalized value in . In the remainder of the paper, worker availability stands for worker availability in expectation, unless otherwise specified. How to accurately estimate worker availability is an interesting yet orthogonal problem and not our focus here.
2.2 Illustration of StratRec
StratRec is an optimization-driven middle layer that sits between requesters, workers, and platforms. At any time, a crowdsourcing platform has a batch of deployment requests each with its own parameters as defined above, coming from different requesters. StratRec is composed of two main modules - Aggregator and Alternative Parameter Recommendation (or ADPaR).
For the purpose of illustration, continuing with Example 2.1, consists of the set of deployment strategies, as shown in Figure 2: SIM-COL-CRO, SEQ-IND-CRO, SIM-IND-CRO, SIM-IND-HYB. To ease understanding, we name them as , , , , respectively.
These requests, once received by StratRec, are sent to the Aggregator. First, it analyzes the Worker Pool to estimate worker availability. There is a probability of having workers and a probability of having workers out of suitable workers for sentence translation tasks available for the next days. Thus, the expected worker availability is . After that, it consults the Deployment Strategy Modeling in Batch Deployment module to estimate quality, cost, and latency of a strategy (more in Section 3.1) for a deployment. Since all deployments are of same type, Equation 4, could be used to estimate those Strategy parameters (also presented in Table 1). Then, it consults the Workforce Requirement Computation to estimate workforce requirement of each strategy (more in Section 3.2 and Figure 3). Finally, the Optimization Guided Batch Deployment (refer to Section 3.3) is invoked to select a subset of requests that optimizes the underlying goal and recommends strategies for each. Each unsatisfied request is sent to ADPaR that recommends an alternative deployment to the requester for which there exists deployment strategies.
Using Example 2.1, out of the three deployment requests, only could be fully served (considering either throughput or pay-off objective) and , , are recommended. and are then sent to ADPaR one by one.
2.3 Problem Definitions
Problem 1.
Batch Deployment Recommendation: Given an optimization goal , a set of strategies, a batch of deployment requests from different requesters, where the -th task deployment is associated with parameters , and , and worker availability , distribute among these requests by recommending strategies for each request, such that is optimized.
The high level problem optimization problem could be formalized as:
| (1) | ||||
where is the optimization value of deployment and is the workforce required to successfully recommend strategies it. A deployment request is successful, if for each of the strategies in the recommended set of strategies , the following three criteria are met: , and .
Using Example 2.1, is successful, as it will return , such that & & , and it could be deployed with the available workforce .
In this work, is designed to maximize one of two different platform centric-goals: task throughput and pay-off.
Throughput maximizes the total number of successful strategy recommendations without exceeding . Formally,
| (2) | ||||
Pay-off maximizes , if is a successful deployment request without exceeding . The rest of the formulation is akin to Equation 2.
Problem 2.
Alternative Parameter Recommendation: Given a deployment , worker availability , a set of deployment strategies , and a cardinality constraint , ADPaR recommends an alternative deployment and associated strategies, such that, the Euclidean distance () between and is minimized.
Formally, our problem could be stated as a constrained optimization problem:
| min | (3) | |||||
| s.t. | ||||||
Based on Example 2.1, if ADPaR takes the following input values and . For , the alternative recommendation should be with three strategies .
3 Deployment Recommendation
We describe our proposed solution for Batch Deployment Recommendation (Problem 1). Given requests and , the Aggregator invokes BatchStrat, our unified solution to solve the batch deployment recommendation problem. There are three major steps involved. BatchStrat first obtains model parameters of a set of candidate strategies (Section 3.1), then computes workforce requirement to satisfy these requests (Section 3.2), and finally performs optimization to select a subset of deployment requests, such that different platform-centric optimization goals could be achieved (Section 3.3).
We first provide an abstraction which serves the purpose of designing BatchStrat. Given deployment requests and workforce availability, we intend to compute a two dimensional matrix , where there are columns that map to available deployment strategies and rows of different deployment requests. Figure 3a shows the matrix built for Example 2.1. A cell in this matrix estimates the workforce required to deploy -th request using -th strategy. This matrix is crucial to enable platform centric optimization for batch deployment.
3.1 Deployment Strategy Modeling
BatchStrat first performs deployment strategy modeling to estimate quality, cost, latency of a strategy for a given deployment request . As the first principled solution, it models these parameters as a linear function of worker availability, from the filtered pool of workers whose profiles match tasks in the deployment request 111We note that StratRec could be adapted for tasks that do not exhibit such linear relationships.. Therefore, if is deployed using strategy , the quality parameter of this deployment is modeled as:
| (4) |
Our experimental evaluation (Table 6) in Section 5.1, performed on AMT validates this linearity assumption with statistical significance for two text editing tasks.
Model parameters and are obtained for every , , and parameter (quality, cost, latency) combination, by fitting historical data to this linear model. Once these parameters are known, BatchStrat uses Equation 4 again to estimate workforce requirement to satisfy quality threshold (cost and latency like-wise) for deployment using strategy . We repeat this exercise for each , which comprises our set of candidate strategies for a deployment .
3.2 Workforce Requirement Computation
The goal of the Workforce Requirement Computation is to estimate workforce requirement per (deployment, strategy) pair. It performs that in two sub-steps, as described below.
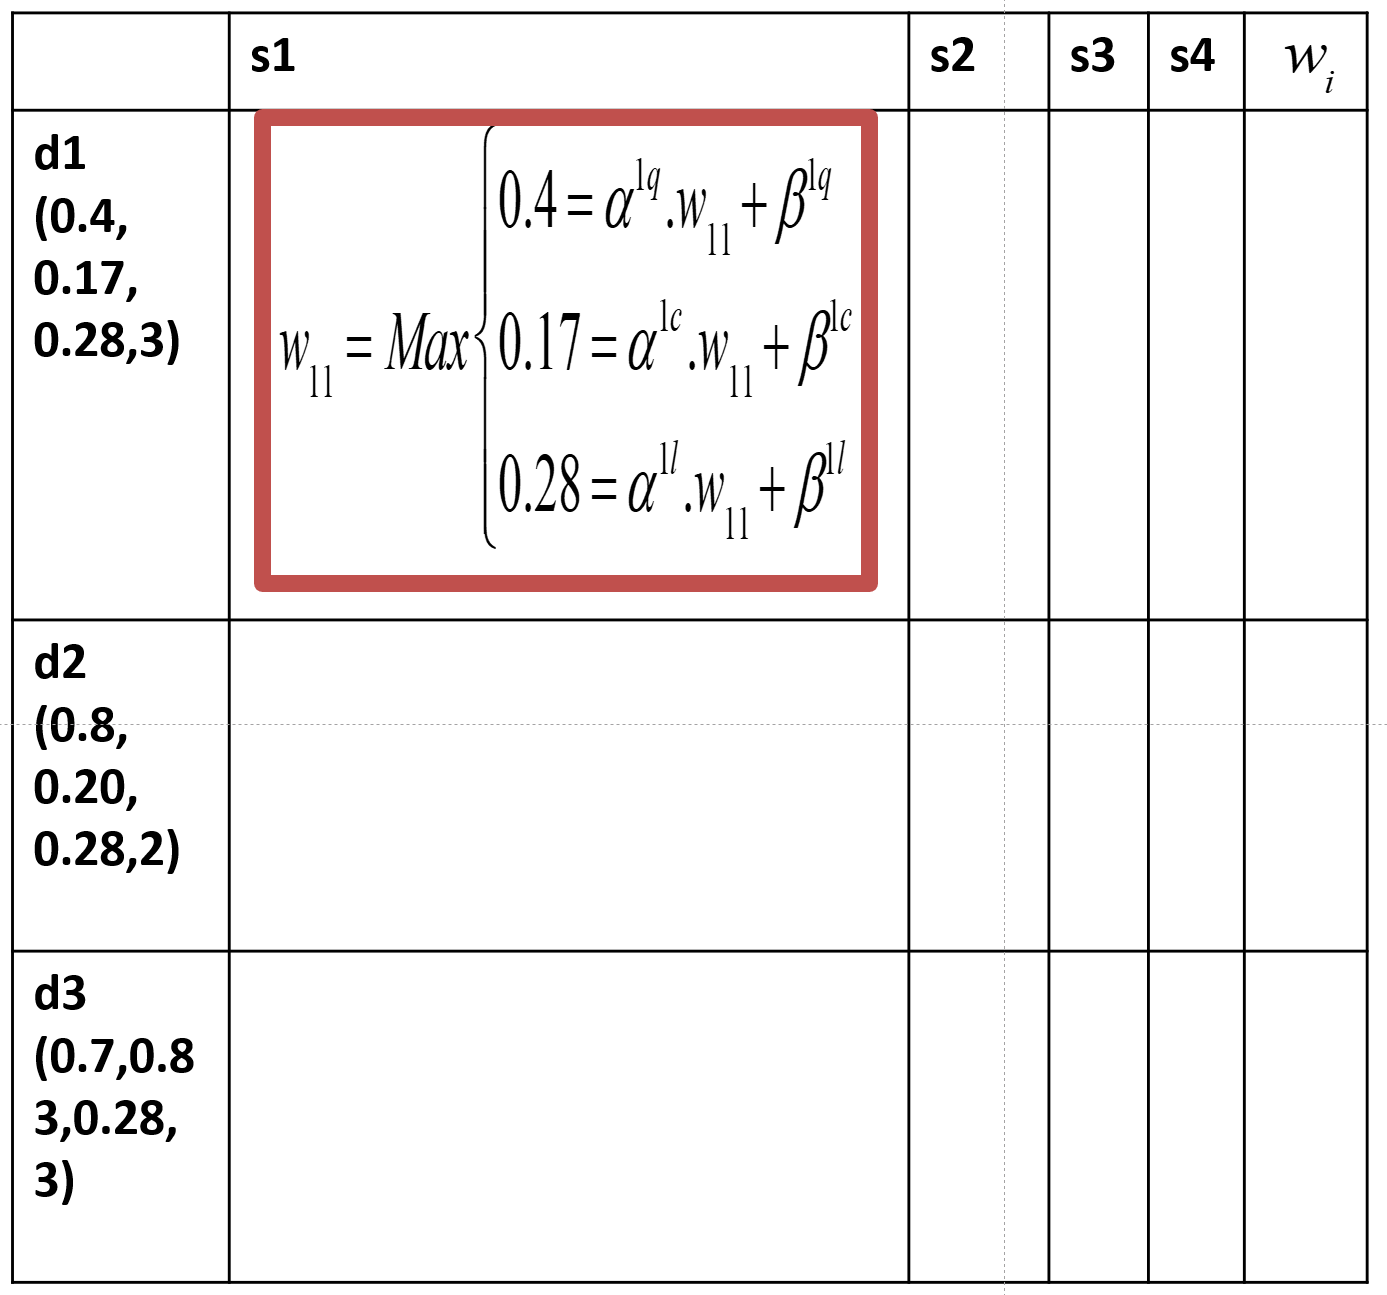
(1) Computing Matrix : The first step is to compute , where represents the workforce requirement of deploying with strategy . Recall that in Equation 4, as long as for a deployment , the deployment parameters on quality, cost, and latency, i.e., , and are known, for a strategy, , we can compute , i.e., that is the minimum workforce needed to achieve those thresholds, by considering the equality condition, i.e., (similarly for cost and latency), and solving Equation 4 for , with known () values.
Using Example 2.1, the table in Figure 3a shows the rows and columns of matrix and how a workforce requirement could be calculated for . Basically, once we solve the workforce requirement of quality, cost, and latency(, , ), the overall workforce requirement of deploying using is the maximum over these three requirements. Formally, they could be stated as follows:
Using Example 2.1, is the maximum over . Figure 3a shows how needs to be computed for deployment and strategy for the running example.
Running Time: Running time of computing is , since computing each cell takes constant time.
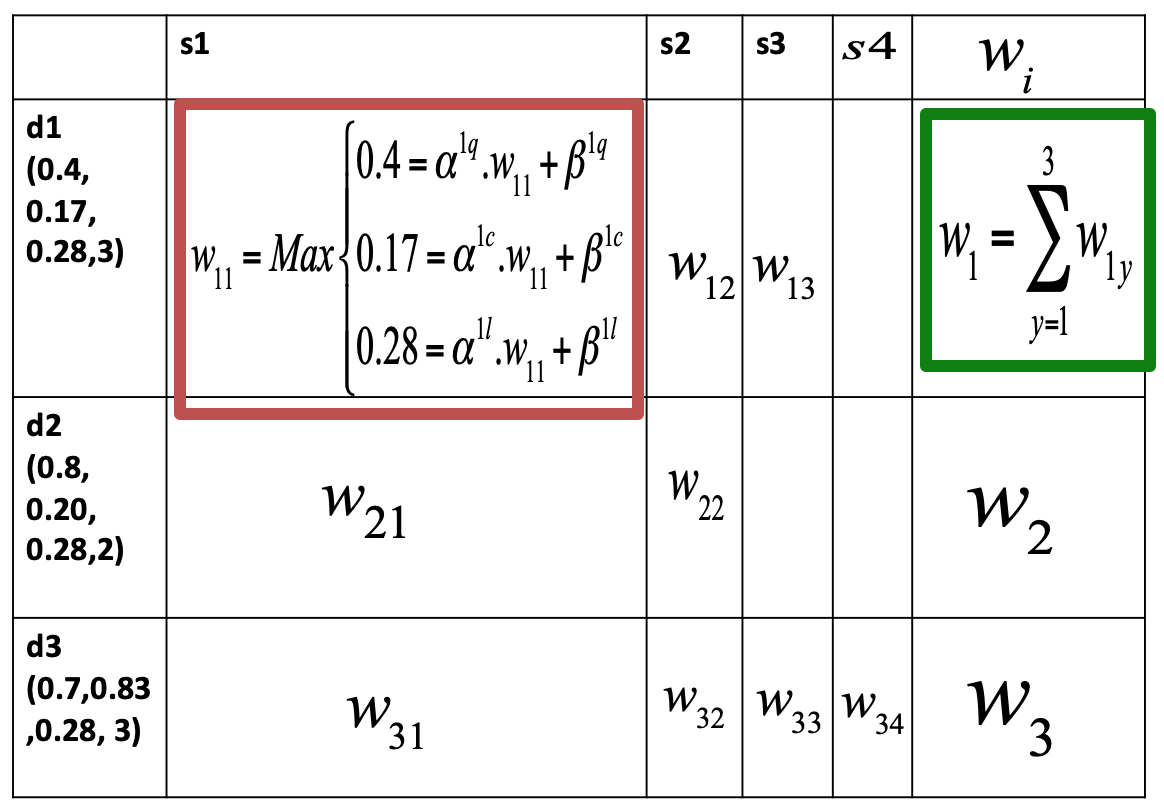
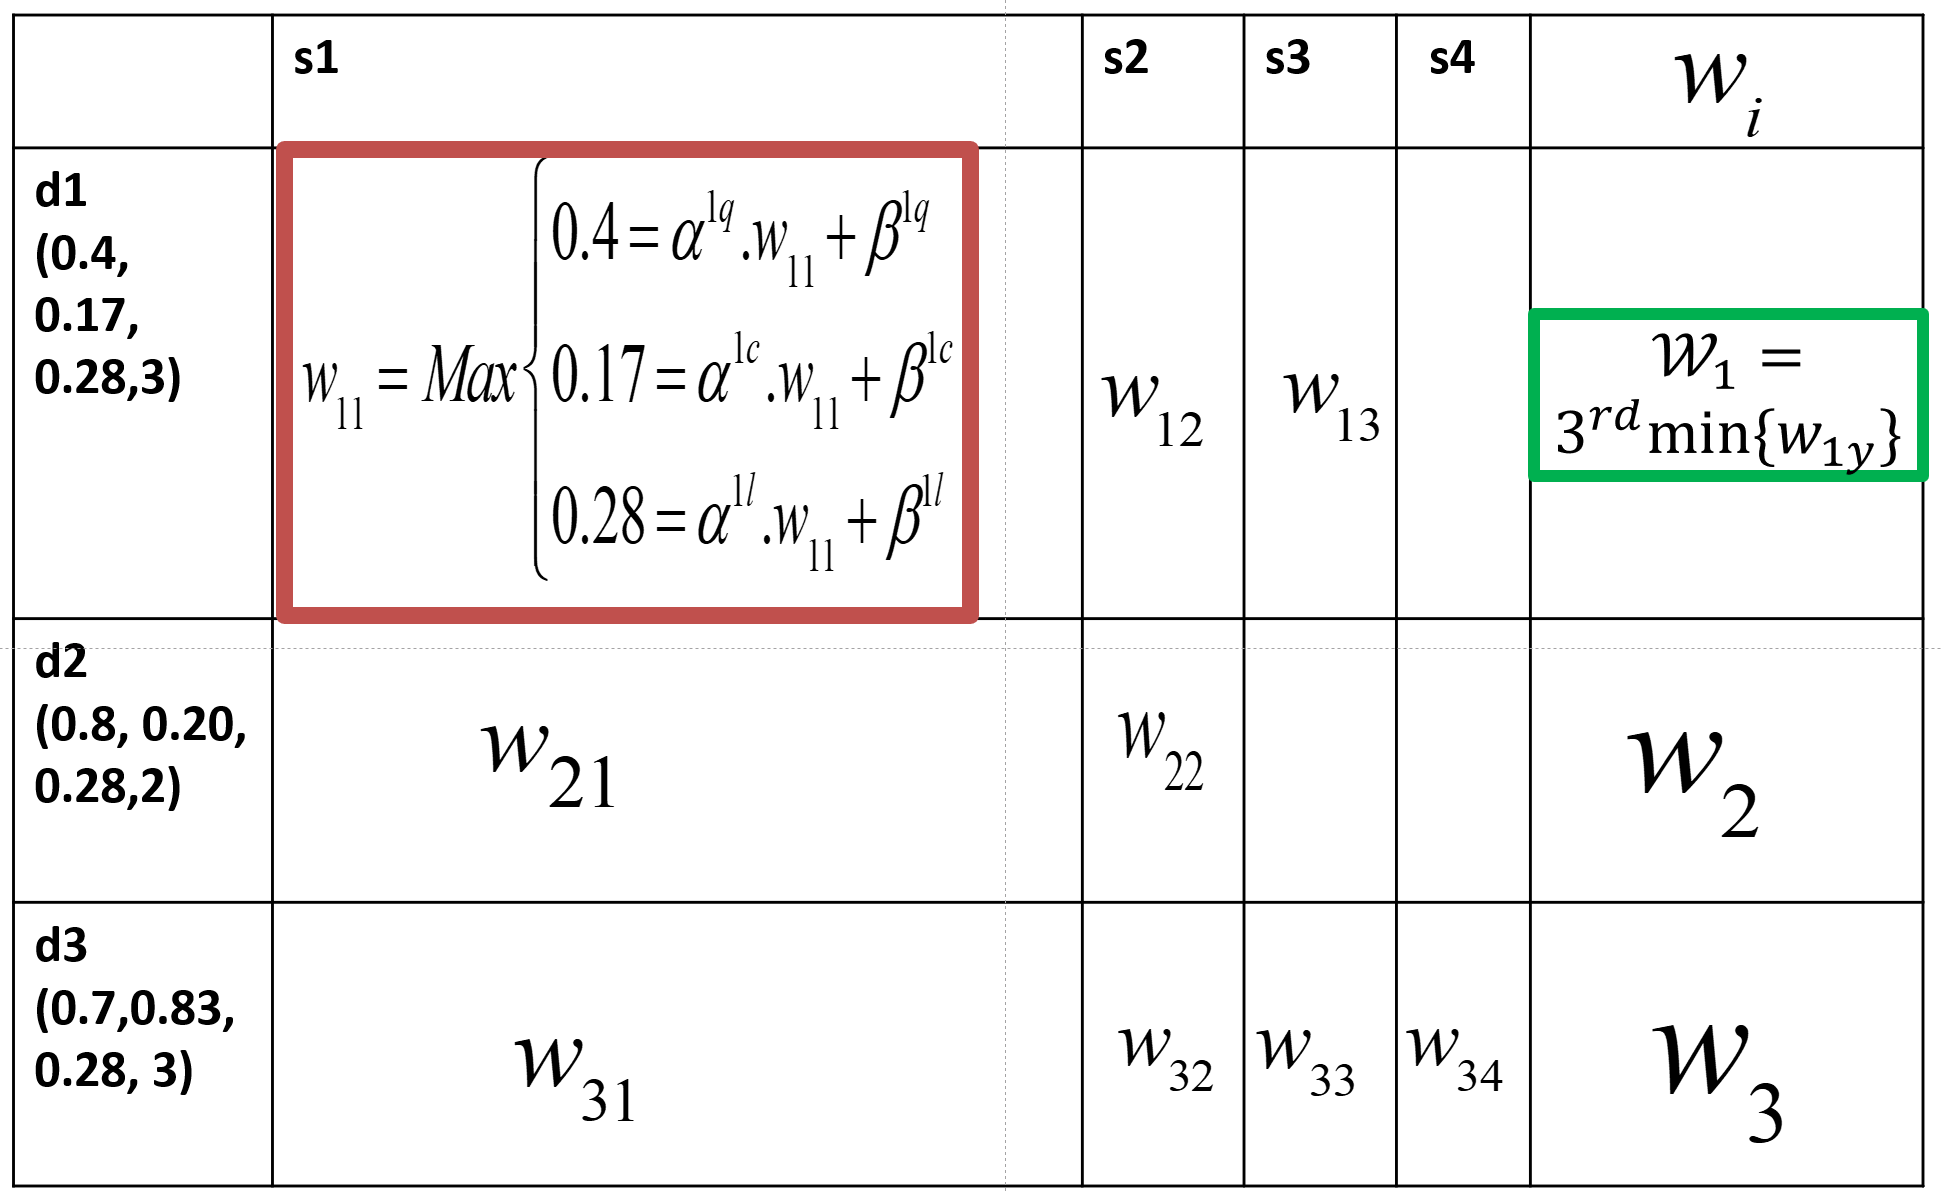
(2) Computing Workforce Requirement per Deployment: For a deployment request to be successful, BatchStrat has to find strategies, such that each satisfies the deployment parameters. In step (2), we investigate how to make compute workforce requirement for all strategies, for each . The output of this step produces a vector of length , where the -th value represents the aggregated workforce requirement for request . Computing requires understanding of two cases:
-
•
Sum-case: It is possible that the task designer intends to perform the deployment using all strategies. Therefore, the minimum workforce () needed to satisfy cardinality constraint is (where is the -th smallest workforce value in row of matrix .
-
•
Max-case: The task designer intends to only deploy one of the recommended strategies - in that case, , (where is the -th smallest workforce value in row of matrix ).
Figures 3b and 3c represent how is calculated considering sum-case and max-case, respectively.
Running Time: The running time of computing the aggregated workforce requirement of the -th deployment request is , if we use min-heaps to retrieve the smallest numbers. The overall running time is again .
3.3 Optimization-Guided Batch Deployment
Finally, we focus on the optimization step of BatchStrat, where, given , the objective is to distribute the available workforce among deployment requests such that it optimizes a platform-centric goal . Since can be limited, it may not be possible to successfully satisfy all deployment requests in a single batch. This requires distributing judiciously among competing deployment requests and satisfying the ones that maximize platform-centric optimization goals, i.e., throughput or pay-off.
At this point, a keen reader may notice that the batch deployment problem bears resemblance to a well-known discrete optimization problem that falls into the general category of assignment problems, specifically, Knapsack-type of problems Garey and Johnson (2002). The objective is to maximize a goal (in this case, throughput or pay-off), subject to the capacity constraint of worker availability . In fact, depending on the nature of the problem, the optimization-guided batch deployment problem could become intractable.
Intuitively, when the objective is only to maximize throughput (i.e., the number of satisfied deployment requests), the problem is polynomial-time solvable. However, when there is an additional dimension, such as pay-off, the problem becomes NP-hard problem, as we shall prove next.
Theorem 1.
The Pay-Off maximization problem is NP-hard.
Proof.
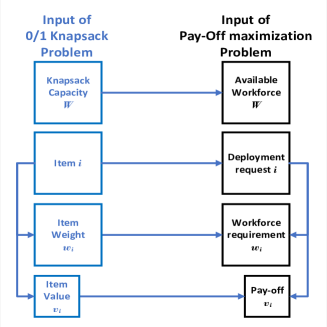
To prove NP-hardness, we reduce an instance of the known NP-hard problem Knapsack problem Garey and Johnson (2002) problem to an instance of the Pay-off Maximization problem. Given an instance of the 0/1 Knapsack problem, an instance of our problem could be created as follows: an item of weight and value represents a deployment request with minimum workforce requirement and pay-off , as the Figure 4 shown. Clearly this transformation is performed in polynomial time. After that, it is easy to notice that a solution exists for the 0/1 Knapsack problem iff the same solution solves our Pay-Off maximization problem. ∎
Our proposed solution bears similarity to the greedy approximation algorithm of the Knapsack problem Ibarra et al. (1975). The objective is to sort the deployment strategies in non-increasing order of . The algorithm greedily adds deployments based on this sorted order until it hits a deployment that can no longer be satisfied by , that is, . At that step, it chooses the better of and and the process continues until no further deployment requests could be satisfied based on . Lines in Algorithm BatchStrat describe those steps.
Running Time: The running time of this step is dominated by the sorting time of the deployment requests, which is .
3.3.1 Maximizing Throughput
When task throughput is maximized, the objective function is computed simply by counting the number of deployment requests that are satisfied by the Aggregator. Therefore, , the objective function value of deployment is the same for all the deployment requests and is . Our solution, BatchStrat-ThroughPut, sorts the deployment requests in increasing order of workforce requirement to make non-increasing. Other than that, the rest of the algorithm remains unchanged.
Theorem 2.
Algorithm BatchStrat-ThroughPut gives an exact solution to the problem.
Proof.
We proof this theorem by the method of contradiction.
Assume the solution produced by the Algorithm BatchStrat-ThroughPut has the objective function value . Assume is the optimal solution with the objective function value , such that (that is, ). Let be the first deployment request, such that, . Therefore, .
Let the -th deployment request present in and have the workforce requirement of and , respectively. Since, BatchStrat-ThroughPut iteratively selects the deployments in ascending order of workforce requirement, therefore, we can say, for all , . Therefore, to satisfy , must exceed the available workforce constraint . That is a contradiction. Therefore, and Algorithm BatchStrat-ThroughPut gives an exact solution of the throughput problem. ∎
3.3.2 Maximizing Pay-Off
Unlike throughput, when pay-off is maximized, there is an additional dimension involved that is different potentially for each deployment request. for deployment request is computed using , the amount of payment deployment is willing to expend. Other than that, the rest of the algorithm remains unchanged.
Theorem 3.
Algorithm BatchStrat-PayOff has a 1/2-approximation factor.
Proof.
Assume be the optimal Payoff value of the problem. According to the algorithm, the output of algorithm BatchStrat-PayOff is either or . Now, if we perform integer relaxation of this problem (that is, it is allowed to satisfy a deployment request partially), the optimal value of the relaxed problem becomes,
| (5) |
This is larger than , because deployments are allowed to be partially satisfied due to integer relaxation.
In addition,
| (6) |
Therefore:
| (7) |
Since,, either or . Since the output solution of algorithm BatchStrat-PayOff is the better one in either or , algorithm BatchStrat-PayOff holds the approximation factor Lawler (1979).
∎
4 ADPaR
We discuss our solution to the ADPaR problem, that takes a deployment and strategy set as inputs, and is designed to recommend alternative deployment parameters to optimize the goal stated in Equation 3 (Section 2.3), such that satisfies the cardinality constraint of .
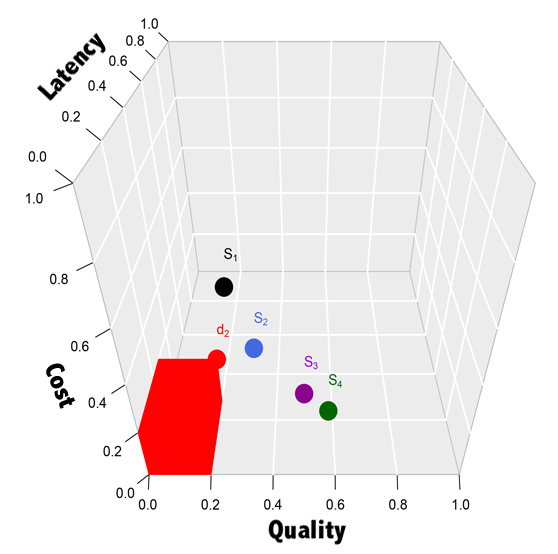
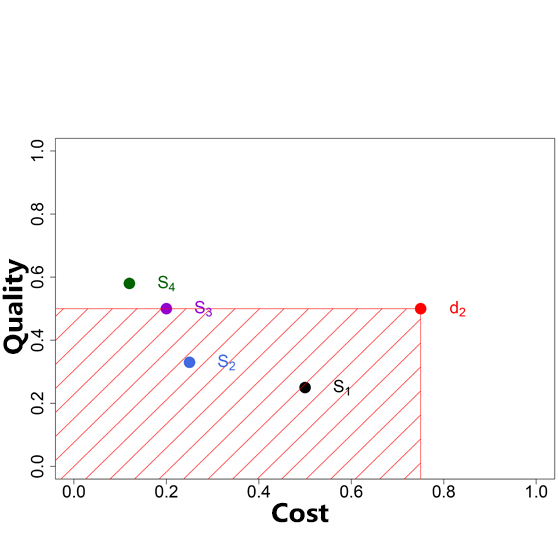
Going back to Example 2.1 with the request , StratRec there is no strategy that satisfies (refer to Figure 5a).
At a high level, ADPaR bears resemblance to Skyline and Skyband queries Chomicki et al. (2013); Jin et al. (2007); Mouratidis and Tang (2018) - but as we describe in Section 6, there are significant differences between these two problems - thus the former solutions do not adapt to solve ADPaR. Similarly, ADPaR is significantly different from existing works on query refinement Mishra et al. (2009); Mottin et al. (2013); Anagnostopoulos et al. (2010); Gauch et al. (1991), that we further delineate in Section 6.
4.1 Algorithm ADPaR-Exact
Our treatment is geometric and exploits the monotonicity of our objective function (Equation 1 in Section 2.3). Even though the original problem is defined in a continuous space, we present a discretized technique that is exact. ADPaR-Exact, employs three sweep-lines De Berg et al. (1997), one for each parameter, quality, cost, and latency and gradually relaxes the parameters to produce the tightest alternative parameters that admit strategies. By its unique design choice, ADPaR-Exact is empowered to select the parameter that is most suitable to optimize the objective function, and hence, produces exact solutions to ADPaR.
ADPaR-Exact has four main steps. Before getting into those details, we present a few simplifications to the problem for the purpose of elucidation. As we have described before, we normalize quality, cost, latency thresholds of a deployment or of a strategy in , and inverse quality to . This step is just for unification, making our treatment for all three parameters uniform inside ADPaR, where smaller is better, and the deployment thresholds are considered as upper-bounds. With this, each strategy is a point in a -dimensional space and a deployment parameter (modulo its cardinality constraint) is an axis-parallel hyper-rectangleDe Berg et al. (1997) in that space. Consider Figure 5a that shows the strategies in Example 2.1 and as a hyper-rectangle.
Step-1 of ADPaR-Exact computes the relaxation (increment) that a deployment requires to satisfy a strategy among each deployment parameter. This is akin to computing (likewise for quality and latency) and when the strategy cost is smaller than the deployment threshold, it shows no relaxation is needed - hence we transform that to . The problem is studied for quality, cost, and latency (referred to as Q, C, L) (Table 5). It also initializes , the worst possible relaxation.
Step-2 of ADPaR-Exact involves sorting the strategies based on the computed relaxation values from step-1 in an increasing order across all parameters, as well as keeping track of the index of the strategies and the parameters of the relaxation values. The sorted relaxation scores are stored in list , the corresponding data structure provides the strategy index, and provides the parameter value. In other words, represents the -th smallest relaxation value, where represents the index of the strategy and represents the parameter value corresponding to that. A cursor is initialized to the first position in (Table 5). Another data structure, a boolean matrix of size (Table 5) is used that keeps track of the number of strategies that are covered by the current movement of cursor in list . This matrix is initialized to and the entries are updated to , as advances.
Step-3 involves designing three sweep-lines along Q, C, and L (Table 5). A sweep line is an imaginary vertical line which is swept across the plane rightwards. The Q sweep-line sorts the in C L plane in increasing order of Q (the other two works in a similar fashion). ADPaR-Exact sweeps the line as it encounters strategies, in order to discretize the sweep. At the beginning, each sweep-line points the -th strategy along Q, C, L, respectively. is updated and contains the current Q, C, L value i..e, , , and . Cursor points to the smallest of these three values in R. Matrix is updated to see what parameters of which strategies are covered so far.
At step-4, ADPaR-Exact checks if the current covers strategies or not. This involves reading through and checking if there exists strategies such that for each strategy and and . If there are not such strategies, it advances to the next position and resets again.
If there are more than strategies, the new , however, does not ensure that it is the tightest one to optimize Equation 3. Therefore, ADPaR-Exact cannot halt. ADPaR-Exact needs to check if there exists another that still covers strategies better than . This can indeed happen as we are dealing with a -dimensional problem and these three values in combination determine the objective function.
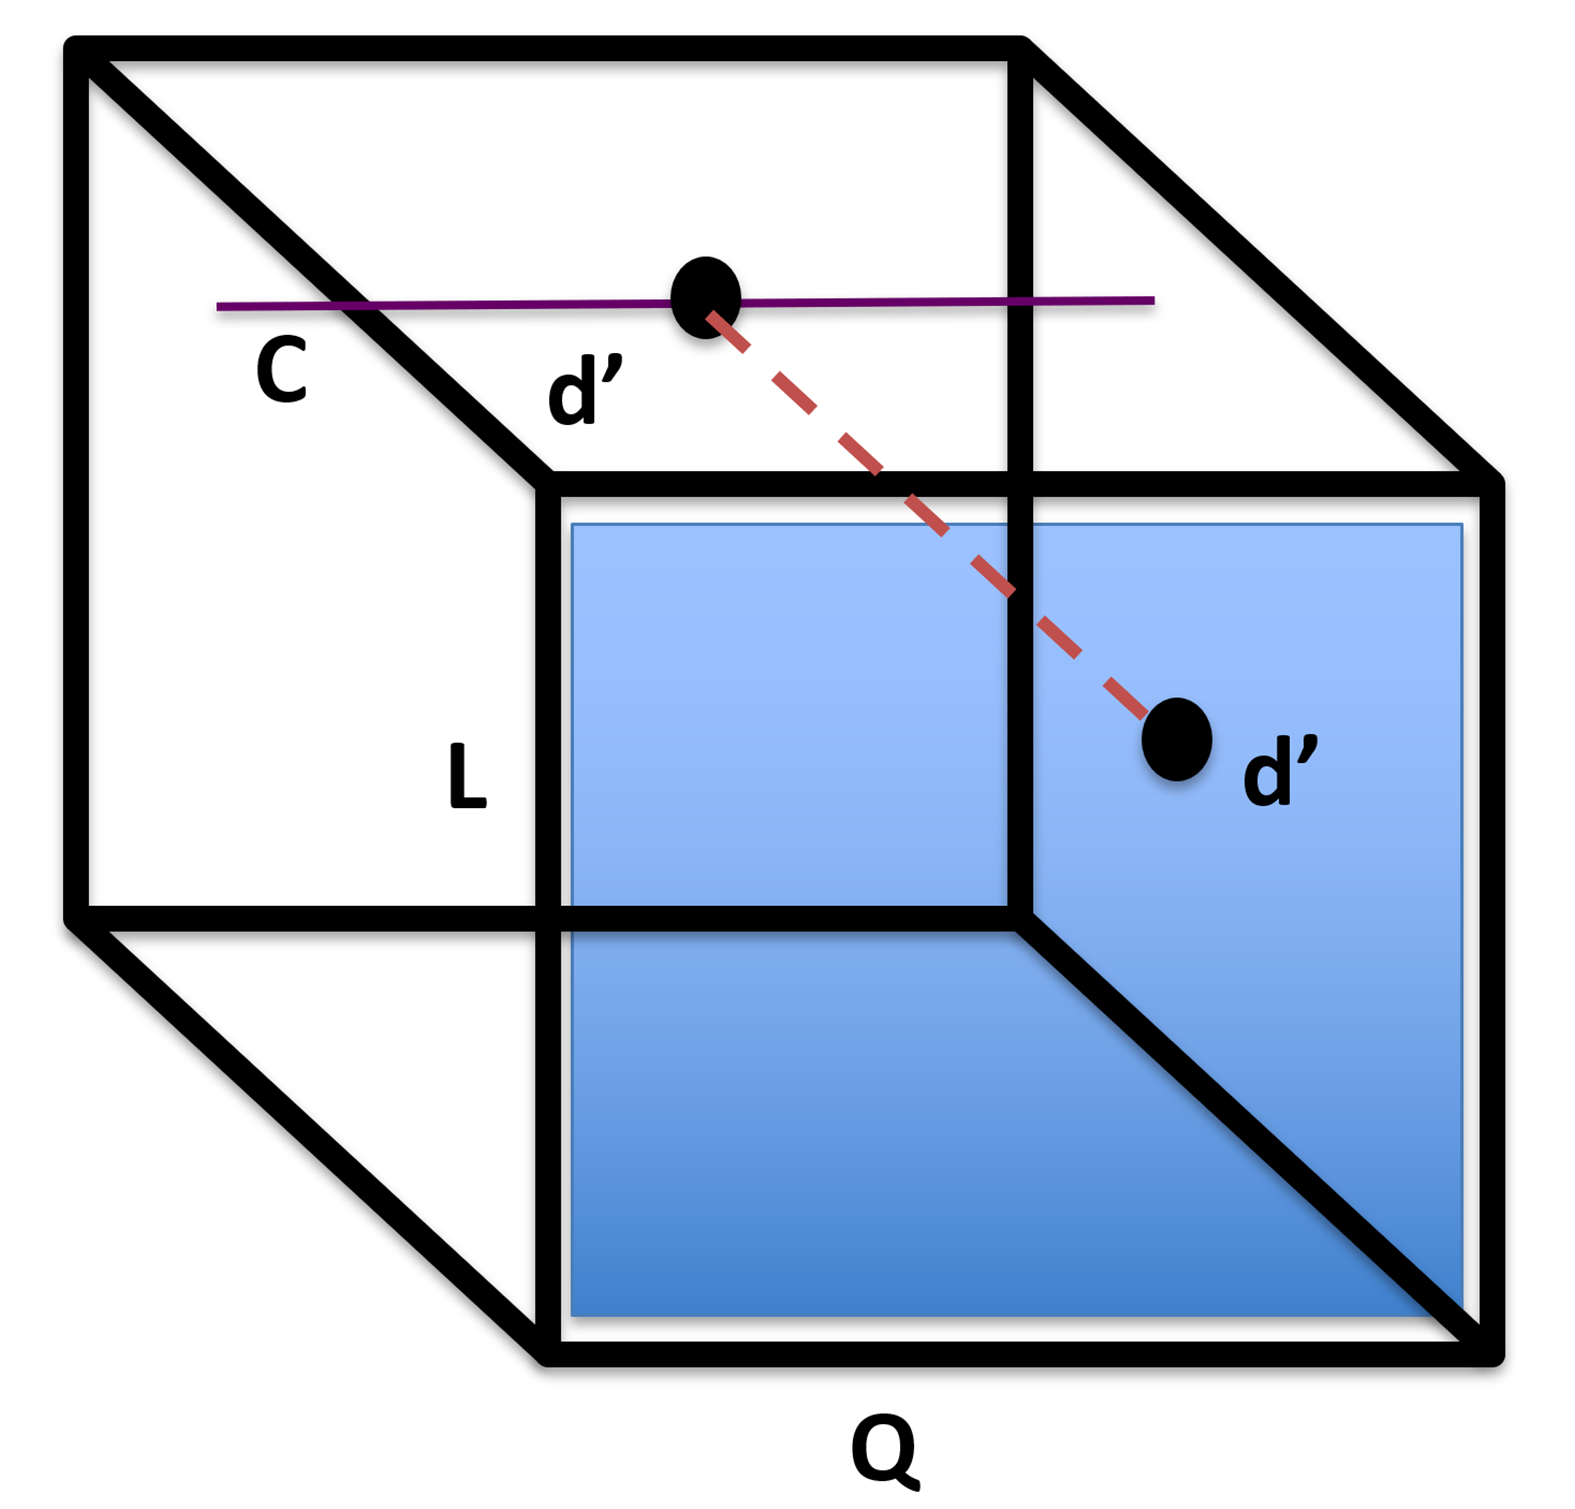
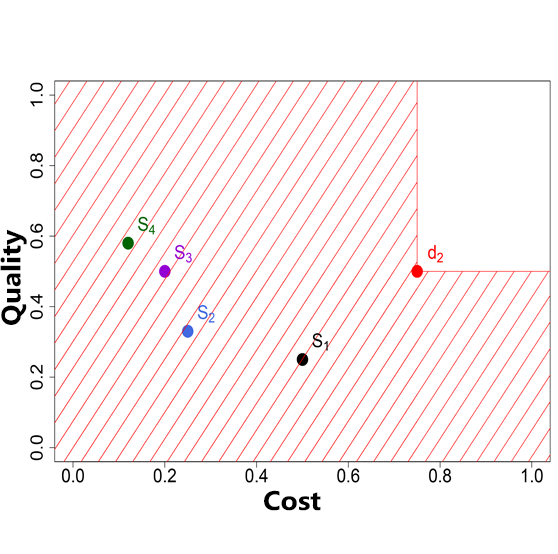
ADPaR-Exact takes turn in considering the current values of each parameter based on , and creates a projection on the corresponding -D plane, for the fixed value of the third parameter. Figure 5b shows an example in (Q, L) plane for a fixed cost. It then considers all strategies whose . After that, it finds the largest expansion among the two parameters such that this new covers strategies. This gives rise to three new deployment parameters, , , . It chooses the best of these three and updates . At this point it checks if has strategies covered. If it does, it stops processing and returns the new and the strategies. If it does not, it advances the cursor to the right.
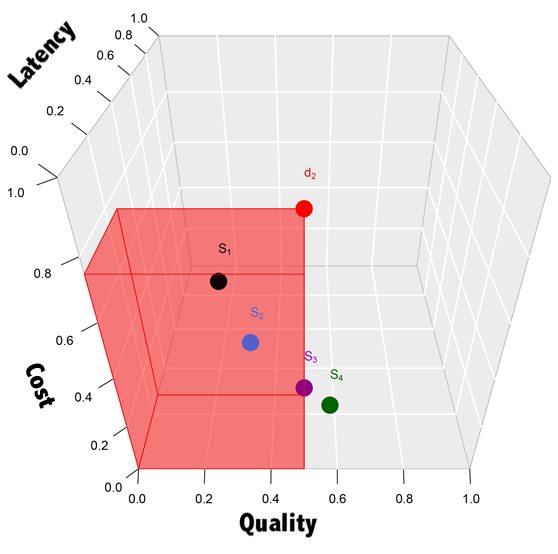
Using Example 2.1, the alternative parameters are for and are returned.
| Cost | Quality | Latency | |
|---|---|---|---|
| 0 | 0 | 1 | |
| 0 | 0 | 1 | |
| 0 | 0 | 0 | |
| 0 | 0 | 0 |
| Cost | Quality | Latency | |
|---|---|---|---|
| 0.3 | 0.05 | 0 | |
| 0.05 | 0.13 | 0 | |
| 0 | 0.3 | 0 | |
| 0 | 0.38 | 0 |
| Relaxation | 0 | 0 | 0 | 0 | 0 | 0 |
| Strategy Index | 1 | 2 | 3 | 4 | 3 | 4 |
| Parameter | L | L | L | L | C | C |
| Relaxation R | 0.05 | 0.05 | 0.13 | 0.3 | 0.3 | 0.38 |
| Strategy Index | 1 | 2 | 2 | 1 | 3 | 4 |
| Parameter | Q | C | Q | C | Q | Q |
| sweep-line(Q) | plane | 0.05 | 0.13 | 0.3 | 0.38 |
| 0.3 | 0.05 | 0 | 0 | ||
| 0 | 0 | 0 | 0 | ||
| sweep-line(C) | plane | 0 | 0 | 0.05 | 0.3 |
| 0.38 | 0.3 | 0.13 | 0.05 | ||
| 0 | 0 | 0 | 0 | ||
| sweep-line(L) | plane | 0 | 0 | 0 | 0 |
| 0.3 | 0.05 | 0 | 0 | ||
| 0.05 | 0.13 | 0.3 | 0.38 |
Lemma 1.
To cover strategies, needs to be initialized at least to the smallest values on each parameter.
Proof.
We prove this by the method of contradiction. Assume there is an alternative deployment , which has a a parameter that is smaller than the corresponding smallest value. On the other hand, to be able to satisfy as an alternative deployment parameter, must cover at least strategies on each parameter per its definition. However, to be able to cover at least strategies, each parameter of must be equal or larger than the corresponding parameters of the strategies that it covers. Hence, the contradiction.
Lemma 2.
Going by the relaxation value and parameter order of and , it ensures the tightest increase in the objective function in ADPaR-Exact.
Proof.
The proof is done by induction on the number of relaxation.
The basis (base case): we first prove that the statement is true for the very first relaxation. After the relaxation in step 1, all the values are sorted in increasing order of the parameters, as shown in Table 5. If there are strategies under consideration, each with its corresponding quality, cost, and latency parameters, then and are sorted relaxation values and corresponding parameters . Assume the scan starts at { , and }. The objective value of the initial setting is , since the objective function is .
Let be the new cursor position of , once one of the current parameter (without loss of generality, let be that one) of gets relaxed. Since (Recall Table 5) is sorted in increasing order of parameter values of the strategies, after the first relaxation, the increment in the objective function value is smaller than that of any other relaxation. Thus, the statement is true for the first relaxation.
Inductive Hypothesis: Assume the statement to be true for the first relaxations:
Inductive Step: Now we intend to prove that the statement is true for the -th relaxation. Assume, at the -th iteration, {,}. Assume is the next parameter value in . Therefore, will be scanned at the -th iteration. Since is the smallest relaxation on the corresponding parameter, therefore the increase in the objective function value from {,} to {,} is smaller than all other relaxation. Therefore, Lemma 2 is true for the -th iteration. Hence the proof.
∎
Theorem 4.
ADPaR-Exact produces an exact solution to the ADPaR problem.
Proof.
For this, we need to prove that there is no alternative deployment parameters that has a smaller objective value than that of and still covers strategies. We prove this by contradiction. Assume that is indeed the case, that is, there is an alternative deployment parameter whose objective value is smaller than that of ’s and it still covers strategies. Inside Algorithm ADPaR-Exact, when a parameter of needs to be updated, it is increased to the corresponding value of its closest strategy, based on Lemma 2, i.e., update based of and , as described in Algorithm ADPaR-Exact. Therefore, in such cases, ADPaR-Exact will decide not to relax the next parameter, and will be returned, instead of . However, that is not the case. Hence the contradiction and the proof.
In fact, by using the sweep-lines, all possible alternative deployment parameters that have smaller objective value (than that of ) are checked before is returned, just like the Figure 8 shows. All the possible alternative deployment requests in the unchecked area have a larger objective value. ∎
Running Time: Step-1 of Algorithm ADPaR-Exact takes . Step-2 and 3 are dominated by sorting time, which takes . Step-4 is the most time-consuming and takes . Therefore, the overall running time of the algorithm is cubic to the number of strategies.
5 Experimental Evaluation
In our real-world deployments, we estimate worker availability and demonstrate the need for optimization (Section 5.1). In synthetic data experiments (Section 5.2), we present results to validate the qualitative and scalability aspects of our algorithms.
5.1 Real Data Experiments
We perform two different real data experiments that involve workers from AMT focusing on text editing tasks. The first experiments (Section 5.1.1) empirically validate key assumptions in designing StratRec. the second experiments (Section 5.1.2) validate the effectiveness of StratRec when compared to the case where no recommendation is made.
5.1.1 Validating Key Assumptions
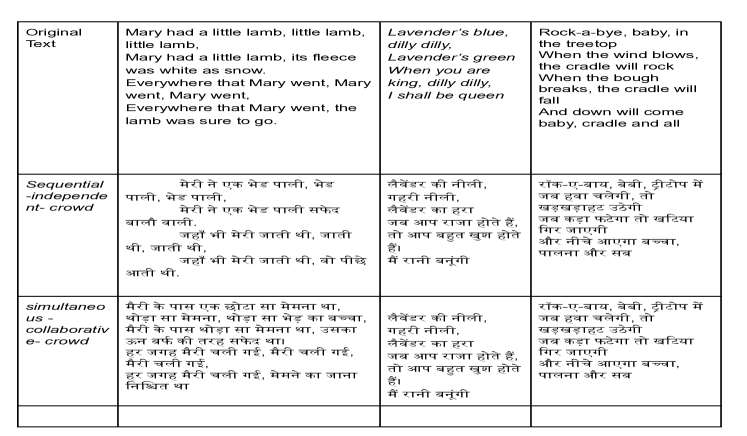
We consider two types of tasks: a) sentence translation (translating from English to Hindi) and text creation (writing 4 to 5 sentences on some topic) to validate the following questions:
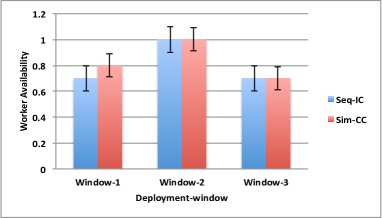
1. Can worker availability be estimated and does it vary over time? We performed different deployments for each task. The first deployment was done on the weekend (Friday 12am to Monday 12am), the second deployment was done at the beginning to the middle of the week (Monday to Thursday), the last one is from the middle of the week until the week-end (Thursday to Sunday). We design the HITs (Human Intelligence Tasks) in AMT such that each task needs to be undertaken by a maximum number of workers . Worker availability is computed as the ratio of , where is the actual number of workers who undertook the task during the deployment time (although this does not fully conform to our formal worker availability definition, it is our sincere attempt to quantify worker availability using public platforms).
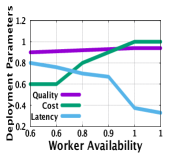
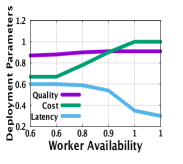
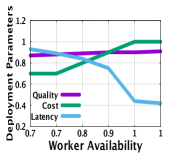
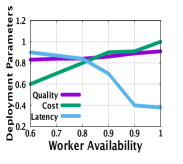
2. How does worker availability impact deployment parameters? We need to be able to calculate the quality, cost, and latency, along with worker availability. Latency and cost are easier to calculate, basically, it is the total amount of money that was paid to workers and the total amount of time the workers used to make edits in the document. Since text editing tasks are knowledge-intensive, to compute the quality of the crowd contributions, we ask a domain expert to judge the quality completed tasks as a percentage. Once worker availability, quality, cost, and latency are computed, we perform curve fitting that has the best fit to the series of data points.
3. How do deployment strategies impact different task types? We deployed both types of text editing tasks using two different deployment strategies SEQ-IND-CRO and SIM-COL-CRO that were shown to be effective with more than 70% of quality score for short texts Borromeo et al. (2017). Since our effort here was to evaluate the effectiveness of these two strategies considering quality, cost, and latency, we did not set values for deployment parameters and we simply observed them through experimentation.
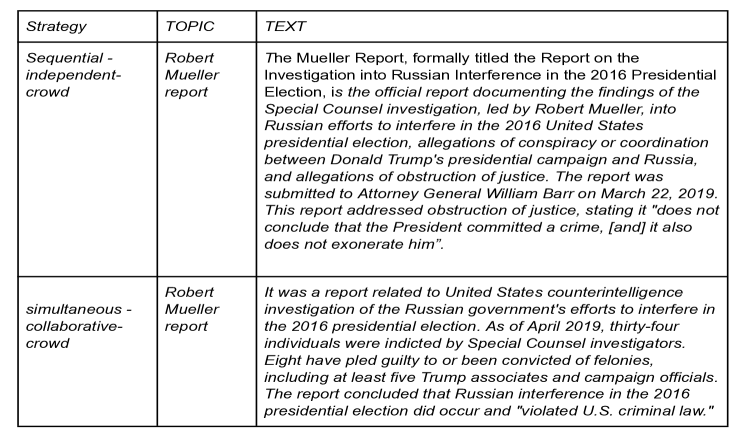
Tasks and Deployment Design: We chose three popular English nursery rhymes for sentence translation. Each rhyme consisted of 4-5 lines that were to be translated from English to Hindi (one such sample rhyme is shown in Figure 10). For text creation, we considered three popular topics, Robert Mueller Report, Notre Dame Cathedral, and 2019 Pulitzer prizes. One sample text creation is shown in Figure 10.
We designed three deployment windows at different days of the week. Unlike micro-tasks in AMT, text editing tasks require significantly more time to complete (we allocated hours per HIT). A HIT contains either 3 sentence translation tasks or three text creation tasks as opposed to micro-tasks, where a HIT may contain tens of tasks. For each task type, we validated deployment strategies - in SEQ-IND-CRO, workers were to work in sequence and independently, whereas, in SIM-COL-CRO, workers were asked to work simultaneously and collaboratively. We created different samples of the same study resulting in a total of HITs deployed inside the same window. Each HIT was asked to be completed by workers paid each if the worker spent enough time (more than minutes). This way, a total of unique workers were hired for each deployment window, and a total of workers were hired for all three deployments.
Worker Recruitment: For both task types, we recruited workers with a HIT approval rate greater than . For sentence translation, we additionally filtered workers on geographic locations, either US or India. For text creation tasks, we recruited US-based workers with a Bachelor’s degree.
Enabling collaboration: After workers were recruited from AMT, they were directed to Google Docs where the tasks were described and the workers were given instructions. The docs were set up in editing mode, so edits could be monitored.
Experiment Design: An experiment is comprised of three steps. In Step-1, all initially recruited workers went through qualification tests. For text creation, a topic (Royal Wedding) was provided and the workers were asked to write sentences related to that topic. For sentence translation, the qualification test comprised of sample sentences to be translated from English to Hindi. Completed qualification tests were evaluated by domain experts and workers with more than 80% or more qualification scores were retained and invited to work on the actual HITs. In Step-2, actual HITs were deployed for hours and the workers were allotted hours for the tasks. In Step-3, after hours of deployment, results were aggregated by domain experts to obtain a quality score. Cost and latency were easier to calculate directly from the raw data.
Summary of Results: Our first observation is that worker availability can be estimated and does vary over time (standard error bars added). We observed that for both task types, workers were more available during Window 2 (Monday-Thursday), compared to the other two windows. Detailed results are shown in Figure 11.
Our second observation is that each deployment parameter has a linear relationship with worker availability for text editing tasks. Quality and cost increases linearly with worker availability. Latency decreases with increasing worker availability. This linear relationship could be captured and the parameters could be estimated. Table 6 presents these results and the estimated always lie within confidence interval of the fitted line.
Our final observation is that SEQ-IND-CRO performs better than SIM-COL-CRO for both task types. However, this difference is not statistically significant. On the other hand, SEQ-IND-CRO has higher latency. Upon further analysis, we observe that when workers are asked to collaborate and edit simultaneously, that gives rise to an edit war and an overall poor quality. Figure 12 presents these results.
| Worker Availability and Deployment Parameters | ||
|---|---|---|
| Task-Strategy | Parameters | , |
| Translation SEQ-IND-CRO | Quality | , |
| Cost | ||
| Latency | ||
| Translation SIM-COL-CRO | Quality | |
| Cost | ||
| Latency | ||
| Creation SEQ-IND-CRO | Quality | |
| Cost | ||
| Latency | ||
| Creation SIM-COL-CRO | Quality | |
| Cost | ||
| Latency | ||
5.1.2 Validating the Effectiveness of StratRec
We are unable to ask specific user (task designer’s) satisfaction questions in this experiment, simply because AMT does not allow to recruit additional task designers and only workers could be recruited. For this purpose, we deploy additional sentence translation (translating nursery rhymes from English to Hindi) and additional text creation tasks considering a set of strategies.
We create mirror deployments for the same task (one according to StratRec recommendation and the other without) resulting in a total of HITs deployed. For the latter scenario, the deployments were not recommended any structure, organization, or style and the workers were given the liberty to complete the task the way they preferred. Each HIT was asked to be completed by workers paid each if the worker spent enough time (more than minutes). This way, a total of unique workers are hired during this experiment. The quality, cost, and latency thresholds of each deployment are set to be , , hours.
The worker recruitment, and the rest of the experiment design, and result aggregation steps are akin to those steps that are described in Section 5.1.1. Figure 13 represents the average quality, cost, and latency results of these experiments with statistical significance.
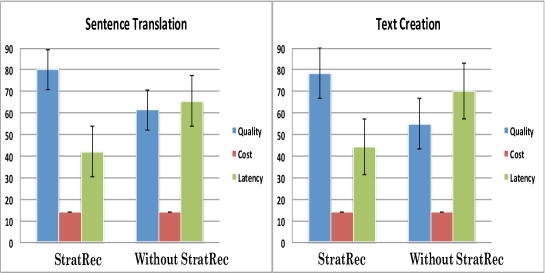
Summary of Results: We have two primary observations from these experiments. Our first observation is that (Figure 13), when tasks are deployed considering recommendation of StratRec, with statistical significance, they achieve higher quality and lower latency, under the fixed cost threshold on an average compared to the deployments that do not consult StratRec. These results validate the effectiveness of deployment recommendations of our proposed frameworks and its algorithms.
Our second observation (upon further investigating the Google Docs where the workers undertook tasks), is that the deployments that do not consider StratRec recommendations have more edits, compared to that are deployed considering StratRec. In fact, on average, StratRec deployments have an average of edits for sentence translation, compared to edits on average for those deployed with no recommendations. Indeed, when workers were not guided, they repeatedly overrode each other’s contributions, giving rise to an edit war.
5.2 Synthetic Experiments
We aim to evaluate the qualitative guarantees and the scalability. Algorithms are implemented in Python 3.6 on Ubuntu 18.10. Intel Core i9 3.6 GHz CPU, 16GB of memory.
5.2.1 Implemented Algorithms
We describe different algorithms that are implemented.
Batch Deployment Algorithms
Brute Force:
An exhaustive algorithm which compares all possible combinations of deployment requests and returns the one that optimizes the objective function.
BaselineG: This algorithm sorts the deployment requests in decreasing order of and greedily selects requests until worker availability is exhausted.
BatchStrat: Our proposed solution described in Section 3.
ADPaR Algorithms
ADPaRB: This is a brute force algorithm that examines all sets of strategies of size . It returns the one that has the smallest distance to the task designer’s original deployment parameters. While it returns the exact answer, this algorithm takes exponential time to run.
Baseline2: This baseline algorithm is inspired by a related work Mishra
et al. (2009). The main difference though, the related work modifies the original deployment request by just one parameter at a time and is not optimization driven. In contrast, ADPaR-Exact returns an alternative deployment request, where multiple parameters may have to be modified.
Baseline3: This one is designed by modifying space partitioning data structure R-Tree Beckmann
et al. (1990). We treat each strategy parameters as a point in a -D space and index them using an R-Tree. Then, it scans the tree to find if there is a minimum bounding box (MBB) that exactly contains strategies. If so, it returns the top-right corner of that MBB as the alternative deployment parameters and corresponding strategies. If such an MBB does not exist, it will return the top right corner of another MBB that has at least strategies and will randomly return strategies from there.
ADPaR-Exact: Our proposed solution in Section 4.
Summary of Results: Our simulation experiments highlight the following findings: Observation 1: Our solution BatchStrat returns exact answers for throughput optimization, and the approximation factor for pay-off maximization is always above , significantly surpassing its theoretical approximation factor of . Observation 2: Our solution BatchStrat is highly scalable and takes less than a second to handle millions of strategies, and hundreds of deployment requests, and . Observation 3: Our algorithm ADPaR-Exact returns exact solutions to the ADPaR problem, and significantly outperforms the two baseline solutions in objective function value. Observation 4: ADPaR-Exact is scalable and takes a few seconds to return alternative deployment parameters, even when the total number of strategies is large and is sizable.


5.2.2 Quality Experiment
Batch Deployment Recommendation. Goal: We validate the following two aspects: (i) how many deployment requests BatchStrat can satisfy without invoking ADPaR? (ii) How does BatchStrat fare to optimize different platform-centric goals? We compare BatchStrat with the other two baselines, as appropriate.
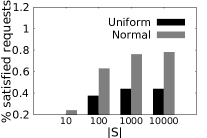
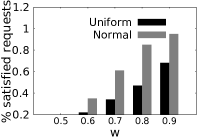
Strategy Generation: The dimension values of a strategy are generated considering uniform and normal distributions. For the normal distribution, the mean and standard deviation are set to and , respectively. We randomly pick the value from to for the uniform distribution.
Worker Availability: For a strategy, we generate uniformly from an interval . Then, we set to make sure that the estimated worker availability is within . These numbers are generated in consistence with our real data experiments.
Deployment Parameters: Once is estimated, the quality, latency, and cost - i.e., the deployment parameters, are generated in the interval . For each experiment, deployment parameters are generated, and an average of runs is presented in the results.
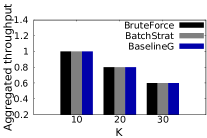
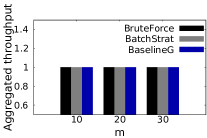
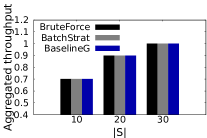
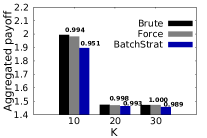
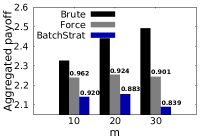
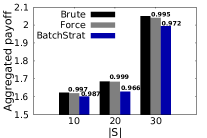
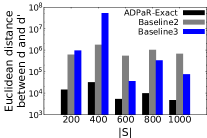
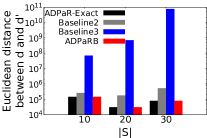
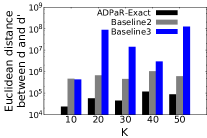
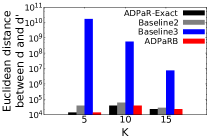
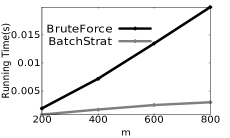


Figure 14 shows the percentage of satisfied requests by BatchStrat with varying , , , . In general, normal distribution performs better than uniform. Upon further analysis, we realize that normal distribution has a very small standard deviation, and is thereby able to satisfy more requests. As shown in Figure 14(a), the percentage of satisfied requests decreases with increasing , which is expected. Contrarily, the effect of increasing batch size is less pronounced. This is because all requests use the same underlying distribution, allowing BatchStrat to handle more of them. With more strategies , as Figure 14(c) illustrates, BatchStrat satisfies more requests, which is natural, because with increasing , it simply has more choices. Finally, in Figure 14(d), with higher worker availability BatchStrat satisfies more requests. By default, we set .
Figure 15 shows the results of throughput of BatchStrat by varying , ,, compare with the two baselines. Figure 16 shows the approximation factor of BatchStrat and BaselineG. BatchStrat achieves an approximation factor of most of the time. For both experiments, the default values are because brute force does not scale beyond that.
Alternative Deployment Recommendation ADPaR. The goal here is to measure the objective function. Since ADPaRB takes exponential time, to be able to compare with this, we set , for all the quality experiments that has to compare with the brute force. Otherwise, the default values are , .
In Figure 17, we vary and and plot the Euclidean distance between and (smaller is better). Indeed, ADPaR-Exact returns exact solution always. The other two baselines perform significantly worse, while Baseline 3 is the worst. That is indeed expected, because these two baselines are not optimization guided, and does not satisfy our goal. Naturally, the objective function decreases with increasing , because more strategies mean smaller change in , making the distance between and smaller. As the results depict, optimal Euclidean distance between and increases with increasing , which is also intuitive, because, with higher value, the alternative deployment parameters are likely to have more distance from the original ones.
5.2.3 Scalability Experiments
Our goal is to evaluate the running time of our proposed solutions. Running time is measured in seconds. We present a subset of results that are representative.
Batch Deployment Recommendation
Since the BaselineG has the same running time as that of BatchStrat (although qualitatively inferior), we only compare the running time between Brute Force and BatchStrat. The default setting for , and are , and , respectively.
The first observation we make is, clearly BatchStrat can handle millions of strategies, several hundreds of batches, and very large and still takes only a few fractions of seconds to run. It is easy to notice that the running time of this problem only relies on the size of the batch (or the number of deployment requests), and not on or . As we can see in Figure 18a, Brute Force takes exponential time with increasing , whereas BatchStrat scales linearly.
Alternative Deployment Recommendation
6 Related Work
Crowdsourcing Deployment: Till date, the burden is entirely on the task requester to design appropriate deployment strategies that are consistent with the cost, latency, and quality parameters of task deployment. A very few related works Zheng et al. (2011); Allen et al. (2018) have started to study the importance of appropriate deployment strategies but these works do not propose an algorithmic solution and are limited to empirical studies. A recent work Huang and Bigham (2017) presents the results of a 10-month deployment of a crowd-powered system that uses a hybrid approach to fast recruitment of workers, called Ignition. These results suggest a number of opportunities to deploy work in the online job market.
Crowdsourcing Applications: A number of interactive crowd-powered systems have been developed to solve difficult problems and develop applications Lin et al. (2012); Kulkarni et al. (2012, 2011); Bernstein et al. (2010); Kittur et al. (2011); Good and Su (2013); Stol and Fitzgerald (2014); Chilton et al. (2013); Mozafari et al. (2014). For instance, Soylent uses the crowd to edit and proofread text Bernstein et al. (2010); Chorus recruits a group of workers to hold sophisticated conversations Lasecki et al. (2013); and Legion allows a crowd to interact with an UI-control task Lasecki et al. (2014). A primary challenge for such interactive systems is to decrease latency without having to compromise with the quality. A comprehensive survey on different crowdsourcing applications could be found at Yuen et al. (2011). All crowd-powered systems share these challenges and are likely to benefit from StratRec.
Query planning and Refinement: The closest analogy of deployment strategy recommendation is recommending the best query plan in relational databases, in which joins, selections and projections could be combined any number of times. Typical parametric query optimization problems, like Ioannidis et al. (1992), only focus on one objective to optimize. Afterwards, multi-objective problems have been studied, with a focus on optimizing multiple objectives at the same time Trummer and Koch (2016). Our work borrows inspiration from that and studies the problem in the deployment context, making the challenges unique and different from traditional query planning.
Query reformulation has been widely studied in Information Retrieval Gauch et al. (1991). In Mishra et al. (2009), authors take users’ preference into account and propose an interactive method for seeking an alternative query which satisfies cardinality constraints. This is different from ADPaR since it only relaxes one dimension at a time. Aris et al. Anagnostopoulos et al. (2010) proposed a graph modification method to recommend queries that maximize an overall utility. Mottin et al. Mottin et al. (2013) develop an optimization framework where solutions can only handle Boolean/categorical data.
Skyline and Skyband Queries: Skyline queries play an essential role in computing favored answers from a database Borzsony et al. (2001); Chomicki et al. (2013). Based on the concepts of skylines, other classes of queries arise, especially top- queries and -skyband problems which aim to bring more useful information than original skylines. Mouratidis et al. Mouratidis et al. (2006); Mouratidis and Tang (2018) study several related problems. In Mouratidis et al. (2006), sliding windows are used to track the records in dynamic stream rates. In Mouratidis and Tang (2018), a geometry arrangement method is proposed for top- queries with uncertain scoring functions. Because our problem seeks the optimal group of strategies, it is similar to the top- queries problem. However, unlike Skyband or any other related work, ADPaR recommends alternative deployment parameters. Thus, these solutions do not extend to solve ADPaR.
7 Conclusion
We propose an optimization-driven middle layer to recommend deployment strategies. Our work addresses multi-faceted modeling challenges through the generic design of modules in StratRec that could be instantiated to optimize different types of goals by accounting for worker availability. We develop computationally-efficient algorithms and validate our work with extensive real data and synthetic experiments.
This work opens up several important ongoing and future research directions. As an ongoing investigation, we are deploying additional types of tasks using StratRec to evaluate its effectiveness. Our future investigation involves adapting batch deployment to optimize additional criteria, such as worker-centric goals, or to combine multiple goals inside the same optimization function. Understanding the computational challenges of such an interactive system remains to be explored. Finally, how to design StratRec for a fully dynamic stream-like setting of incoming deployment requests, where the deployment requests could be revoked, remains to be an important open problem.
References
- (1)
- Allen et al. (2018) BJ Allen et al. 2018. Design Crowdsourcing: The Impact on New Product Performance of Sourcing Design Solutions from the Crowd. Journal of Marketing (2018).
- Anagnostopoulos et al. (2010) Aris Anagnostopoulos et al. 2010. An optimization framework for query recommendation. (2010).
- Beckmann et al. (1990) Norbert Beckmann et al. 1990. The R*-tree: an efficient and robust access method for points and rectangles. In SIGMOD. Acm.
- Bernstein et al. (2010) Michael S. Bernstein, Greg Little, Robert C. Miller, Björn Hartmann, Mark S. Ackerman, David R. Karger, David Crowell, and Katrina Panovich. 2010. Soylent: A Word Processor with a Crowd Inside. In IN PROC UIST’10.
- Borromeo et al. (2017) Ria Mae Borromeo et al. 2017. Deployment strategies for crowdsourcing text creation. Information Systems (2017).
- Borzsony et al. (2001) Stephan Borzsony et al. 2001. The skyline operator. In ICDE. IEEE.
- Chilton et al. (2013) Lydia B Chilton, Greg Little, Darren Edge, Daniel S Weld, and James A Landay. 2013. Cascade: Crowdsourcing taxonomy creation. In Proceedings of the SIGCHI Conference on Human Factors in Computing Systems. ACM, 1999–2008.
- Chomicki et al. (2013) Jan Chomicki et al. 2013. Skyline queries, front and back. SIGMOD (2013).
- De Berg et al. (1997) Mark De Berg et al. 1997. Computational geometry. In Computational geometry. Springer.
- Garey and Johnson (2002) Michael R Garey and David S Johnson. 2002. Computers and intractability. wh freeman New York.
- Gauch et al. (1991) Susan Gauch et al. 1991. Search improvement via automatic query reformulation. Technical Report. UNC Chapel Hill, Computer Science.
- Good and Su (2013) Benjamin M Good and Andrew I Su. 2013. Crowdsourcing for bioinformatics. Bioinformatics 29, 16 (2013), 1925–1933.
- Huang and Bigham (2017) Ting-Hao Kenneth Huang and Jeffrey P Bigham. 2017. A 10-month-long deployment study of on-demand recruiting for low-latency crowdsourcing. In Fifth AAAI Conference on Human Computation and Crowdsourcing.
- Ibarra et al. (1975) Oscar H Ibarra et al. 1975. Fast approximation algorithms for the knapsack and sum of subset problems. Journal of the ACM (JACM) (1975).
- Ioannidis et al. (1992) Yannis E Ioannidis, Raymond T Ng, Kyuseok Shim, and Timos K Sellis. 1992. Parametric query optimization. In VLDB, Vol. 92. Citeseer, 103–114.
- Jin et al. (2007) Wen Jin et al. 2007. The multi-relational skyline operator. In ICDE. IEEE.
- Kadi ([n.d.]) Ouiame Ait El Kadi. [n.d.]. Exploring Crowdsourcing Deployment Strategies through Recommendation and Iterative Refinement. MS Research Report ([n. d.]).
- Kittur et al. (2011) Aniket Kittur, Boris Smus, Susheel Khamkar, and Robert E Kraut. 2011. Crowdforge: Crowdsourcing complex work. In Proceedings of the 24th annual ACM symposium on User interface software and technology. ACM, 43–52.
- Kulkarni et al. (2012) Anand Kulkarni, Matthew Can, and Björn Hartmann. 2012. Collaboratively crowdsourcing workflows with turkomatic. In Proceedings of the acm 2012 conference on computer supported cooperative work. ACM, 1003–1012.
- Kulkarni et al. (2011) Anand P Kulkarni, Matthew Can, and Bjoern Hartmann. 2011. Turkomatic: automatic recursive task and workflow design for mechanical turk. In CHI’11 Extended Abstracts on Human Factors in Computing Systems. ACM, 2053–2058.
- Lasecki et al. (2014) Walter S Lasecki, Raja Kushalnagar, and Jeffrey P Bigham. 2014. Legion scribe: real-time captioning by non-experts. In Proceedings of the 16th international ACM SIGACCESS conference on Computers & accessibility. ACM, 303–304.
- Lasecki et al. (2013) Walter S Lasecki, Rachel Wesley, Jeffrey Nichols, Anand Kulkarni, James F Allen, and Jeffrey P Bigham. 2013. Chorus: a crowd-powered conversational assistant. In Proceedings of the 26th annual ACM symposium on User interface software and technology. ACM, 151–162.
- Lawler (1979) Eugene L Lawler. 1979. Fast approximation algorithms for knapsack problems. Mathematics of Operations Research (1979).
- Lin et al. (2012) Christopher H Lin, Mausam Daniel, and S Weld. 2012. Dynamically switching between synergistic workflows for crowdsourcing. In In Proceedings of the 26th AAAI Conference on Artificial Intelligence, AAAI’12. Citeseer.
- Mishra et al. (2009) Chaitanya Mishra et al. 2009. Interactive query refinement. In EDBT. ACM.
- Mottin et al. (2013) Davide Mottin et al. 2013. A probabilistic optimization framework for the empty-answer problem. VLDB (2013).
- Mouratidis et al. (2006) Kyriakos Mouratidis et al. 2006. Continuous monitoring of top-k queries over sliding windows. In SIGMOD. ACM.
- Mouratidis and Tang (2018) Kyriakos Mouratidis and Bo Tang. 2018. Exact Processing of Uncertain Top-k Queries in Multi-criteria Settings. PVLDB (2018).
- Mozafari et al. (2014) Barzan Mozafari, Purna Sarkar, Michael Franklin, Michael Jordan, and Samuel Madden. 2014. Scaling up crowd-sourcing to very large datasets: a case for active learning. Proceedings of the VLDB Endowment 8, 2 (2014), 125–136.
- Pilourdault et al. (2017) Julien Pilourdault et al. 2017. Motivation-aware task assignment in crowdsourcing. In EDBT.
- Rahman et al. (2018) Habibur Rahman et al. 2018. Optimized group formation for solving collaborative tasks. The VLDB Journal (2018), 1–23.
- Stol and Fitzgerald (2014) Klaas-Jan Stol and Brian Fitzgerald. 2014. Two’s company, three’s a crowd: a case study of crowdsourcing software development. In Proceedings of the 36th International Conference on Software Engineering. ACM, 187–198.
- Trummer and Koch (2016) Immanuel Trummer and Christoph Koch. 2016. Multi-objective parametric query optimization. ACM SIGMOD Record 45, 1 (2016), 24–31.
- Yuen et al. (2011) Man-Ching Yuen, Irwin King, and Kwong-Sak Leung. 2011. A survey of crowdsourcing systems. In 2011 IEEE Third International Conference on Privacy, Security, Risk and Trust and 2011 IEEE Third International Conference on Social Computing. IEEE, 766–773.
- Zheng et al. (2011) Haichao Zheng et al. 2011. Task design, motivation, and participation in crowdsourcing contests. International Journal of Electronic Commerce (2011).