H Images of Ultra-Flat Edge-On Spiral Galaxies
Abstract
We present the H images of ultra-flat (UF) spiral galaxies seen practically edge-on. The galaxies have the angular diameter in the band and the apparent axial ratio . We found that their H images look, on average, almost two times thinner than those in the red continuum. The star-formation rate in the studied objects, determined from the H flux, is in good agreement with that calculated from the flux from the GALEX survey if we use the modified Verheijen and Sancisi formula taking into account the internal extinction in the UF galaxies. The logarithm of the specific star-formation rate in the UF galaxies shows a small scatter, , with a smooth decrease from for dwarf spirals to for massive ones. The relative amount of the hydrogen mass in UF disks varies from about 50% in dwarf disks to about 8% in massive ones. Structural distortions are less common in the UF galaxies (about 16%) than those in thick (less isolated) disks of edge-on spiral galaxies. On the cosmic time scale, 13.7 Gyr, large spiral disks are more efficient ‘‘engines’’ for gas processing into stars than dwarf spirals.
1 INTRODUCTION
The revised catalog of flat galaxies RFGC contains 4236 objects distributed over the whole sky (Karachentsev et al. 1999). For the RFGC catalog, we selected the galaxies with the angular diameter in the band and the apparent axial ratio measured in the First Palomar Sky Survey (POSS-1) and in the ESO/SERC survey. The RFGC catalog includes spiral galaxies of various morphological types: from S0, Sa to Sd, Sm. The sample containing 817 ultra-flat galaxies was compiled from this array (UFgg) (Karachentseva et al. 2016) with the ‘‘blue’’ and ‘‘red’’ axial ratios: and . A substantial proportion in the UF sample is made up of spiral galaxies of the Sc, Scd, and Sd types, in which the spheroidal stellar subsystem makes insignificant contribution to the total mass/luminosity of a galaxy. Such disk-shaped galaxies with negligibly small bulges are attractive objects for various studies of their kinematics, dynamics, and star formation due to the simple structure of these galaxies.
According to the data from Karachentsev et al. (2016), Melnyk et al. (2017), the UF galaxies are located in regions of low density avoiding close proximity to other galaxies. Obviously, the absence of close neighbors is an important condition for a thin stellar disk to persist. The presence of very few small satellites in the UF galaxies makes it possible to estimate the total mass from measurements of the difference in radial velocities and projected separations of the satellites. In spite of some expectations of Banerjee and Jog (2013), dark halos of the UF galaxies did not show any excess of dark matter compared to other spiral galaxies (Karachentsev et al. 2016).
Obtaining images of ultra-flat galaxies in the H emission line is of great interest, since it allows one to distinguish H II regions with young stellar populations. Unfortunately, the data on the H images of thin disks of edge-on galaxies are extremely rare in the literature. However, the first H image of the UF galaxy RFGC 2246 UGC 7321 has already shown (Karachentsev et al. 2015) that the subsystem of the young population of the galaxy has the axial ratio which is much greater than that of the old disk population, . The relationship between disk flatness and its population age could be traced from images of the UF galaxies in the and ultraviolet bands, although, the low angular resolution of the GALEX survey (Gil de Paz et al. 2007) impedes the success of this approach.
To observe in the H line, we selected the largest UF galaxies with the ‘‘blue’’ angular diameter located in the region of declinations of DEC .
2 OBSERVATIONS AND DATA REDUCTION
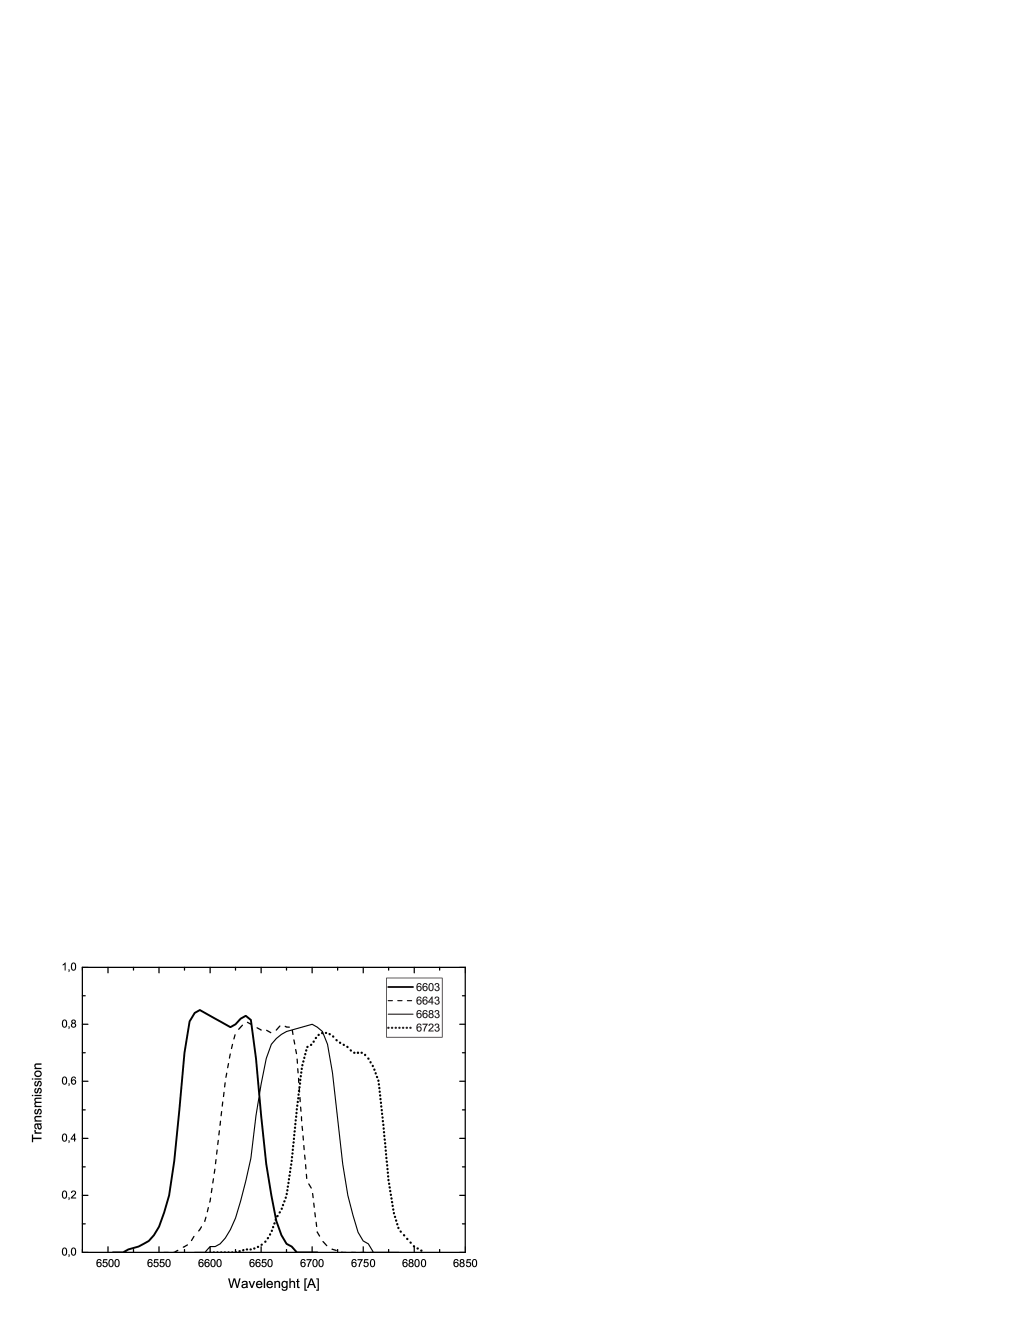
Observations of the UF galaxies in the H emission line were carried out at the 2.12-m f/7.5 Cassegrain telescope of the San Pedro Mártir National Astronomical Observatory in Mexico for several sets since February 2016 till September 2017. The telescope was equipped with the 2K2K CCD camera having a pixel size of 13.513.5 m. With a binning of 22, the camera provided a field of view of 6′6′ and a resolution of 0.352 arcsec/pixel. The observations were carried out with a set of narrow interference filters with equivalent widths of 80 Å centered at different wavelengths: 6603, 6643, 6683, and 6723 Å according to the radial velocity of the galaxy. Figure 1 shows the curves of the spectral transmission of filters.
To subtract the continuum, the images of galaxies were taken in the r-Gunn broadband filter. The image calibration was carried out every night using spectrophotometric standards.
The reduction of the observed data was carried out using the set of standard procedures which included: bias subtraction, flat-field division, cosmic-ray removal, and sky-background subtraction. The images in the continuum were normalized to the image in the H filter using several dozen stars and then were subtracted. The H flux of the galaxy was determined from the H image with the subtracted continuum. The typical measurement error of the H flux was determined, as a rule, by weather conditions and it was equal to about dex. With this accuracy, we ignored the contribution of the [N II] doublet to the emission flux neighboring H.
3 RESULTS
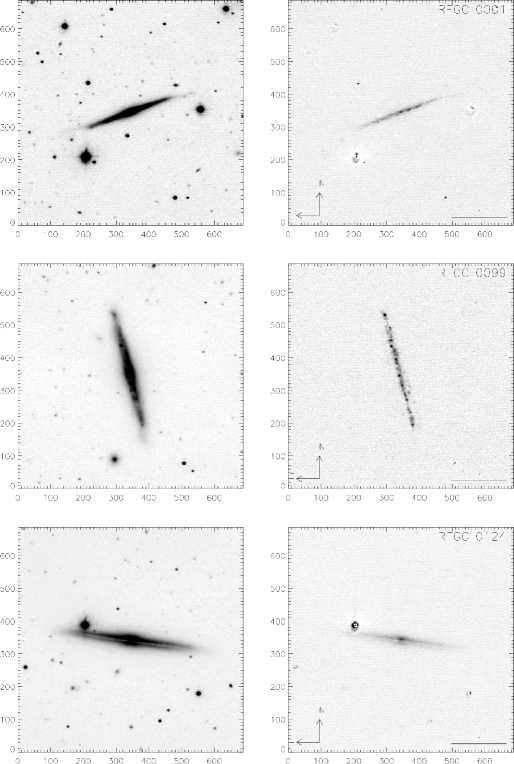
Figure 2 gives the first page of the mosaic comprising 45 pairs of the UF-galaxy images that we obtained. The left-hand images in each pair correspond to the total exposure in the H line and in the continuum, and the right-hand ones show the image difference in H and in the continuum. The name of each object, the scale of the image, and the ‘‘north–east’’ orientation are indicated in the right-hand images. Some images show residual traces from bright stars and objects of an anomalous color.
Table 1 summarises the main parameters of the observed UF galaxies. The table columns contain: (1) the number of the galaxy in the RFGC catalog; (2) the equatorial coordinates; (3,4) the ‘‘blue’’ angular diameter in arcmin and apparent ‘‘blue’’ axial ratio from RFGC; (5) the heliocentric radial velocity of the galaxy in km s-1; (6) the effective wavelength of the filter (Å) in which the galaxy was exposed; (7) the exposure time in the H filter in sec; (8) the flux logarithm in the H [N II] lines in erg cm-2 s-1.
Besides the H line, the [N II] nitrogen lines fall into the filters we used: 6548 Å and 6584 Å. According to Kennicutt et al. (2008), the relation of the intensities of the [N II] and H lines for spiral galaxies depends on the absolute magnitude of the galaxy and is expressed by the relation
| (1) |
with and , when , having a standard deviation of dex. For a typical galaxy of our sample with , the correction to the flux due to the contribution of the [N II] doublet is dex, which is smaller than the standard deviation in relation (1). That is why, we did not correct the measured flux for the contribution of the nitrogen doublet.
We used the measured integrated flux of the galaxy corrected for Galactic and internal extinction to determine the star-formation integral rate, ), in units /yr. According to Kennicutt et al. (1998),
| (2) |
where the distance is given in Mpc.
Most galaxies in our sample have the estimated apparent magnitudes in the band of the far ultraviolet ( Å, FWHM Å) measured at the GALEX111http://galex.stsci.edu/GalexView/ satellite. Following Lee et al. (2011), we determined the integral star-formation rate of the galaxy as
| (3) |
where the apparent magnitude is corrected for the Galactic and internal extinction. Comparison between ) and makes it possible to refine the value of internal extinction in galaxies, which appears to be significant in the case of edge-on galaxies.
Table 2 presents the extended summary of the main parameters of the UF galaxies. Besides those 45 galaxies that we observed, we also included the data on 10 UF galaxies with the flux measurements conducted in Karachentsev et al. (2015), Gavazzi et al. (2015), Spector and Brosch (2017) at the end of the table. The columns of Table 2 contain: (1) the RFGC galaxy number; (2) the morphological type according to the de Vaucouleurs classification: 4—Sbc, 5—Sc, 6—Scd, 7—Sd that we determined from the galaxy images in the PanSTARRS survey (Chambers et al. 2016); (3) the logarithm of the apparent axial ratio reduced to the standard isophote from HyperLEDA (Makarov et al. 2014); (4, 5) the apparent magnitude and the Galactic extinction in the band from Makarov et al. (2014), Schlegel et al. (1998); (6) the distance to the galaxy (Mpc) determined from the radial velocity relative to the Local Group centroid with the Hubble parameter km s-1 Mpc-1; for closer galaxies with km s-1, the estimation of is made using the Shaya et al. (2017) model which takes into account the infall of galaxies to the Virgo cluster and expansion of the Local cosmic void; (7) the amplitude of the galaxy rotation (in km s-1) from Makarov et al. (2014); (8) the apparent magnitude from Makarov et al. (2014) characterizing the flux from the galaxy in the 21-cm line of neutral hydrogen; (9) the flux logarithm in the H line; (10) the apparent magnitude of the galaxy in the band from the GALEX data; (11) the logarithm of the hydrogen mass of the galaxy
| (4) |
expressed in units ; (12) the magnitude of the accepted internal extinction in the galaxy in the band (see Section 4); (13) the apparent magnitude of the galaxy in the band determined from the integral value and from the morphological type as
| (5) |
corrected for the Galactic and internal extinction; such a recipe suggested in Jarrett et al. (2003) eliminates systematic underestimation of the flux from peripheral regions under photometry of blue edge-on galaxies in the 2MASS survey (Jarrett et al. 2000); (14) the integral luminosity of the galaxy in the band (in ) which with (Bell et al. 2003) corresponds to the stellar mass of the galaxy; (15,16) the integral star-formation rate determined from the H and fluxes, respectively; (17) the specific star-formation rate in units (yr-1) under the assumption that in solar units.
4 ACCOUNTING FOR THE INTERNAL EXTINCTION IN THE UF GALAXIES
The example of our Galaxy shows that dust, H II regions, and blue stars are distributed in a spiral disk extremely unevenly. The picture of the shredded distribution of dust is far from a simple model of flat-parallel layers. For this reason, a reliable scheme for accounting for internal extinction has not yet been proposed. Usually, the extinction in the band is expressed as
| (6) |
where the coefficient depends on the luminosity or morphological type of the galaxy. The HyperLEDA accounting scheme for the internal extinction implies a dependence of on a morphological type. Its imperfection is the monotonic increase of with the increase of which leads to strong overestimation of the extinction in late-type dwarf galaxies.
Other authors (Bothwell et al. 2009, Devour and Bell 2016, Lee et al. 2009) used the schemes, where the parameter depended on the absolute magnitude of the galaxy, and the character of this dependence was significantly different for different authors. Obviously, the absolute magnitude of the galaxy itself depends on the accepted internal extinction, so, the estimation scheme for edge-on galaxies requires a series of sequential iterations.
Verheijen and Sancisi (2001) proposed to express the parameter via the amplitude of the galaxy rotation:
| (7) |
with km s-1, otherwise , when km s-1. This approach is free from iterations, however, it is applicable only to galaxies with a known rotation amplitude. Considering the statistics of the relation for the Local Volume galaxies, Karachentsev et al. (2018) concluded that expression (6) somewhat overestimates the extinction in massive galaxies and underestimates it for dwarf galaxies. In our estimation, the appropriate correction for the internal extinction in late-type spiral disks has the form
| (8) |
with km s-1, otherwise , when km s-1, where is the apparent axial ratio reduced to the standard isophote (Makarov et al. 2014). Table 2 presents calculated according to this recipe. For two galaxies with unknown , we estimated the extinction with the empirical relation:
| (9) |
which describes extinction in late-type galaxies more adequately than the schemes from Bothwell et al. (2009), Devour and Bell (2016), Lee et al. (2009), or the algorithm used in HyperLEDA. Following Lee et al. (2009), we accepted the transition coefficients for the Galactic extinction in the and bands:
| (10) |
For the internal extinction, according to Lee et al. (2009), these relations were accepted:
| (11) |
Here, a higher value of the transition coefficient for the H line compared to relation (10) is due to the close correlation between the distribution of dust and H II regions in the galaxy disks, and its value was estimated from spectrophotometric measurements of the Balmer decrement (see the details in Lee et al. 2009).
Determining the hydrogen mass of galaxies , we ignored the correction for the internal self-extinction of the emission in the 21-cm line. For the edge-on galaxies, HyperLEDA introduces a correction to for the self-extinction effect, equal to . However, such a correction seems overstated to us. Jones et al. (2018) investigated the self-extinction effect in the 21-cm line for the sample of 2022 galaxies from the ALFALFA survey and concluded that galaxy disks are almost transparent in the 21-cm line, and the required correction is only
| (12) |
The comparison between the UF and Sc, Sd face-on galaxy samples (Karachentsev and Karachentseva 2019) shows that the self-extinction effect is actually even smaller being lost in measurement errors of the H I flux of galaxies and errors in the morphological classification of galaxies.
5 STAR-FORMATION RATES IN ULTRA-FLAT GALAXIES
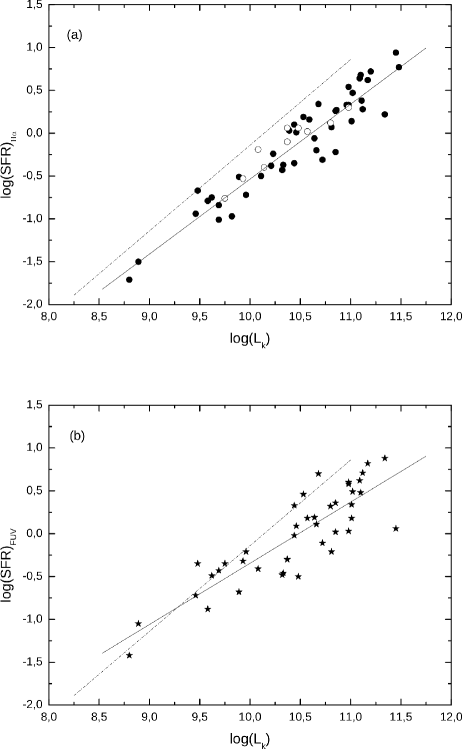
The upper panel of Figure 3 shows the dependence between the star-formation rate determined from the H flux and the luminosity of the UF galaxies. Our measurements are shown with the solid circles and data from the literature—with the open circles. The dashed line corresponds to the case , when the galaxy manages to reproduce its observed stellar mass with the observed for the cosmological time Gyr. The linear regression (the solid line) has a slope of indicating that more massive galaxies required higher star-formation rates in the past to provide the accumulated stellar mass. The similar diagram in the case of calculated from the flux is shown in the lower panel of Fig. 3. In general, the diagram has a similar shape, although, the dispersion of the estimates is larger in Fig. 3b.
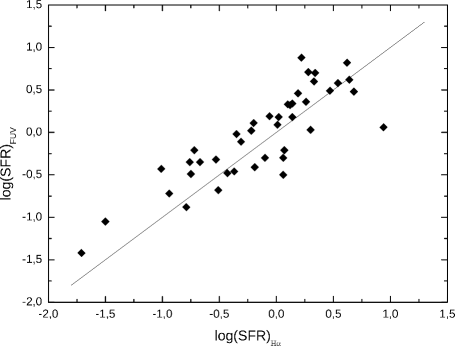
Figure 4 gives the comparison of the obtained and values. The data is well grouped along diagonal, having average and . This circumstance indirectly confirms that the difference in calibrations of empirical relations (1) and (2) is small, and the scheme we have adopted for taking into account the internal extinction in galaxies is close to reality.
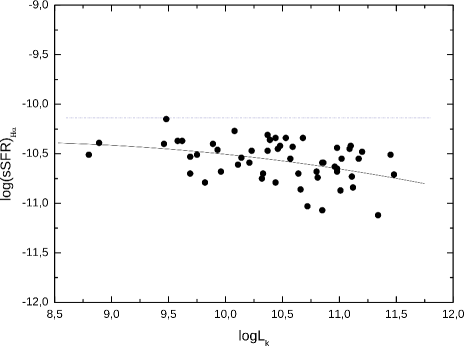
Figure 5 reproduces the relationship between the specific star-formation rate and the total luminosity or stellar mass of the UF galaxies with in solar units. The dashed horizontal line corresponds to the Hubble parameter km s-1 Mpc-1. The scatter of galaxies relative to the quadratic regression line is small, dex, which indicates a fairly uniform pattern of the star formation in thin disks of late-type spiral galaxies. Moreover, in massive disks, the gas-to-star conversion occurred in the past at about two times higher rates than in dwarf spirals.
It should be noted that this difference is leveled if is normalized not to the stellar mass but to the total baryon mass of the galaxy.
6 SOME MAIN PROPERTIES OF ULTRA-FLAT SPIRAL DISKS
The ultra-flat category represents the galaxies with a large range of linear sizes. The nearby Sd dwarf, RFGC 1700 UGCA 193 has the minimum linear diameter in our sample, 13 kpc. Among the giant disks, the Sbc galaxy RFGC 1339 UGC 4704 has the largest diameter, 105 kpc. The median linear diameter of the UF galaxies is 44 kpc. The correction for inclination adopted in HyperLEDA about one and a half times decreases the isophotal diameter of the UF galaxy.
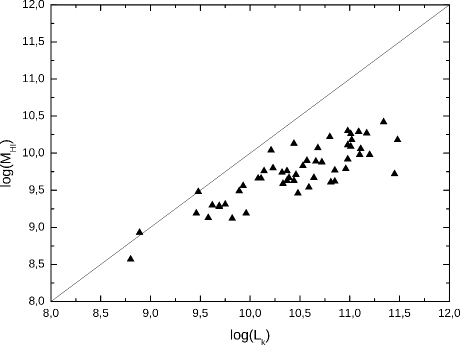
Figure 6 shows the dependence between the hydrogen mass and the luminosity of the UF galaxies. As follows from these data, the ratio systematically decreases from dwarf galaxies to high-luminosity objects. This pattern indicates that the process of converting gas into stars was the most intense in the most massive galaxies. The noticed effect obviously is not related to the presence of bulges in galaxies, since their contribution to the luminosity of the UF galaxies is quite small.
Comparing the logarithm of the hydrogen mass for the face-on (Karachentsev and Karachentseva 2019) and edge-on galaxies within equal intervals of the luminosities, we got the average difference . The negative value of this difference under the typical ratio for the UF galaxies indicates that the disks of ultra-flat galaxies are almost transparent in the 21-cm line, and correction (12) for them is excessive.
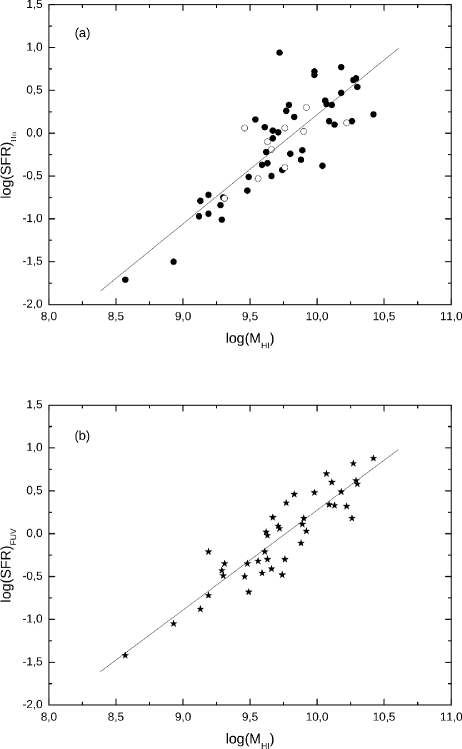
The upper and lower panels of Fig. 7 show the dependence of the star-formation rate determined from the H and fluxes on the hydrogen mass of the UF galaxies. The regression lines on them have an inclination of and , noticeably smaller than the expected from the Schmidt–Kennicutt relation (Kennicutt 1998) for individual star-formation sites. It should also be noted that the dispersion of the observed data on the – diagrams obtained from the fluxes is noticeably smaller than that obtained from the H fluxes unlike the – diagrams (Fig. 3). We did not find an explanation for this feature.
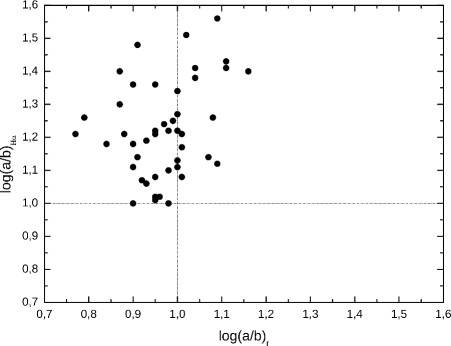
Comparison of the images given in Fig. 2 shows that all the UF galaxies without exception appear thinner in the H filter than in the red continuum. This difference is the stronger, the closer the inclination angle of the galaxy to is. Figure 8 reproduces the ratio in the H line and in the red continuum for 45 galaxies under study. Average values of and show that the thickness of the emission disk is on average almost two times smaller than that in the red continuum. As is known, the complexes of hot blue stars that regulate the glow of H II regions are approximately yrs old. Consequently, the formation of a young stellar population occurs in a thinner layer of the disk compared to the thickness of the disk of an old stellar population. This conclusion is quite expected in the picture of the formation of young H II complexes with gravitational instability of molecular gaseous clouds.
Reshetnikov and Combes (1998) investigated the statistics of S-like distortions in optical images of flat galaxies. According to the data by Reshetnikov and Combes (1998), such distortions are visible in 40% of edge-on galaxies, and their frequency increases with the increase of the flat galaxy environment. The latter circumstance indicates the external, tidal nature of the distortions visible on the outskirts of the disks. In our sample of 45 UF galaxies, we found distinct distortions of the emission disk only in one galaxy, RFGC 1133 UGC 3539222This integral-shaped galaxy is highly isolated. Its nearest neighbor, the galaxy CGCG 308-039, has a radial velocity difference of km s-1 and a projected separation of 410 kpc., and weak distortions for other 6 galaxies: RFGC 504, 531, 722, 1434, 3935, and 4039. Thus, the occurrence of distortions of the H disk of ultra-flat galaxies, no greater than %, turns out to be noticeably smaller than that of the objects of the RFGC catalog. A small percentage of peripheral distortions in ultra-flat galaxy disks is in agreement with the fact that they are preferred in the very low density regions.
7 FINAL REMARKS
The presented results of observations in the H line of ultra-flat galaxies resulted in a multiple increase in the number of the studied objects of this category. The UF edge-on galaxies have angles of rotational axis inclination to the line of sight in the range of – which, with the absence of significant bulges, corresponds to the apparent axial ratio in the blue region of the spectrum. In the emission H line, the UF galaxies look even thinner having the characteristic axial ratio . This shows that the young stellar population of galaxy disks is formed in a narrow layer, the thickness of which increases with the transition to an older population.
The internal extinction in the UF galaxies appears to be significant. With a characteristic linear diameter of about kpc, the extinction in the H line reaches –, and in the band—even –. The considerable extinction results in the faint appearance of the UF galaxies in the GALEX ultraviolet sky survey. The method of accounting for the internal extinction used by us leads to good agreement between the estimates of the star-formation rate obtained from the H and fluxes. In the 21-cm emission line, the ultra-flat galaxies of our sample are almost transparent.
The specific star-formation rate in the UF galaxies, referred to the unit of the luminosity or stellar mass, shows a systematic decrease from dex with dex to about dex with dex. The low dispersion on the vs diagram relative to the regression line indicates the uniformity of the star formation in thin disks of spiral galaxies.
To reproduce the observed stellar mass, the average star-formation rate of dwarf and massive UF galaxies had to be two and four times higher in the past, respectively, than their current value of .
The relative abundance of hydrogen mass in the UF galaxy disks is on average about 20%, varying from 50% in dwarf disks to about 8% in massive galaxies. Consequently, the UF galaxies have gas reserves to maintain the observed star-formation rates for over several billion years.
Disk shape distortions are noticeably less common in the UF galaxies than those in other edge-on galaxies of the RFGC catalog. The presence of the UF galaxies in the regions of low cosmic density is consistent with the assumption that many distortions of the periphery of spiral galaxies are due to the tidal force of close neighbors.
Acknowledgements.
In this paper, we used the data of the GALEX and PanSTARRS sky surveys as well as the HyperLEDA extragalactic database. This work was partially supported by the RSF grant 19–12–00145.References
- (1) I. D. Karachentsev, V. E. Karachentseva, Yu. N. Kudrya, et al., Bulletin of the Special Asrtophysical Observatory 47, 1 (1999).
- (2) V. E. Karachentseva, Yu. N. Kudrya, I. D. Karachentsev, et al., Astrophysical Bulletin 71, 1 (2016).
- (3) I. D. Karachentsev, V. E. Karachentseva, and Yu. N. Kudrya, Astrophysical Bulletin 71, 129 (2016).
- (4) O. V. Melnyk, V. E. Karachentseva, and I. D. Karachentsev, Astrophysical Bulletin 72, 1 (2017).
- (5) A. Banerjee & C. J. Jog, Monthly Notices Royal Astron. Soc. 431, 582 (2013).
- (6) I. D. Karachentsev, S. S. Kaisin, and E. I. Kaisina, Astrofizica 58, 453 (2015).
- (7) A. Gil de Paz, S. Boissier, B. F. Madore, et al., Astrophys. J. Suppl. 173, 185 (2007).
- (8) R. C. Kennicutt, J. C. Lee, J. G. Funes, et al., Astrophys. J. Suppl. 178, 247 (2008).
- (9) R. C. Kennicutt, Annu. Rev. Astron. Astrophys., 36, 189 (1998).
- (10) J. C. Lee, A. Gil de Paz, R. C. Kennicutt, et al., Astrophys. J. Suppl. 192, 6 (2011).
- (11) G. Gavazzi, G. Consolandi, E. Viscardi, et al., Astron. and Astrophys. 576, 16 (2015).
- (12) O. Spector & N. Brosch, Monthly Notices Royal Astron. Soc. 469, 347 (2017).
- (13) K. C. Chambers, E. A. Magnier, N. Metcalfe, et al., arXiv:1612.05560 (2016).
- (14) D. Makarov, P. Prugniel, N. Terekhova, et al., Astron. and Astrophys. 570, 13 (2014).
- (15) D. J. Schlegel, D. P. Finkbeiner, and M. Davis, Astrophys. J. 500, 525 (1998).
- (16) E. J. Shaya, R. B. Tully, Y. Hoffman, and D. Pomarede, Astron. J. 850, 207 (2017).
- (17) N. H. Jarrett, T. Chester, R. Cutri, et al., Astron. J. 125, 525 (2003).
- (18) N. H. Jarrett, T. Chester, R. Cutri, et al., Astron. J. 119, 2498 (2000).
- (19) E. F. Bell, D. H. McIntosh, N. Katz, and M. D. Weinberg, Astrophys. J. Suppl. 149, 289 (2003).
- (20) J. C. Lee, A. Gil de Paz, C. Tremonti, et al, Astrophys. J. 706, 599 (2009).
- (21) M. S. Bothwell, R. C. Kennicutt, and J. C. Lee, Monthly Notices Royal Astron. Soc. 400, 154 (2009).
- (22) B. M. Devour & E. F. Bell, Monthly Notices Royal Astron. Soc. 459, 2054 (2016).
- (23) M. A. W. Verheijen and R. Sancisi, Astron. and Astrophys. 370, 765 (2001).
- (24) I. D. Karachentsev, E. I. Kaisina, and D. I. Makarov, Monthly Notices Royal Astron. Soc. 479, 4136 (2018).
- (25) M. C. Jones, M. P. Haynes, & R. Giovanelli, Monthly Notices Royal Astron. Soc. 477, 2 (2018).
- (26) I. D. Karachentsev and V. E. Karachentseva, Monthly Notices Royal Astron. Soc. 485, 1477 (2019).
- (27) V. Reshetnikov and F. Combes F., Astron. and Astrophys. 337, 9 (1998).
5mm
\onelinecaptionstrue\captionstylenormal
5mm \onelinecaptionstrue\captionstylenormal
5mm
\onelinecaptionstrue\captionstylenormal
5mm
\onelinecaptionstrue\captionstylenormal
5mm
\onelinecaptionstrue\captionstylenormal
5mm
\onelinecaptionstrue\captionstylenormal
5mm
\onelinecaptionstrue\captionstylenormal
5mm
\onelinecaptionstrue\captionstylenormal
0mm \captionstylenormal Galaxy RA (2000.0) DEC a′ Filter (1) (2) (3) (4) (5) (6) (7) (8) RFGC 001 000056.0 202016 2.02 1.07 6804 6723 1440 13.45 RFGC 099 002547.7 021705 2.46 1.05 5339 6643 2160 12.97 RFGC 124 003149.4 264312 2.80 1.00 7235 6723 2160 12.72 RFGC 161 004214.7 180942 3.36 1.05 1553 6603 2700 12.80 RFGC 176 004708.2 302027 2.50 1.08 5248 6643 2160 12.98 RFGC 255 010836.9 013830 4.65 1.19 1982 6603 2700 12.77 RFGC 438 020302.0 093922 2.80 1.19 3864 6643 1800 12.73 RFGC 463 020926.4 371529 2.13 1.29 4586 6643 2160 13.46 RFGC 504 022131.0 141155 2.52 1.06 3744 6643 2160 12.85 RFGC 511 022356.1 064216 1.97 1.22 9560 6723 2160 13.61 RFGC 517 022515.5 452704 2.02 1.00 5195 6643 2160 13.21 RFGC 531 022827.3 153625 1.90 1.16 4080 6643 2160 13.39 RFGC 560 023631.6 071834 2.89 1.12 6122 6723 2160 12.91 RFGC 603 025017.5 083550 2.55 1.01 5326 6643 2160 13.42 RFGC 620 025426.2 423900 2.43 1.21 2162 6603 1800 13.11 RFGC 722 032524.8 161405 3.23 1.06 1873 6603 2400 12.81 RFGC 798 040048.9 350049 2.55 1.06 4157 6643 2160 12.93 RFGC 855 042921.8 044535 2.12 1.03 4353 6643 3600 13.03 RFGC 911 045146.0 034005 2.02 1.00 4578 6643 2160 13.41 RFGC 944 050732.0 113905 2.26 1.12 2358 6603 2400 13.39 RFGC 1133 064854.0 661540 2.24 1.01 3304 6643 3600 12.76 RFGC 1339 081357.6 523853 4.87 1.09 5459 6683 3600 13.31 RFGC 1434 084850.8 295212 2.13 1.05 5964 6683 3600 13.57 RFGC 1462 085901.0 391233 4.14 1.00 595 6603 2400 12.98 RFGC 1504 091154.6 200700 4.76 1.19 2177 6603 2400 12.95 RFGC 1700 100236.0 060049 4.31 1.16 661 6603 3600 12.90 RFGC 3359 182402.4 651822 2.52 1.22 7124 6723 2160 13.20 RFGC 3378 183339.5 320822 1.95 1.25 5456 6683 2400 13.62 RFGC 3385 183754.4 173201 2.63 1.14 4500 6683 1800 13.05 RFGC 3608 203523.7 061440 2.11 1.07 5798 6643 2400 13.39 RFGC 3645 204838.4 171430 2.08 1.32 8336 6723 2160 13.50 RFGC 3651 204952.2 070119 3.47 1.05 6047 6723 2160 12.94 RFGC 3803 214439.4 064121 2.06 1.27 3090 6643 2400 13.39 RFGC 3824 215235.8 281823 2.08 1.09 3476 6643 2160 12.88 RFGC 3827 215245.5 385611 3.09 1.11 5989 6723 2160 12.95 RFGC 3846 215807.4 010032 3.47 1.13 3011 6643 2160 13.17 RFGC 3880 220804.8 101959 2.16 1.33 2866 6643 2400 13.63 RFGC 3935 222316.6 285851 3.64 1.03 1808 6603 2700 12.68 RFGC 4039 225912.8 133624 3.44 1.24 2568 6643 2160 12.84 RFGC 4072 230754.9 050940 1.90 1.02 3523 6643 2160 13.26 RFGC 4078 231203.6 484859 1.93 1.29 8657 6723 2160 13.25 RFGC 4081 231313.1 062548 4.70 1.02 4839 6683 1800 13.23 RFGC 4091 231502.6 012608 2.11 1.05 4961 6643 2160 13.41 RFGC 4106 231930.4 160429 3.25 1.06 7238 6723 2160 12.97 RFGC 4149 233543.6 322306 2.37 1.12 4957 6683 2100 12.95
| RFGC | T | |||||||||||||||
|---|---|---|---|---|---|---|---|---|---|---|---|---|---|---|---|---|
| (1) | (2) | (3) | (4) | (5) | (6) | (7) | (8) | (9) | (10) | (11) | (12) | (13) | (14) | (15) | (16) | (17) |
| 1 | 5 | 0.85 | 15.65 | 0.34 | 97 | 204 | 15.53 | 13.45 | 19.18 | 10.09 | 1.29 | 10.67 | 11.01 | 0.14 | 0.34 | 10.87 |
| 99 | 5 | 0.88 | 15.69 | 0.11 | 75 | 190 | 15.02 | 12.97 | 17.26 | 10.07 | 1.28 | 10.95 | 10.68 | 0.34 | 0.70 | 10.34 |
| 124 | 5 | 0.82 | 14.61 | 0.09 | 101 | 294 | 16.54 | 12.72 | 19.92 | 9.72 | 1.51 | 9.66 | 11.45 | 0.94 | 0.06 | 10.51 |
| 161 | 7 | 0.82 | 14.33 | 0.09 | 22 | 86 | 14.33 | 12.80 | 9.28 | 0.63 | 10.76 | 9.69 | 0.84 | 10.53 | ||
| 176 | 6 | 0.89 | 14.77 | 0.29 | 75 | 165 | 14.93 | 12.98 | 17.67 | 10.11 | 1.19 | 10.19 | 10.98 | 0.33 | 0.60 | 10.65 |
| 255 | 7 | 0.73 | 14.67 | 0.11 | 24 | 89 | 14.48 | 12.77 | 16.41 | 9.30 | 0.58 | 11.13 | 9.62 | 0.75 | 0.49 | 10.37 |
| 438 | 7 | 1.04 | 14.61 | 0.11 | 53 | 117 | 14.88 | 12.73 | 16.71 | 9.83 | 1.08 | 10.57 | 10.53 | 0.19 | 0.46 | 10.34 |
| 463 | 6 | 0.73 | 16.08 | 0.21 | 66 | 104 | 15.77 | 13.46 | 9.66 | 0.68 | 12.09 | 10.11 | 0.50 | 10.61 | ||
| 504 | 6 | 0.86 | 14.73 | 0.66 | 53 | 180 | 15.03 | 12.85 | 18.28 | 9.77 | 1.21 | 9.76 | 10.85 | 0.26 | 0.36 | 10.59 |
| 511 | 5 | 1.00 | 15.88 | 0.13 | 131 | 13.61 | 18.90 | 1.50 | 10.98 | 11.12 | 0.28 | 0.71 | 10.84 | |||
| 517 | 5 | 0.86 | 15.41 | 0.40 | 74 | 128 | 16.15 | 13.21 | 19.66 | 9.61 | 1.07 | 10.59 | 10.81 | 0.07 | 0.21 | 10.74 |
| 531 | 6 | 0.75 | 16.0 | 1.00 | 58 | 93 | 15.67 | 13.39 | 20.06 | 9.59 | 0.63 | 11.27 | 10.33 | 0.37 | 0.46 | 10.70 |
| 560 | 5 | 0.90 | 15.44 | 0.54 | 85 | 202 | 14.74 | 12.91 | 18.71 | 10.29 | 1.36 | 10.19 | 11.09 | 0.64 | 0.62 | 10.45 |
| 603 | 5 | 0.95 | 15.02 | 0.13 | 73 | 130 | 16.08 | 13.42 | 18.52 | 9.62 | 1.07 | 10.47 | 10.85 | 0.22 | 0.02 | 11.07 |
| 620 | 7 | 0.69 | 15.63 | 0.40 | 32 | 86 | 15.53 | 13.11 | 18.47 | 9.13 | 0.53 | 11.85 | 9.58 | 0.79 | 0.88 | 10.37 |
| 722 | 7 | 0.83 | 15.33 | 0.18 | 25 | 101 | 14.12 | 12.81 | 16.61 | 9.48 | 0.75 | 11.55 | 9.48 | 0.67 | 0.35 | 10.15 |
| 798 | 5 | 0.89 | 15.19 | 0.92 | 59 | 166 | 15.20 | 12.93 | 9.79 | 1.19 | 9.73 | 10.96 | 0.33 | 10.63 | ||
| 855 | 6 | 0.92 | 15.38 | 0.23 | 59 | 136 | 15.40 | 13.03 | 18.09 | 9.71 | 1.07 | 10.98 | 10.46 | 0.01 | 0.09 | 10.45 |
| 911 | 6 | 0.94 | 16.0 | 0.27 | 62 | 111 | 14.68 | 13.41 | 10.04 | 0.93 | 11.70 | 10.21 | 0.38 | 10.59 | ||
| 944 | 7 | 0.75 | 15.40 | 0.69 | 31 | 99 | 15.48 | 13.39 | 9.12 | 0.67 | 11.19 | 9.82 | 0.97 | 10.79 | ||
| 1133 | 4 | 0.98 | 15.28 | 0.35 | 47 | 142 | 15.34 | 12.76 | 9.54 | 1.18 | 10.15 | 10.59 | 0.16 | 10.43 | ||
| 1339 | 5 | 0.89 | 15.23 | 0.19 | 74 | 277 | 14.52 | 13.31 | 19.27 | 10.26 | 1.59 | 10.10 | 11.01 | 0.14 | 0.18 | 10.87 |
| 1434 | 5 | 0.69 | 15.52 | 0.17 | 81 | 186 | 15.66 | 13.57 | 19.00 | 9.88 | 0.99 | 11.01 | 10.72 | 0.31 | 0.11 | 11.03 |
| 1462 | 7 | 0.98 | 15.18 | 0.13 | 15 | 48 | 14.39 | 12.98 | 16.21 | 8.93 | 0.26 | 11.94 | 8.89 | 1.50 | 1.05 | 10.39 |
| 1504 | 5 | 1.14 | 14.74 | 0.66 | 26 | 156 | 13.82 | 12.95 | 18.18 | 9.63 | 1.47 | 9.26 | 10.44 | 0.35 | 0.02 | 10.79 |
| 1700 | 7 | 1.15 | 14.70 | 0.17 | 10 | 53 | 14.40 | 12.90 | 16.60 | 8.57 | 0.40 | 11.28 | 8.80 | 1.71 | 1.42 | 10.51 |
| 3359 | 5 | 1.01 | 15.76 | 0.18 | 101 | 191 | 15.40 | 13.20 | 18.96 | 10.18 | 1.48 | 10.75 | 11.02 | 0.47 | 0.49 | 10.55 |
| 3378 | 5 | 1.15 | 16.50 | 0.38 | 78 | 184 | 16.11 | 13.62 | 19.82 | 9.67 | 1.64 | 11.13 | 10.64 | 0.06 | 0.19 | 10.70 |
| RFGC | T | |||||||||||||||
| (1) | (2) | (3) | (4) | (5) | (6) | (7) | (8) | (9) | (10) | (11) | (12) | (13) | (14) | (15) | (16) | (17) |
| 3385 | 5 | 0.74 | 15.39 | 1.27 | 65 | 234 | 14.75 | 13.05 | 10.06 | 1.21 | 9.56 | 11.11 | 0.38 | 10.73 | ||
| 3608 | 5 | 0.96 | 15.38 | 0.22 | 82 | 278 | 15.44 | 12.92 | 19.06 | 9.98 | 1.72 | 10.09 | 11.10 | 0.68 | 0.48 | 10.42 |
| 3645 | 6 | 1.03 | 16.1 | 0.25 | 116 | 13.50 | 1.40 | 11.39 | 10.86 | 0.27 | 10.59 | |||||
| 3651 | 5 | 0.90 | 15.15 | 0.27 | 85 | 253 | 14.80 | 12.94 | 18.03 | 10.27 | 1.54 | 9.99 | 11.17 | 0.62 | 0.82 | 10.55 |
| 3803 | 6 | 0.99 | 15.70 | 0.16 | 45 | 89 | 16.11 | 13.39 | 17.58 | 9.19 | 0.79 | 11.65 | 9.96 | 0.72 | 0.21 | 10.68 |
| 3824 | 6 | 0.94 | 15.28 | 0.36 | 52 | 113 | 15.22 | 12.88 | 9.67 | 0.95 | 10.87 | 10.39 | 0.03 | 10.36 | ||
| 3827 | 5 | 1.12 | 16.50 | 1.39 | 86 | 231 | 15.55 | 13.25 | 9.98 | 1.82 | 9.94 | 11.20 | 0.72 | 10.48 | ||
| 3846 | 4 | 0.79 | 15.48 | 0.23 | 44 | 143 | 14.69 | 13.17 | 18.41 | 9.74 | 0.96 | 10.69 | 10.32 | 0.43 | 0.48 | 10.75 |
| 3880 | 7 | 1.09 | 16.0 | 0.16 | 42 | 84 | 15.72 | 13.63 | 18.03 | 9.29 | 0.82 | 12.17 | 9.69 | 1.01 | 0.43 | 10.70 |
| 3935 | 7 | 0.93 | 14.36 | 0.08 | 19 | 60 | 14.24 | 12.68 | 16.10 | 9.19 | 0.42 | 11.01 | 9.46 | 0.94 | 0.72 | 10.40 |
| 4039 | 6 | 0.82 | 14.92 | 0.35 | 38 | 121 | 14.23 | 12.84 | 9.80 | 0.87 | 10.60 | 10.23 | 0.24 | 10.47 | ||
| 4072 | 5 | 0.67 | 16.39 | 0.29 | 51 | 113 | 15.63 | 13.26 | 19.03 | 9.49 | 0.67 | 12.08 | 9.89 | 0.51 | 0.68 | 10.40 |
| 4078 | 5 | 1.22 | 16.50 | 1.00 | 123 | 269 | 15.83 | 13.55 | 10.18 | 2.14 | 10.01 | 11.48 | 0.77 | 10.71 | ||
| 4081 | 5 | 0.95 | 14.53 | 0.47 | 70 | 236 | 14.00 | 13.23 | 17.90 | 10.42 | 1.56 | 9.15 | 11.34 | 0.22 | 0.88 | 11.12 |
| 4091 | 5 | 0.94 | 15.57 | 0.24 | 71 | 137 | 15.36 | 13.41 | 18.51 | 9.89 | 1.10 | 10.88 | 10.66 | 0.20 | 0.11 | 10.86 |
| 4106 | 5 | 0.67 | 15.51 | 0.24 | 102 | 217 | 15.12 | 12.97 | 18.04 | 10.30 | 1.05 | 10.87 | 10.98 | 0.54 | 0.58 | 10.44 |
| 4149 | 6 | 0.70 | 15.54 | 0.35 | 72 | 100 | 14.78 | 12.95 | 17.31 | 10.13 | 0.63 | 11.46 | 10.44 | 0.10 | 0.33 | 10.34 |
| 2246 | 7 | 1.22 | 14.10 | 0.12 | 17 | 98 | 13.70 | 12.69 | 16.30 | 9.31 | 1.08 | 10.05 | 9.75 | 0.76 | 0.35 | 10.51 |
| 626 | 7 | 0.85 | 16.93 | 0.60 | 91 | 101 | 16.23 | 13.77 | 9.76 | 0.77 | 12.71 | 10.14 | 0.40 | 10.54 | ||
| 1446 | 5 | 0.85 | 16.40 | 0.19 | 82 | 126 | 16.32 | 13.36 | 19.46 | 9.63 | 0.94 | 11.92 | 10.37 | 0.10 | 0.30 | 10.47 |
| 251824 | 5 | 1.00 | 17.52 | 0.17 | 88 | 93 | 16.65 | 13.80 | 19.43 | 9.56 | 0.84 | 13.16 | 9.93 | 0.53 | 0.32 | 10.46 |
| 2026 | 5 | 0.90 | 15.75 | 0.08 | 104 | 218 | 16.10 | 13.34 | 19.85 | 9.92 | 1.42 | 10.90 | 10.98 | 0.30 | 0.03 | 10.68 |
| 2079 | 5 | 0.80 | 16.71 | 0.10 | 94 | 158 | 16.30 | 13.34 | 19.77 | 9.76 | 1.04 | 12.22 | 10.37 | 0.06 | 0.30 | 10.31 |
| 2253 | 5 | 0.99 | 16.65 | 0.12 | 91 | 160 | 16.98 | 13.43 | 20.73 | 9.46 | 1.30 | 11.88 | 10.48 | 0.06 | 0.50 | 10.42 |
| 2322 | 5 | 0.71 | 16.07 | 0.07 | 94 | 164 | 15.93 | 13.33 | 18.31 | 9.90 | 0.94 | 11.71 | 10.57 | 0.02 | 0.18 | 10.55 |
| 2339 | 5 | 0.82 | 15.87 | 0.09 | 100 | 180 | 15.28 | 13.38 | 18.57 | 10.22 | 1.16 | 11.27 | 10.80 | 0.12 | 0.32 | 10.68 |
| 2461 | 6 | 0.80 | 17.00 | 0.07 | 97 | 116 | 16.62 | 13.51 | 19.63 | 9.66 | 0.82 | 13.01 | 10.08 | 0.19 | 0.41 | 10.27 |