The Bubble Nebula NGC 7635 – testing the wind-blown bubble theory
Abstract
We present a multiwavelength study of the iconic Bubble Nebula (NGC 7635) and its ionising star BD60∘2522. We obtained XMM-Newton EPIC X-ray observations to search for extended X-ray emission as in other similar wind-blown bubbles around massive stars. We also obtained San Pedro Mártir spectroscopic observations with the Manchester Echelle Spectrometer to study the dynamics of the Bubble Nebula. Although our EPIC observations are deep, we do not detect extended X-ray emission from this wind-blown bubble. On the other hand, BD60∘2522 is a bright X-ray source similar to other O stars. We used the stellar atmosphere code PoWR to characterise BD60∘2522 and found that this star is a young O-type star with stellar wind capable of producing a wind-blown bubble that in principle could be filled with hot gas. We discussed our findings in line with recent numerical simulations proposing that the Bubble Nebula has been formed as the result of the fast motion of BD60∘2522 through the medium. Our kinematic study shows that the Bubble Nebula is composed by a series of nested shells, some showing blister-like structures, but with little signatures of hydrodynamical instabilities that would mix the material producing diffuse X-ray emission as seen in other wind-blown bubbles. Its morphology seems to be merely the result of projection effects of these different shells.
keywords:
ISM: bubbles — ISM: H ii regions — X-rays: individual: NGC 7635, BD+60∘2522 — X-rays: stars1 Introduction
Diffuse X-ray emission has been found in a variety of systems: OB associations in star forming regions, Wolf-Rayet (WR) nebulae, planetary nebulae (PNe), and superbubbles (e.g. Ruiz et al., 2013; Güdel et al., 2008; Mernier & Rauw, 2013; Toalá et al., 2012; Townsley et al., 2014; Ramírez-Ballinas et al., 2019, and references therein). This X-ray emission is the signature of the powerful feedback from hot stars in different environments. Theoretically, in all these systems an adiabatically-shocked hot bubble with temperatures and electron densities of K and cm-3 is powered by strong stellar winds ( km s-1) and, in the case of superbubbles, the additional contribution of supernova explosions (e.g., Jaskot et al., 2011). In contrast, detailed X-ray observations performed with Chandra and XMM-Newton detected hot gas with temperatures of only =[1–3]106 K and electron densities much higher than expected ( cm-3). This discrepancy has been attributed to mixing processes between the hot bubble and the outer cold nebular material due to hydrodynamical instabilities and/or thermal conduction (e.g., Arthur, 2012; Dwarkadas & Rosenberg, 2013; Toalá & Arthur, 2011; Weaver et al., 1977).
Among individual massive stars, diffuse X-ray emission have been detected only in a handful of circumstellar nebulae. The most numerous are WR nebulae (see the cases of the nebulae around WR 6, WR 7, WR 18 and WR 136; Toalá et al., 2012, 2015, 2016a, 2017). The powerful winds from WR stars ( km s-1, M⊙ yr-1; Hamann et al., 2006) interact with slow and dense material ejected on a previous evolutionary stage (either a red supergiant or luminous blue variable) creating the WR nebula. Interestingly, WR nebulae that display diffuse X-ray emission harbour early nitrogen-rich (WNE) type stars, whilst late WN stars do not (Gosset et al., 2005; Toalá & Guerrero, 2013; Toalá et al., 2018).
Although hot gas can be easily produced by the strong winds of massive O stars, not many wind-blown bubbles (WBBs) within the H ii regions around single hot stars have been detected by X-ray satellites. The hot bubble around the runaway O 9.5V star Oph is so far the only case (Toalá et al., 2016b). Oph is the closest runaway massive star at a distance of 222 pc (Megier et al., 2009). Toalá et al. (2016b) argue that the soft diffuse X-ray emission seems to be powered by hydrodynamical mixing at the wake of the bow shock as predicted by the radiation-hydrodynamic models presented by Mackey et al. (2015).
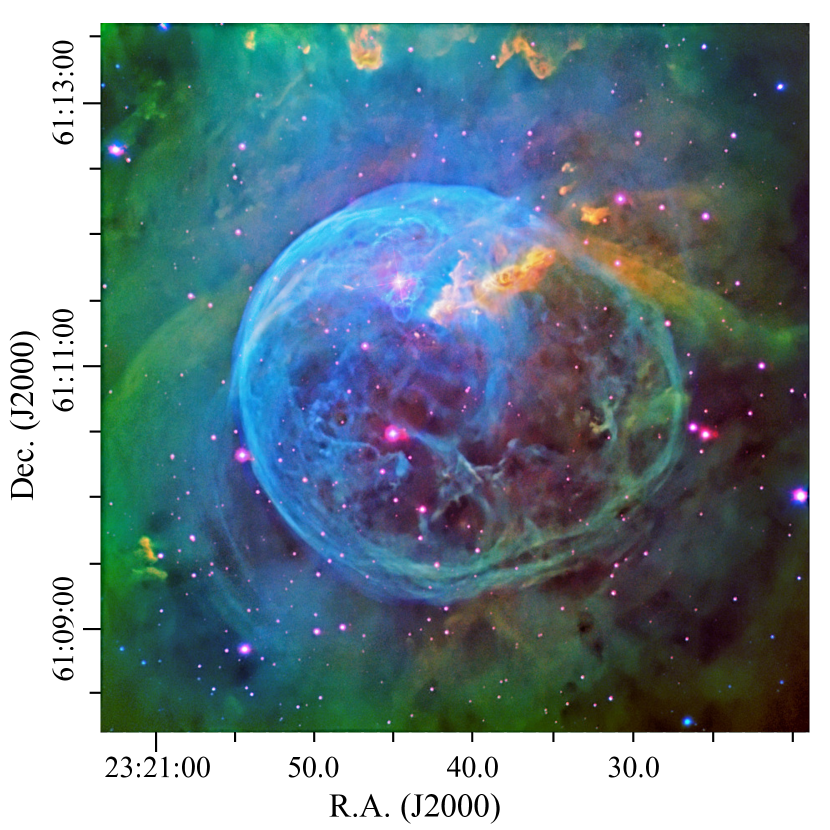
It is crucial to study the feedback from single massive stars in order to understand this effect and extrapolate to the more complex case of OB associations. For this, we have selected a key object for a detailed study of a WBB around an O-type star. The iconic Bubble Nebula (a.k.a. NGC 7635) encompasses the O-type star BD60∘2522 (O 6.5 III) and is associated to the ionised H ii region S 162 (Maucherat & Vuillemin, 1973). This region has uniquely simple morphology, which allows to disentangle the effects of the stellar wind and the reach of the ionisation photon flux effect (see Figure 1). Wide-field optical images as those presented by Moore et al. (2002) show that the Bubble Nebula is located within an ionised cavity with an extension of 12′ along the north-south direction. More recently, the Hubble Space Telescope (HST) has produced an exquisite view of the Bubble Nebula111https://www.nasa.gov/sites/default/files/thumbnails/image/p1613a1r.jpg. BD60∘2522 is the only apparent source of ionisation and mechanical energy. This makes the Bubble Nebula the perfect object to study the interaction of fast stellar winds with the ionised interstellar medium from a massive single star and the formation of a hot bubble.
With this in mind, we have carried out a multi-wavelength study of the Bubble Nebula in optical, UV, and X-rays. This paper is organised as follows. In Section 2 we present our observations. Section 3 presents the stellar atmosphere analysis of the central star of the Bubble Nebula, BD60∘2522. Section 4 presents our results. Finally, the discussion and summary are presented in Section 5 and 6, respectively.
2 Observations
2.1 Optical images and spectroscopy
We have obtained [S ii], H, and [O iii] narrowband images of the Bubble Nebula on 2015 July 17-18 with the Alhambra Faint Object Spectrograph and Camera (ALFOSC) at the 2.5 m Nordic Optical Telescope (NOT) at the Observatorio del Roque de los Muchachos, La Palma (Spain). The central wavelengths and bandpasses of the three filters are 6725 Å and 10 Å for [S ii], 6563 Å and 33 Å for H, and 5010 Å and 43 Å for [O iii], respectively. The total exposure times were 1800, 1500, and 900 s for the [S ii], H, and [O iii] images, respectively. The averaged seeing during the observations was 07. The final colour-composite image of the Bubble Nebula is presented in Figure 1.
We have also obtained cross-dispersed high-resolution Fibre-fed Echelle Spectrograph (FIES) observations of BD60∘2522 at the NOT (Telting et al., 2014) on 2015 July 19. The high-resolution mode (high-res, ) was used to acquire a spectrum in the 3700–7300 Å range without gaps in a single fixed setting. The total exposure time was 800 s.
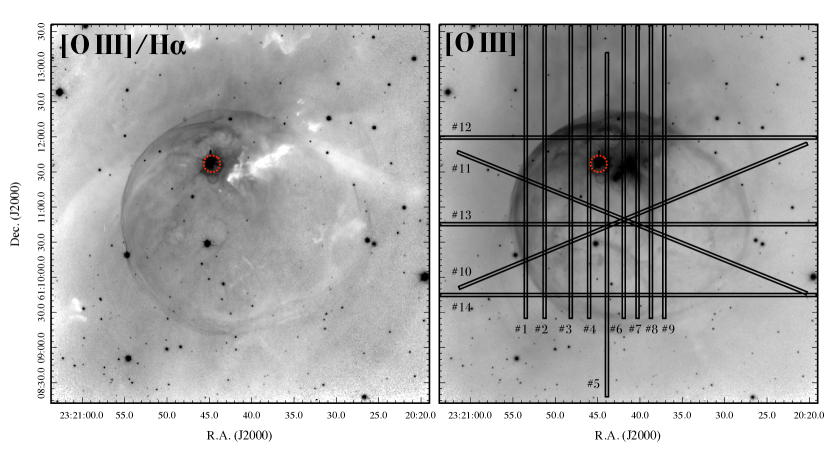
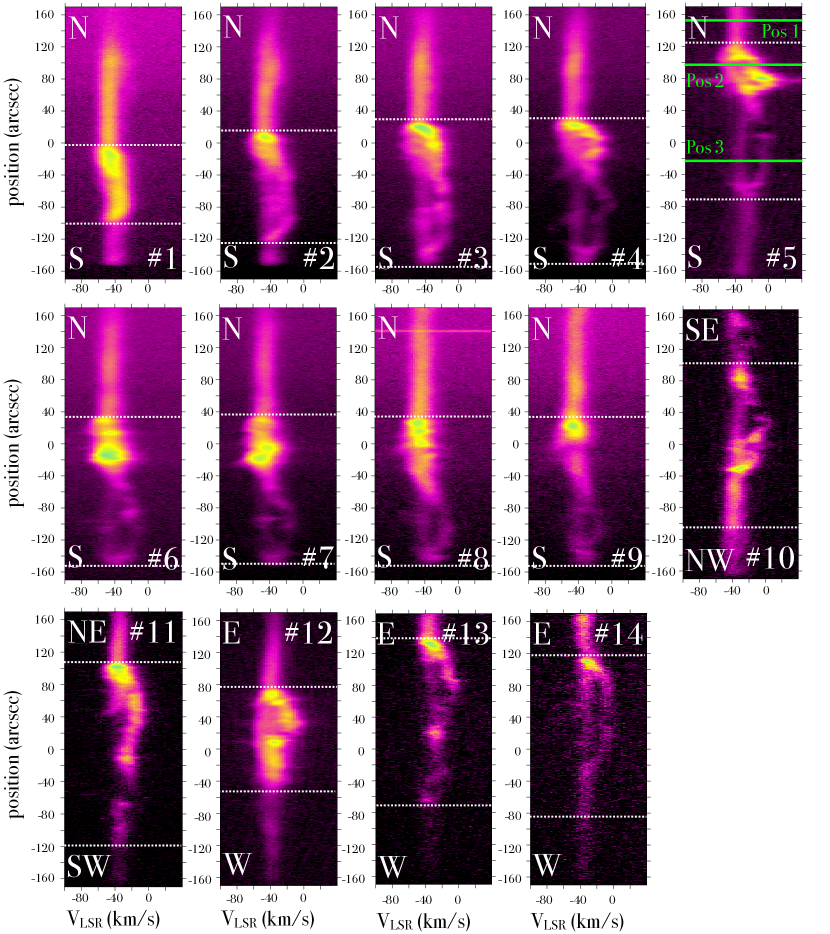
A set of 12 long-slit, high-resolution spectroscopic observations were obtained at the Observatorio Astronómico Nacional in San Pedro Mártir, Mexico, using the Manchester Echelle Spectrometer (MES-SPM) mounted on the 2.1 m telescope. Spectra were obtained on 2015 August 11–15 and another six on 2019 November 6. The slit, with a fixed length of 55 and width set to 150 m (19), was placed at several positions covering different spatial features in the nebula (see Fig. 2). For both observation runs, we used a 20482048 pixels E2V CCD with a pixel size of 13.5m per pixel with a 22 binning corresponding to a spatial scale of 0351 per pixel. The filter centred on the [O iii] 5007 emission line (with = 50 Å) was used to isolate the echelle 114th order leading to a spectral scale of 0.043 Å pixel. All the spectra were taken with exposures of 1800 s and the seeing was for all observations as estimated from the FWHM of stars in the field. The wavelength-calibration was performed with a ThAr arc lamp with an accuracy of 1 km s-1. The spectral resolution is given by the FWHM of the arc lamp emission lines and is estimated to be 121 km s-1. As we are primarily interested in the kinematical information no flux calibration was performed. The resultant spectra are presented in Figure 3.
All optical data (images and spectra) described in this section were reduced using standard iraf procedures (Tody, 1993).
2.2 XMM-Newton observations
The Bubble Nebula was observed by the European Space Agency XMM-Newton X-ray telescope on 2015 June 18 (Observation ID 0764640101; PI: M.A. Guerrero) using the European Photon Imaging Cameras (EPIC) in Full Frame Mode with the medium optical blocking filter. The total exposure times for the pn, MOS1, and MOS2 cameras were 51.8, 63.5, and 63.4 ks, respectively.
In order to analyse the X-ray observations of the Bubble Nebula we used the XMM-Newton Science Analysis Software (sas) version 15.0 and the calibration access layer available on 2017 July 3. The Observation Data Files were reprocessed using the sas tasks epproc and emproc to produce the corresponding event files. Periods of high-background levels were removed from the data. This has been done by creating lightcurves in the 10–12 keV energy range binning the data over 100 s for each EPIC camera. The background was considered to be high for count rates values higher than 0.4, 0.18, and 0.18 for the pn, MOS1, and MOS2 cameras, respectively. After processing, the final effective times were reduced to 40.5, 58.7, 58.9 ks for the pn, MOS1, and MOS2, respectively.
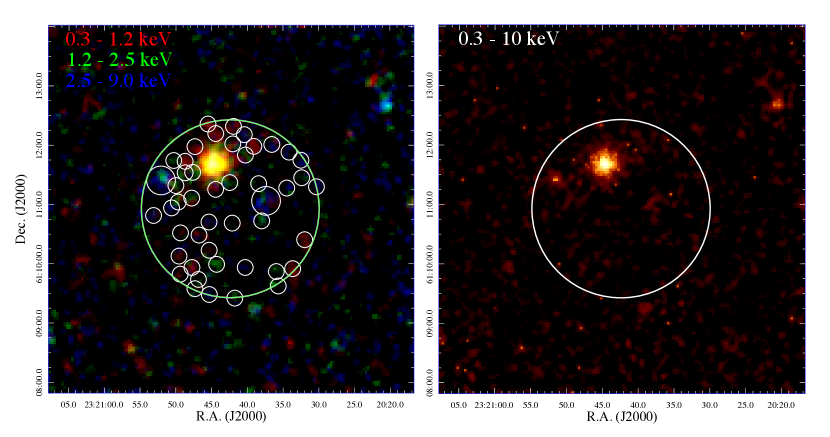
To obtain a clear view of the distribution of the X-ray emission in NGC 7635, we followed the Snowden & Kuntz cookbook for the analysis of XMM-Newton EPIC observations of extended sources (xmm-esas). These tasks remove the contribution from astrophysical background, soft proton background, and solar wind charge-exchange reactions, which contribute importantly at lower energies (1.5 keV). The esas tasks were used to create EPIC images in the soft (0.3–1.2 keV), medium (1.2–2.5 keV), and hard (2.5–9.0 keV) energy bands. Individual EPIC-pn, EPIC-MOS1, and EPIC-MOS2 images were extracted, corrected for exposure maps, and merged together. Figure 4 presents the final exposure-map-corrected, background-subtracted EPIC images as well as a colour-composite image of the three bands. Each image has been adaptively smoothed using the esas task adapt requesting 10 counts per smoothing kernel.
2.3 Complementary Archival Observations
In order to model the atmosphere of BD60∘2522 we downloaded Far Ultraviolet Spectroscopic Explorer (FUSE) and International Ultraviolet Explorer (IUE) observations. The data from these observations have been retrieved from MAST, the Multimission Archive at the Space Telescope Science Institute222STScI is operated by the Association of Universities for Research in Astronomy, Inc., under NASA contract NAS5-26555.. The FUSE observations correspond to the IDs d1130101000 (PI: P. Dufour) and u1046701000 (PI: W.P. Blair) obtained on 2003 August 4 and 2006 November 2 with total exposure times of 35 ks and 16 ks, respectively. The FUSE observations cover a spectral range between 916–1190 Å.
The IUE observations in the spectral range 1149-1978 Å correspond to the Obs. ID swp08840 and have been taken with the large aperture at high dispersion with a total exposure time of 10 ks.
In total there are 13 IUE and four FUSE observations in the archives with different spectral settings or from different epochs. The data scarcity precludes a study of UV line variability. Rauw et al. (2003) reported the variability of some optical emission lines in BD60∘2522, e.g., He ii 4686, but it is small if compared to the Of?p star CPD28∘2561 (e.g. Hubrig et al., 2015).
3 Analysis of the stellar wind from BD60∘2522
We analysed the optical FIES and UV FUSE and IUE spectra of BD60∘2522 using the most recent version of the Potsdam Wolf-Rayet (PoWR) model atmosphere333http://www.astro.physik.uni-potsdam.de/PoWR. The PoWR code solves the NLTE radiative transfer problem in a spherical expanding atmosphere simultaneously with the statistical equilibrium equations and accounts at the same time for energy conservation. Iron-group line blanketing is treated by means of the superlevel approach (Gräfener et al., 2002), and wind clumping is taken into account in first-order approximation (Hamann & Gräfener, 2004). We do not calculate hydrodynamically consistent models, but assume a velocity field following a -law with = 0.8 as used e.g. in Shenar et al. (2015) for Ori, which gives a consistent fit for most of the the wind lines, i.e., a depth-depended clumping with a maximum value of in the outer wind. Our computations applied here include complex atomic models for hydrogen, helium, carbon, nitrogen, silicon, phosphorus, and the iron-group elements.
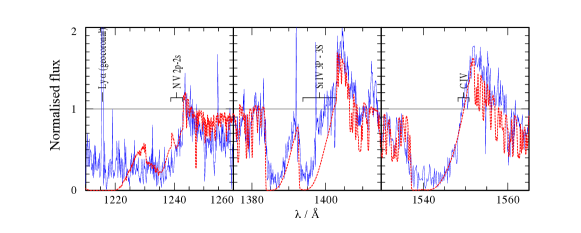
The blue edge of the P Cygni profiles were used to estimate a terminal wind velocity =2000100 km s-1, in agreement with Prinja et al. (1990). Additional broadening due to depth dependent microturbulence with km s-1 in the photosphere up to km s-1 in the outer wind was taken into account for the emergent spectrum, allowing an adequate fit of the width of the Si iv and the C iv resonance lines (see Fig. 6). A better fit to the blue edge of the P Cygni trough of C iv can be achieved by a slightly higher terminal velocity ( km s-1) or a larger value of the microturbulence ( km s-1 in the outer wind). A constant value of km s-1 was used during the calculation of the population numbers and is consistent with the observed strength of the He ii 4-3 line, which is very sensitive to the value of . Other authors give higher values for but without taking microturbulence into account.
We calculated the quasi-hydrostatic part of the atmosphere consistently according to Sander et al. (2015) and took pressure broadening of the spectral lines in the formal integral into account. The line wings of the Balmer lines were used to determine . We also applied rotational broadening to the formal integral as described in Shenar et al. (2014) with and km s-1, which gives a better fit to the photospheric absorption lines (e.g. He i 4472 Å, O iii 5600 Å) than the value of km s-1 (Howarth et al., 1997).
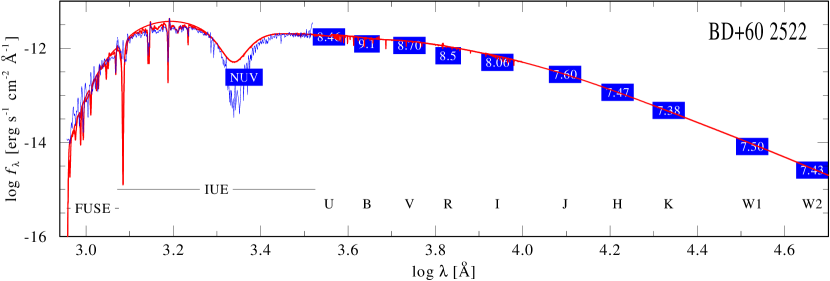
Based on spectra and photometry from near-UV to the near-IR WISE band at 12 m we computed a colour-excess =0.68 mag following the extinction law by Cardelli et al. (1989) with =3.1. As , the extinction in the band was estimated to be 2.1 mag. An hydrogen column density of was estimated using the relation given by Groenewegen, & Lamers (1989). The synthetic spectrum was then corrected for interstellar extinction due to dust by the reddening law of Seaton (1979) for the UV and optical, as well as for interstellar line absorption for the Lyman series in the UV range. Finally, we diluted the synthetic SED by the distance. The later was taken to be = 2.5 kpc favoured by Moore et al. (2002), which is also consistent with the Gaia estimate of 2.50.2 kpc from (Gaia Collaboration et al., 2016, 2018; Bailer-Jones et al., 2018). A comparison of our resultant "corrected" synthetic SED to the observations is presented in Figure 7.
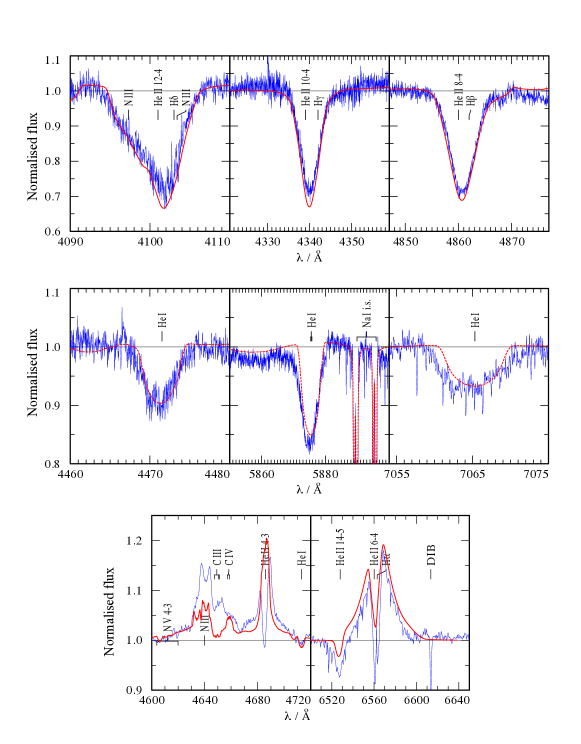
The effective temperature kK, which we define at a radius of , was derived from the strength of the He i lines (see Fig. 5). The value of is very well constrained; for kK the He i lines are already much stronger than observed, while for kK the He i lines appear to weak.
The mass-loss rate of was determined with help of the H emission line, but is also consistent with the UV resonance and optical emission lines (see Fig. 5 middle panel). However, we failed to reproduce the C iii 4647.4 4650.3 4651.1-multiplet in emission as observed, as our models show these lines only in absorption. Note that this feature is stronger in our observation than in those by Rauw et al. (2003). As the model reproduces the C iii 5696 line sufficiently well, it does not seem to be a problem of the C iii/C iv ionisation balance in general.
The observed P Cygni line profile of the N v resonance doublet can only be reproduced by taking Auger ionisation due to X-rays in the wind into account. We adopted an X-ray luminosity of about and a plasma temperature derived in the X-ray analysis (see next section). We account only for the free-free emission of these hot electrons. The X-rays then ionise the N iii of the “warm” wind to N v.
The parameters of our best-fit PoWR model to BD60are presented in Table 1. The comparison between normalised spectral lines as detected by FIES and UV observations with our best-fit model are presented in Figures 5 and 6, respectively.
| Parameter | Value | Comment |
| [mag] | 0.680.02 | fitted |
| [kK] | 350.5 | fitted |
| [kpc] | 2.50.2 | from Bailer-Jones et al. (2018) |
| L | 5.40.1 | fitted |
| [R⊙] | 15.30.4 | from and |
| (clumping factor) | 20 | depth-dependent |
| 5.90.1 | from H | |
| [km s-1] | 2000100 | fitted |
| log [cm s-2] | 3.50.1 | fitted |
| [M⊙] | 277 | from and log |
| Chemical abundances (mass fraction) | ||
| H | 0.74 | solar |
| He | 0.25 | solar |
| C | (5.4) | 0.25solar |
| N | (2.8 | 4solar |
| O | (1.2) | 2solar |
| Si | 6.7 | solar |
| P | 5.8 | solar |
| S | 3.1 | solar |
| Fe-group | 1.3 | solar |
4 Results
4.1 X-rays from NGC7635 and BD60∘2522
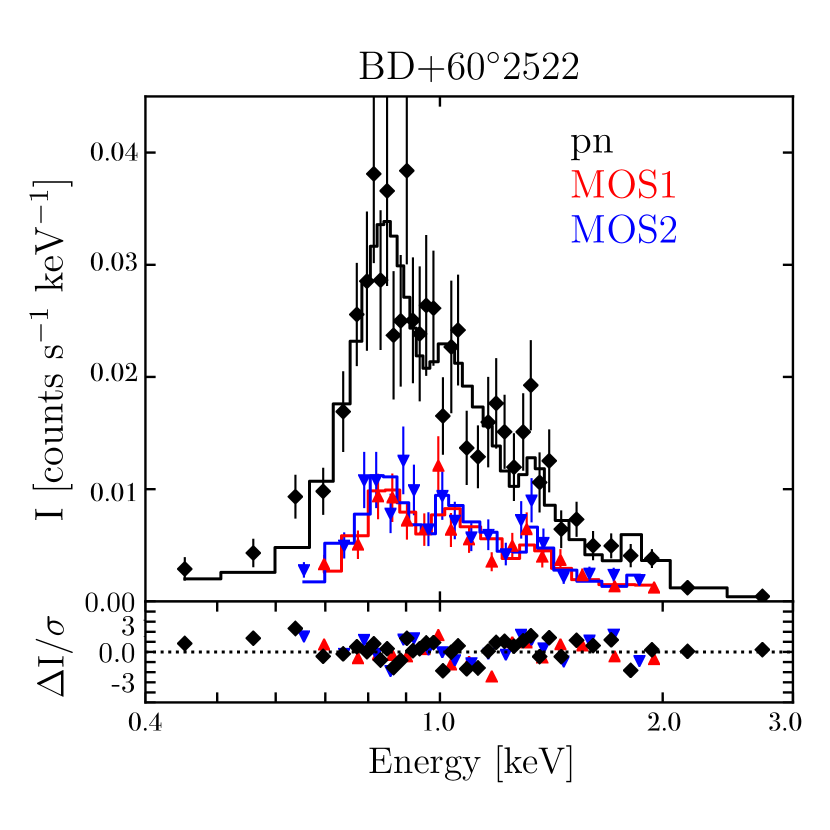
Figure 4 presents X-ray images as described in Secion 2.3. Although our XMM-Newton observations are deep, there is no clear evidence of diffuse X-ray emission filling NGC 7635. Most of the detected emission within the Bubble Nebula can be explained to the contribution of point sources along the line of sight. Some of them even have optical and IR counterparts. The rest have been identified by the pipeline of identification of point-sources. Thus, we conclude that no diffuse X-ray emission is detected within NGC 7635.
To calculate an upper limit to the diffuse X-ray emission, we extracted the spectrum from the large circular aperture defined in Figure 4. This has been done by excising regions that contain all identified point sources, regardless of the the band they were identified, in order to reduce any possible contribution. We derived a 3 upper limit to the EPIC-pn camera in the 0.3–5.0 keV of 1.510-3 counts s-1 after correcting for the area of the excised regions. We used the PIMMS webpage444http://cxc.harvard.edu/toolkit/pimms.jsp to estimate the flux upper limit of the observation adopting an =0.73 mag. For discussion (see Section 5), we assumed an optically thin model plasma apec model with solar abundances for two different plasma temperatures: i) a soft temperature 0.22 keV (=2.5106 K) and ii) a hard temperature of =2.16 keV (=2.5107 K). The estimated upper limits of the unabsorbed flux for the soft and hard temperatures are 110-14 erg cm-2 s-1 and 610-15 erg cm-2 s-1. These fluxes correspond to X-ray luminosity upper limits of erg s-1 and 5 erg s-1. According to PIMMS these correspond to normalisation parameters555The normalisation parameter is defined as of =8.010-6 cm-5 and =4.310-6 cm-5.
On the other hand, Figure 4 clearly shows that X-ray emission is unambiguously detected from the central star of NGC 7635, BD60∘2522. In order to study the physical properties of this X-ray emission, we have extracted background-subtracted spectra from the three EPIC cameras. These were produced using a circular aperture with 20 in radius. Figure 8 presents the resultant background-subtracted EPIC-pn and MOS spectra of BD60∘2522. Most of the emission is detected in the 0.4–3.0 keV energy range, peaking at 0.8–0.9 keV, signature of the Ne lines and the Fe-complex.
We have modelled the X-ray emission from BD60∘2522 using an apec emission model. The best-fit model (/DoF=1.15) resulted in a main plasma temperature of =0.60 keV ( K). The absorbed flux in the 0.4–3 keV energy range is =4.110-14 erg cm-2 s-1 which corresponds to an unabsorbed flux of =3.610-13 erg cm-2 s-1. Thus, the estimated X-ray luminosity at a distance of 2.5 kpc is =2.51032 erg s-1. Using the absolute magnitude of =9.7 mag (see table 1 in Christopoulou et al., 1995) we estimated a bolometric luminosity of =6105 L⊙, thus, fulfilling the 10-7 relationship of O-type stars (Pallavicini et al., 1981; Nebot Gómez-Morán & Oskinova, 2018, and references therein). This model is shown in Figure 8 in comparison with the EPIC spectra.
We also searched for X-ray variability from BD60∘2522. For this, we created lightcurves in different energy ranges. There is no apparent variation in the X-ray light curve in the complete energy range. Different bands have been also analysed, but a similar result are found. We note that Rauw et al. (2003) reported that BD60∘2522 exhibits a variability of 2–3 days which is several times larger than the exposure time of our EPIC observations.
4.2 The kinematics of NGC 7635
Our SPM-MES echelle observations presented in Figure 3 reveal the kinematics of the Bubble Nebula. The complex velocity structure clearly departs from the spherical case (see Christopoulou et al., 1995, and references therein). Although the general extension of the Bubble Nebula can be traced in the PV diagrams, there is noticeable kinematical substructures. Several spectra presented in Figure 3 exhibit a double bubble morphology. A small bubble-like structure surrounding BD60∘2522 and a more extended secondary structure well-resolved in velocity towards the south.
In order to unveil the detailed structure of the double bubble morphology, we extracted velocity profiles in three different positions from Slit #5. Position 1 (Pos 1) corresponds to the region outside the Nubble Nebula towards the north, position 2 (Pos 2) was placed at the bubble-structure around the central star and Position 3 (Pos 3) corresponds to the larger bubble-structure (see Fig. 3). The corresponding velocity profiles extracted from the three positions in Slit #5 are presented in Figure 9. The velocity profile extracted from Pos 1 corresponds to the VLSR of the ionised complex to the north of the Bubble Nebula. This presents a single peak profile at VLSR=36 km s-1 (Vhel=44.4 km s-1). The expansion velocity of the bubble around the central star extracted from Pos 2 is 15 km s-1 and is centred at VLSR=32 km s-1 (Vhel=39.8 km s-1). The most extended bubble structure towards the south probed by the line profile at Pos 3 has an estimated expansion velocity of 14.5 km s-1 and it is centred at VLSR=19 km s-1 (Vhel=26.8 km s-1). We note that there is emission detected at V km s-1 in the vicinity of BD60∘2522 corresponding to V70 km s-1 which might be the reason why most authors report such high heliocentric velocities (see table 2 in Christopoulou et al., 1995). We note that similar velocity profiles are obtained if extracted from different slits. For example, a velocity profile from Slit #4, which maps the bright emission around BD60∘2522, has a similar velocity profile as that illustrated by Pos 2 in Figure 9.
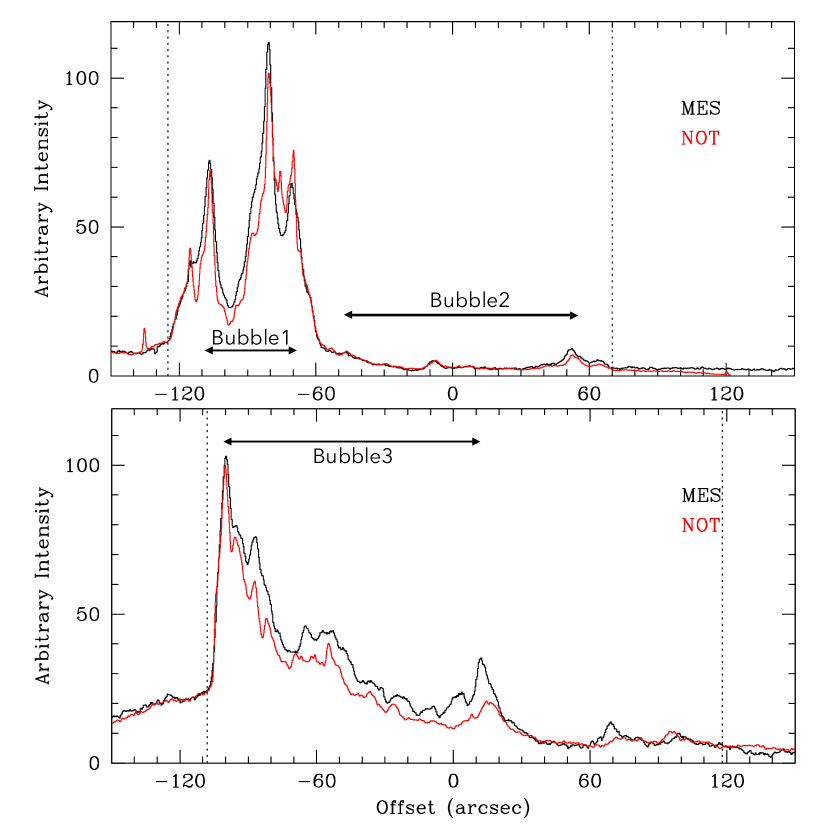
The general velocity structure of the Bubble Nebula is well described by our SPM-MES observations. These observations show that the structure close to the progenitor star is coherent and has a well defined shape. The secondary diffuse bubble-like structure towards the south-west region is diffuse, which makes is difficult to trace its limits in the velocity profiles due to confusion with the outer ionised region (see, e.g., Slit #11 in Fig. 3). This double-bubble morphology is easily traceable in the velocity profiles from Slits #1 to #9, which are oriented in the N-S direction. For further illustration, we extracted intensity profiles from different SPM-MES slits. Figure 10 shows the results for Slits #5 and Slit #11 in comparison with profiles extracted from the NOT [O iii] narrow-band image. The extension of the bubble-like structures as inferred from Figure 3 are illustrated with arrows. Bubble 1 shows the structure around BD60∘2522, whilst Bubble 2 corresponds to the larger cavity centred at V19 km s-1. From the profile extracted from Slit #11 we can identify a large cavity (labelled as Bubble 3) that might be part of (or related to) Bubble 2. We note that similarly to the nebular narrow-band images presented in Figure 1 and 2, the MES observations show that the edge of the bubble is not sharp towards the south, west and south-west regions. As a matter of fact, the MES observations imply that the large bubble towards the south has a disrupted bubble morphology.
5 Discussion
Our detailed model of BD60∘2522 indicates that it is a normal O-type star with abundances close to Solar. Its X-ray spectra also resemble those of other O-type stars. Although optical variability has been reported in previous works, the duration of the X-ray observations presented here are not long enough to make a reliable assessment of variability in this band.
It has been widely accepted that the Bubble Nebula has been carved by the stellar wind from BD60∘2522. Indeed its powerful stellar wind (=2000 km s-1, =1.310-6 M⊙ yr-1; see section 3) should have easily produced a bubble filled with adiabatically-shocked wind material. Theoretically, the stellar wind-ISM interaction produces a hot bubble with temperature in excess to 107 K, but very low electron densities, of the order of =10-3 cm-3. Most WBB detected in X-rays exhibit plasma temperatures at least an order of magnitude below theoretical expectations and electron densities of the order of 1–10 cm-3 (see Section 1). In such systems, hydrodynamical instabilities created at the edge of the adiabatically-shocked region in contact with the nebular material are capable of reducing the temperature of the bubble while increasing its density and, thus, increasing its X-ray emissivity (e.g., Toalá & Arthur, 2018). The lack of X-ray emission from the Bubble Nebula questions this is actually the case.
Alternatively, Green et al. (2019) proposed that the Bubble Nebula is a bow shock around a runaway star, following the reported high proper motions of BD60∘2522 (283 km s-1) from the Gaia data release. As these authors propose, the Bubble Nebula would not be a simple WBB, but rather “a favourably oriented dense bow shock” located at the north of the star. These authors presented detailed 2D hydrodynamical simulations to interpret its optical and near-IR morphology and to predict the spatial and spectral properties of the X-ray emission. Their best-fit model, for an ISM with constant density of 100 cm-3 and a stellar velocity of 20 km s-1, is able to reproduce accurately the morphology of the Bubble Nebula observed in HST H and Spitzer 24 m images by assuming that BD60∘2522 moves along a direction tilted by 60∘ with respect of the plane of the sky. These estimates can be refined using the radial velocity of BD60∘2522 of 261 km s-1 derived from our high-resolution FIES spectrum and the velocity on the plane of the sky of 25 km s-1 derived from our re-analysis of Gaia data using a distance of 2.5 kpc. Accordingly, BD60∘2522 is found to move along an angle of 46∘ with respect to the plane of the sky with a space velocity of 36 km s-1. The angle is close to that of 56∘ estimated by Green et al. (2019), but the space velocity is notably larger than their space velocity of 20 km s-1.
In Green et al. (2019)’s models, the hot bubble becomes unstable at the wake of the bow shock producing hydrodynamical instabilities that are then a source of mass, mixing material into the hot bubble to produce optimal conditions for soft X-ray emission. Green et al. (2019) estimated that such process would produce an unabsorbed X-ray luminosity for the soft X-ray XMM-Newton band (0.3–2.0 keV) of =1032–1033 erg s-1 and a corresponding estimate for the hard X-rays of 1030–1031 erg s-1. Their estimated mean temperature of the soft and hard X-ray emission are 0.22 keV and 2.2 keV, respectively. However, our observations did not detect diffuse X-ray emission and the upper limits derived in Section 4.1 are at least two orders of magnitude below these theoretical predictions.
We also checked FUSE spectra looking for absorption or emission of the [O vi] 1032,1037 in the line of sight of BD60∘2522. Along with N v and C iv, this feature has been correlated with the presence of a mixing region between the hot bubble and the nebular material and can be related to the presence of X-rays (Gruendl et al., 2004; Ruiz et al., 2013; Fang et al., 2016). We did not found any hint of emission nor absorption of this line.
The lack of diffuse X-ray emission from the Bubble Nebula might suggest that mixing has not been very efficient. This is supported by the lack of strong indications of instabilities (e.g., clumpy structure), as seen in the case of the Wolf-Rayet nebula NGC 6888 (Stock & Barlow, 2010; Toalá et al., 2016a). If clumps and filaments resultant from instabilities are present in the Bubble Nebula, their effects in mixing outer ionised material into the hot bubble must be small so that the X-ray emissivity is still below the detection limit of the current X-ray satellites. We can estimate upper limits to the electron densities of the hot gas in the Bubble Nebula by using the normalisation parameters obtained with PIMMS (see Section 4.1). Adopting a plasma temperature of 0.22 keV and 2.2 keV (as those predicted by Green et al., 2019), we estimate upper limits of 0.07 cm-3 and 0.04 cm-3, which are very low compared to the detections of soft X-ray emission from other WBBs. Green et al. (2019) argue that some structures around runaway stars, in particular hydrodynamical instabilities, might be suppressed by magnetic fields. This would certainly reduce the efficiency of mixing into the hot bubble causing a low X-ray flux, but we note that magnetic fields have not been reported to be present in the Bubble Nebula so far.
The kinematic structure of the Bubble Nebula can provide an alternative explanation to the lack of diffuse X-ray emission. Christopoulou et al. (1995) suggested a broken bubble-like structure based on limited kinematic data, as could be expected in Green et al. (2019)’s models, but the larger coverage of our SPM-MES observations unveils that NGC 7635 is actually composed by several disrupted bubble-like structures or blisters. In particular, a bright cavity with an angular extension of (0.50 pc) seems to surround BD60∘2522, whereas an even larger cavity extends mostly towards the southern regions of the Bubble Nebula with an extension of (1.45 pc), as shown in the top panel of Figure 10. The Bubble Nebula is not “a favourably oriented dense bow shock”, but a series of nested shells that joint together into an apparently single bubble, which are not expected in Green et al. (2019)’s models, although projection effects result in apparent closed shells in their synthetic H and 24 m images. The physical structure of the Bubble Nebula might be indicative of its complex interaction with its surroundings, which may involve different episodes of enhanced mass-loss from the central star (as suggested by the larger nested shells detected in wide-field optical images; e.g., Moore et al., 2002) or successive interactions of a moving star with a stratified ISM in addition to the growth of hydrodynamical instabilities (Pittard, 2013).
The non-detection of extended X-ray emission filling the Bubble Nebula is in line with the growing number of bow shocks not detected in X-rays. So far, 13 runaway hot stars have been studied with X-ray observations, but only one, namely Oph, has resulted in a positive detection of extended thermal X-ray emission (Toalá et al., 2016b, 2017; De Becker et al., 2017). Oph exhibits a clear bow shock in IR and optical, but lacks a complete (close) bubble-like morphology. Nevertheless, the extended (thermal) X-rays are detected at the wake of the bow shock as predicted by numerical simulations (see Mackey et al., 2015; Green et al., 2019).
6 Summary
We have presented a multiwavelength study of the Bubble Nebula (a.k.a. NGC 7635) and its central star, BD60∘2522. We have used the stellar atmosphere code PoWR to characterise in unprecedented detail the Ofp-type star BD60∘2522. Our best-fit model as well as the results from its X-ray emission shows that this star is a classic young O-type star. Its stellar wind parameters are =2000 km s-1 and =1.310-6 M⊙ yr-1, a stellar mass of 277 M⊙ with abundances very close to those of the Sun, in accordance to previous observational estimates. We found that BD60∘2522 is X-ray bright with a dominant plasma temperature of 0.60 keV (= K) and an X-ray luminosity in the 0.4–3.0 keV energy range that fulfills the luminosity criteria of 10-7. Our stellar atmosphere model of BD60∘2522 has been improved by including the X-ray properties of this star. In particular, the observed P Cygni line profile of the N v resonance doublet can only be reproduce by Auger ionisation due to the X-ray emission from the star.
Although it is clear that the wind from BD60∘2522 is powerful enough to produce the Bubble Nebula, no diffuse X-ray emission is detected within this WBB. Assuming that the Bubble Nebula is filled with hot gas at =0.22 keV we estimated an upper limit to the X-ray flux and luminosity of 1.010-14 erg cm-2 s-1 and erg s-1, respectively. These estimates are even lower if hotter gas is adopted. The estimated upper limit of electron density 0.04–0.07 cm-3 suggests that mixing between the hot bubble and the outer nebular material has not been efficient enough – or it has been supressed – to produce detectable emissivity values or that the Bubble Nebula has a different origin.
Kinematic data unveil the presence of a series of of nested shells that joint together into an apparently single bubble, with additional blisters that have grown to the point that have disrupted some regions of NGC 7635. This structure, in conjunction with the notable space velocity of BD60∘2522, support the idea that the nebula formed as the result of the motion of the star and the interaction of successive episodes of enhanced mass-loss with a stratified medium. While the model proposed by Green et al. (2019) is interesting, it is not clear that it includes all ingredients required for a direct comparison with the observations. Further improvements, such as accounting for density gradients, magnetic fields, and successive episodes of enhanced mass-loss, might be necessary to fully understnd the complexity of the Bubble Nebula.
The search for thermal X-ray observations of runaway stars and their bow shocks has resulted in negative reports for most cases except for Oph. Thus, the lack of diffuse X-ray emission from the Bubble Nebula seems to be the rule and not the exception.
Acknowledgements
The authors thank the referee for a useful report that improved the presentation of this paper. This work is based on observations obtained with XMM-Newton, an ESA science mission with instruments and contributions directly funded by ESA Member States and NASA. The NOT data presented were obtained with ALFOSC and FIES, which are provided by the Instituto de Astrofísica de Andalucía (IAA-CSIC) under a joint agreement with the University of Copenhagen and NOTSA. This paper makes use of observations carried out at the Observatorio Astronómico Nacional on the Sierra San Pedro Mártir (OAN-SPM), Baja California, Mexico. We thank the daytime and night support staff at the OAN-SPM for facilitating and helping obtain our observations. JAT, MAG and HT are funded by UNAM DGAPA PAPIIT project IA100318. GRL acknowledges support from Fundación Marcos Moshinsky, CONACyT and PRODEP (Mexico). MAG acknowledges support of the grants AYA 2014-57280-P and PGC2018-102184-B-I00 of the Spanish Ministerio de Ciencia, Innovación y Universidades, cofunded with FEDER funds. LS is supported by UNAM-PAPIIT grant IN101819.
References
- Anand et al. (2009) Anand, M. Y., Kagali, B. A., & Murthy, J. 2009, Bulletin of the Astronomical Society of India, 37, 1
- Arthur (2012) Arthur, S. J. 2012, MNRAS, 421, 128 3
- Bailer-Jones et al. (2018) Bailer-Jones, C. A. L., Rybizki, J., Fouesneau, M., et al. 2018, AJ, 156, 58
- Cardelli et al. (1989) Cardelli, J. A., Clayton, G. C., & Mathis, J. S. 1989, ApJ, 345, 245
- Christopoulou et al. (1995) Christopoulou, P. E., Goudis, C. D., Meaburn, J., Dyson, J. E., & Clayton, C. A. 1995, A&A, 295, 509
- De Becker et al. (2017) De Becker, M., del Valle, M. V., Romero, G. E., Peri, C. S., & Benaglia, P. 2017, MNRAS, 471, 4452
- Dwarkadas & Rosenberg (2013) Dwarkadas, V. V., & Rosenberg, D. L. 2013, High Energy Density Physics, 9, 226
- Fang et al. (2016) Fang, X., Guerrero, M. A., Toalá, J. A., Chu, Y.-H., & Gruendl, R. A. 2016, ApJ, 822, L19
- Gaia Collaboration et al. (2016) Gaia Collaboration, Brown, A. G. A., Vallenari, A., et al. 2016, A&A, 595, A2
- Gaia Collaboration et al. (2018) Gaia Collaboration, Brown, A. G. A., Vallenari, A., et al. 2018, A&A, 616, A1
- Gosset et al. (2005) Gosset, E., Nazé, Y., Claeskens, J.-F., et al. 2005, A&A, 429, 685
- Gräfener et al. (2002) Gräfener, G., Koesterke, L., & Hamann, W.-R. 2002, A&A, 387, 244
- Green et al. (2019) Green, S., Mackey, J., Haworth, T. J., Gvaramadze, V. V., & Duffy, P. 2019, arXiv:1903.05505
- Groenewegen, & Lamers (1989) Groenewegen, M. A. T., & Lamers, H. J. G. L. M. 1989, A&AS, 79, 359
- Gruendl et al. (2004) Gruendl R. A., Chu Y.-H., Guerrero M. A., 2004, ApJ, 617, L127
- Güdel et al. (2008) Güdel, M., Briggs, K. R., Montmerle, T., et al. 2008, Science, 319, 309
- Hamann & Gräfener (2004) Hamann, W.-R., & Gräfener, G. 2004, A&A, 427, 697
- Hamann et al. (2006) Hamann, W.-R., Gräfener, G., & Liermann, A. 2006, A&A, 457, 1015
- Howarth et al. (1997) Howarth, I. D., Siebert, K. W., Hussain, G. A. J., & Prinja, R. K. 1997, MNRAS, 284, 265
- Hubrig et al. (2015) Hubrig, S., Schöller, M., Kholtygin, A. F., et al. 2015, MNRAS, 447, 1885
- Jaskot et al. (2011) Jaskot, A. E., Strickland, D. K., Oey, M. S., Chu, Y.-H., & García-Segura, G. 2011, ApJ, 729, 28
- Mackey et al. (2015) Mackey, J., Gvaramadze, V. V., Mohamed, S., & Langer, N. 2015, A&A, 573, A10
- Maucherat & Vuillemin (1973) Maucherat, A., & Vuillemin, A. 1973, A&A, 23, 147
- Megier et al. (2009) Megier, A., Strobel, A., Galazutdinov, G. A., & Krełowski, J. 2009, A&A, 507, 833
- Mernier & Rauw (2013) Mernier, F., & Rauw, G. 2013, NewA, 20, 42
- Moore et al. (2002) Moore, B. D., Walter, D. K., Hester, J. J., et al. 2002, AJ, 124, 3313
- Nebot Gómez-Morán & Oskinova (2018) Nebot Gómez-Morán, A., & Oskinova, L. M. 2018, A&A, 620, A89
- Pallavicini et al. (1981) Pallavicini, R., Golub, L., Rosner, R., et al. 1981, ApJ, 248, 279
- Pittard (2013) Pittard, J. M. 2013, MNRAS, 435, 3600
- Prinja et al. (1990) Prinja, R. K., Barlow, M. J., & Howarth, I. D. 1990, ApJ, 361, 607
- Ramírez-Ballinas et al. (2019) Ramírez-Ballinas, I., Reyes-Iturbide, J., Toalá, J. A., et al. 2019, ApJ, 885, 116
- Rauw et al. (2003) Rauw, G., De Becker, M., & Vreux, J.-M. 2003, A&A, 399, 287
- Ruiz et al. (2013) Ruiz, N., Chu, Y.-H., Gruendl, R. A., et al. 2013, ApJ, 767, 35
- Sander et al. (2015) Sander, A., Shenar, T., Hainich, R., et al. 2015, A&A, 577, A13
- Seaton (1979) Seaton, M. J. 1979, MNRAS, 187, 73
- Shenar et al. (2015) Shenar, T., Oskinova, L., Hamann, W.-R., et al. 2015, ApJ, 809, 135
- Shenar et al. (2014) Shenar, T., Hamann, W.-R., & Todt, H. 2014, A&A, 562, A118
- Stock & Barlow (2010) Stock, D. J., & Barlow, M. J. 2010, MNRAS, 409, 1429
- Telting et al. (2014) Telting, J. H., Avila, G., Buchhave, L., et al. 2014, Astronomische Nachrichten, 335, 41
- Toalá & Arthur (2011) Toalá, J. A., & Arthur, S. J. 2011, ApJ, 737, 100
- Toalá & Arthur (2018) Toalá, J. A., & Arthur, S. J. 2018, MNRAS, 478, 1218
- Toalá et al. (2018) Toalá, J. A., Oskinova, L. M., Hamann, W.-R., et al. 2018, ApJ, 869, L11
- Toalá et al. (2017) Toalá, J. A., Marston, A. P., Guerrero, M. A., Chu, Y.-H., & Gruendl, R. A. 2017a, ApJ, 846, 76
- Toalá et al. (2017) Toalá, J. A., Oskinova, L. M., & Ignace, R. 2017b, ApJ, 838, L19
- Toalá et al. (2016a) Toalá, J. A., Guerrero, M. A., Chu, Y.-H., et al. 2016a, MNRAS, 456, 4305
- Toalá et al. (2016b) Toalá, J. A., Oskinova, L. M., González-Galán, A., et al. 2016b, ApJ, 821, 79
- Toalá et al. (2015) Toalá, J. A., Guerrero, M. A., Chu, Y.-H., & Gruendl, R. A. 2015, MNRAS, 446, 1083
- Toalá & Guerrero (2013) Toalá, J. A., & Guerrero, M. A. 2013, A&A, 559, A52
- Toalá et al. (2012) Toalá, J. A., Guerrero, M. A., Chu, Y.-H., et al. 2012, ApJ, 755, 77
- Toalá & Arthur (2011) Toalá, J. A., & Arthur, S. J. 2011, ApJ, 737, 100
- Tody (1993) Tody, D. 1993, Astronomical Data Analysis Software and Systems II, 173
- Townsley et al. (2014) Townsley, L. K., Broos, P. S., Garmire, G. P., et al. 2014, ApJS, 213, 1
- Weaver et al. (1977) Weaver, R., McCray, R., Castor, J., Shapiro, P., & Moore, R. 1977, ApJ, 218, 377