pnasresearcharticle \leadauthorTakatori \correspondingauthor1 To whom correspondence should be addressed: stakatori@ucsb.edu, kranthi@berkeley.edu
Motility-induced buckling and glassy dynamics regulate three-dimensional transitions of bacterial monolayers
Abstract
Many mature bacterial colonies and biofilms are complex three-dimensional (3D) structures. One key step in their developmental program is a transition from a two-dimensional (2D) monolayer into a 3D architecture. Despite the importance of controlling the growth of microbial colonies and biofilms in a variety of medical and industrial settings, the underlying physical mechanisms behind single-cell dynamics, collective behaviors of densely-packed cells, and 3D complex colony expansion remain largely unknown. In this work, we explore the mechanisms behind the 2D-to-3D transition of motile Pseudomonas aeruginosa colonies; we provide a new motility-induced, rate-dependent buckling mechanism for their out-of-plane growth. We find that swarming of motile bacterial colonies generate sustained in-plane flows. We show that the viscous shear stresses and dynamic pressures arising from these flows allow cells to overcome cell-substrate adhesion, leading to buckling of bacterial monolayers and growth into the third dimension. Modeling bacterial monolayers as 2D fluid films, we identify universal relationships that elucidate the competition between in-plane viscous stresses, pressure and cell-substrate adhesion. Furthermore, we show that bacterial monolayers can exhibit crossover from swarming to kinetically-arrested, glassy-like states above an onset density, resulting in distinct 2D-to-3D transition mechanisms. Combining experimental observations of P. aeruginosa colonies at single-cell resolution, molecular dynamics simulations of active systems, and theories of glassy dynamics and 2D fluid films, we develop a dynamical state diagram that predicts the state of the colony, and the mechanisms governing their 2D-to-3D transitions.
keywords:
biofilm growth motility (or swarming) buckling glassy dynamics bacterial monolayers active matterIntroduction
We address the rate-dependent, three-dimensional (3D) transitions in motile confluent bacterial monolayers using Pseudomonas aeruginosa as our model organism. P. aeruginosa is a gram-negative, rod-shaped, motile bacterium that can cause serious infections in humans with existing diseases or conditions, including cystic fibrosis and traumatic burns (1, 2, 3, 4, 5). Fiber-like motorized appendages called type-IV pili enable twitching motility and lead to complex swarming patterns on soft substrates (6, 7, 8, 9).
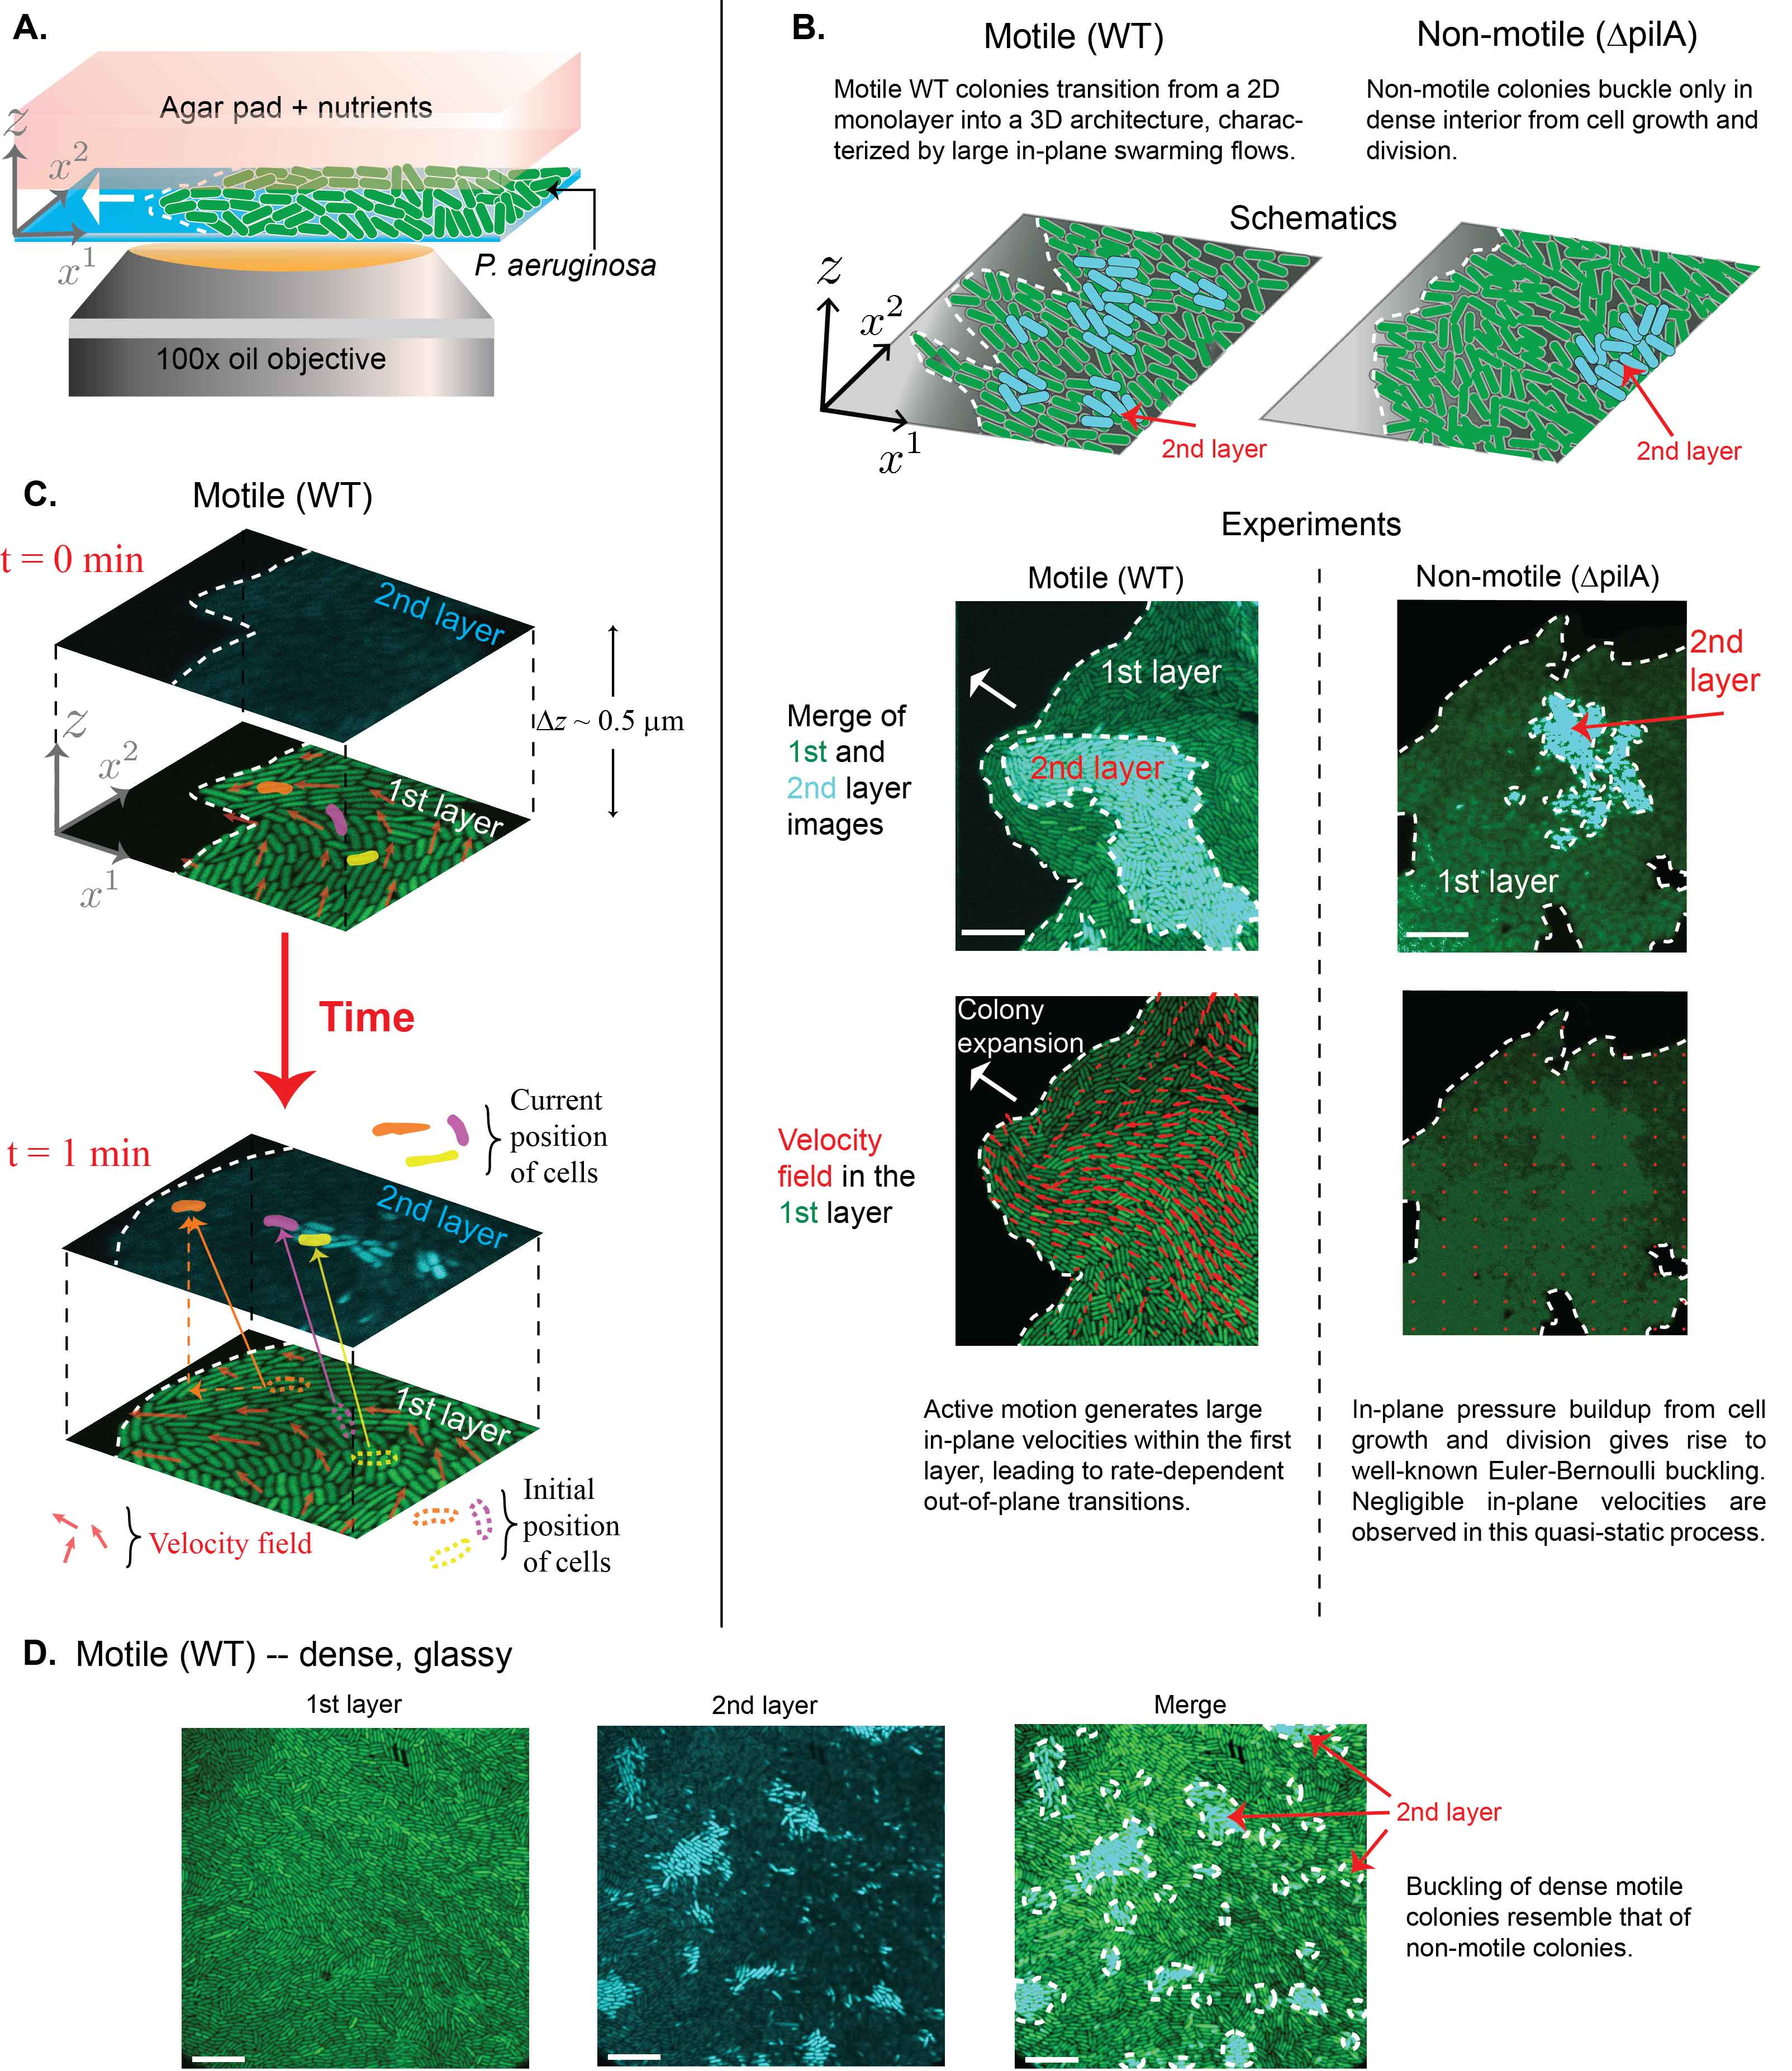
By performing an under-agar assay with P. aeruginosa strain PAO1 (see Fig. 1A and Methods), we follow the transition of cells from a 2D planar monolayer into 3D at single-cell resolution using confocal microscopy. Careful inspection of wild-type (WT) colonies revealed collective twitching motion in the swarming state, marked by characteristic in-plane flows (Fig. 1B), including linear flows like simple shear flow and nonlinear flows such as squeeze flow (see supplementary information (SI) movie S1). These flows were especially pronounced at the migrating front of the expanding colony. Interestingly, we observed out-of-plane transitions of individual cells from a 2D monolayer into the third dimension, and that these nucleation events coincided with the collective flows within the colony (see SI movies S1-S3 and Fig. 1B). Tracking the trajectories of several bacteria leading to a nucleation of a second layer (as shown in Fig. 1C) indicates that these active in-plane flows may be coupled to its out-of-plane transitions. These in-plane flows and nucleation events occur on time scales much smaller than cell growth and division.
In contrast, a non-motile mutant (pilA mutant) colony migrates slowly with no collective in-plane flows, and does not exhibit any out-of-plane transitions near the migrating edges of the colony (see SI movies S4-S5). Instead, we observe transitions into the third dimension only in the colony interiors (Fig. 1B). Furthermore, experiments of WT cells packed at very large cell density in Fig. 1D show that dense motile colonies can enter into a jammed, glassy-like state leading to kinetic arrest (see SI movies S6-S7). The 2D-to-3D transitions of these dense WT colonies resemble that of the non-motile strain with sudden nucleation events leading to out-of-plane growth again in the interior (see Fig. 1D). Nucleation of non-motile bacteria (10, 11, 12, 13, 14, 15, 16) and confluent mammalian tissues (17, 18) into the third dimension arise from a known phenomenon of buckling due to cell division and growth-induced stresses, and occurs on timescales much larger than the motility-induced transition events we observe in the WT strain in the swarming state, whose mechanisms remain yet unknown.
Taken together, these observations point to an interplay between cell density, active motility, and 3D growth of motile bacterial monolayers. Although it is now clear that such an interplay should exist, there are many unanswered fundamental questions: (i) What are the mechanisms involved in out-of-plane growth of a motile swarming colony; (ii) How does cell density and motility affect the state of the colony (i.e., swarming vs. glassy); and (iii) How does the state of the colony govern the 2D-to-3D transitions? By combining experiments, molecular dynamics simulations, and theories of glassy dynamics and fluid films, we set out to fundamentally understand the state of the bacterial colonies and provide novel mechanisms of out-of-plane colony growth.
Swarming vs. Glassy colonies
We begin by addressing the physical state of the bacterial colony at a collective level as a function of cell density. As observed experimentally in Fig. 1D, upon increasing cell density, we find that the motile colonies undergo a crossover from a state of swarming to a state marked by a dramatic slow down in their dynamics specifically in their cellular displacements. In particular, colonies prepared at high densities resemble that of disordered glassy states in supercompressed colloidal or supercooled molecular systems (19, 20, 21, 22, 23, 24) (see SI movie S8). It is well-known that glassy colloidal systems at high densities, or molecular systems at low temperatures, exhibit dynamic heterogeneity (25, 22, 20, 26, 27), i.e., intermittent motions in particle displacements and spatial correlations in the mobility of individual particles when observed over a small period of time. This is in contrast to a low-density colloidal fluid, or a high-temperature molecular liquid, where the dynamics is homogeneous and uniform.
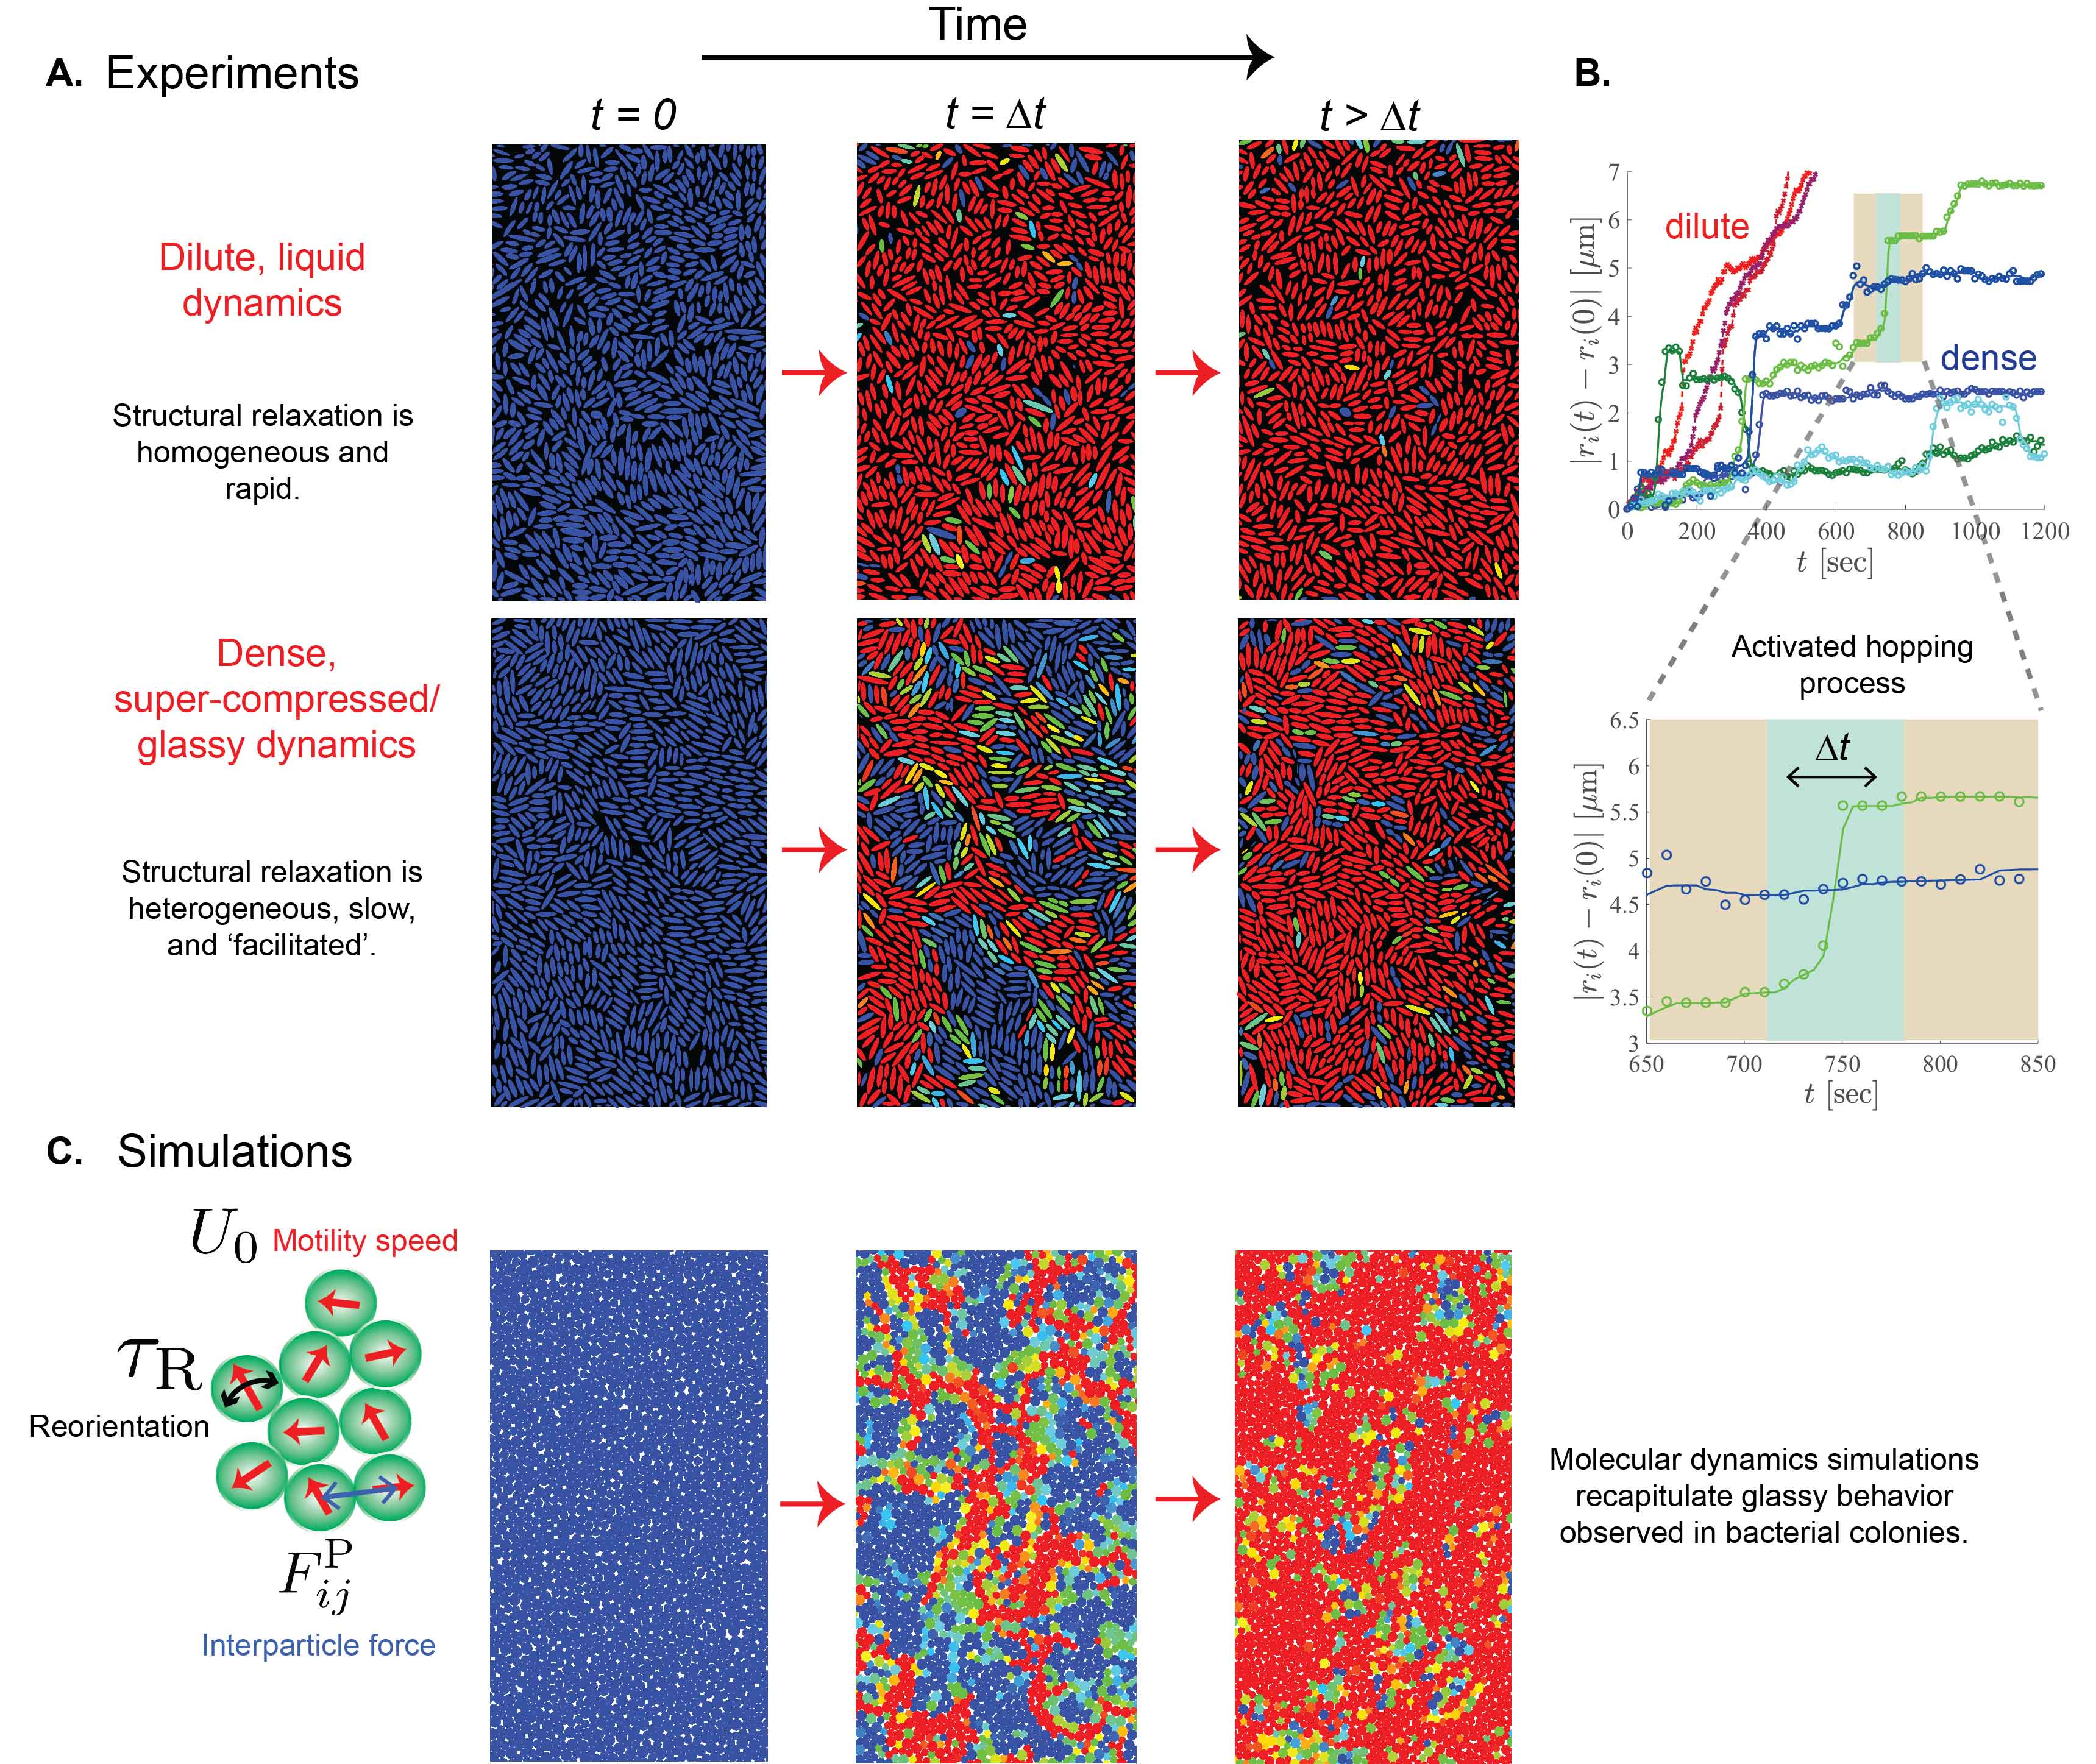
Figure 2A shows experimental trajectories of the bacterial monolayer at sufficiently low and high density, color coded by displacements of particles based on body length. At low density, it can be seen that dynamics in the monolayer is spatially homogeneous where most of the bacteria displace by a body length over a small period of time . However, at high density there exist spatially distinct mobile and immobile regions, thus exhibiting dynamical heterogeneity (25, 22, 20, 27). Emergence of dynamic heterogeneity can also be seen in the displacement of individual bacteria in Fig. 2B. Here, one can see continuous motion of bacteria at sufficiently low densities resembling that of a liquid, while bacteria at high densities exhibit hopping events similar to that of a colloidal or molecular glass, thus making the bacterial monolayer an active, glassy colloidal system. The time scale , referred to as an “instanton time”, is defined as the time taken by a particle to make significant displacement from its current location (20), as shown in Fig. 2B. This kind of slowdown leading to dynamical arrest and dynamic heterogeneity upon increasing density has also been observed in other living systems such as confluent mammalian monolayers (28, 29, 30).
When a glass-forming molecular liquid is cooled below an “onset” temperature, its relaxation time, defined as the time decay of the density fluctuations, changes from being Arrhenius to super-Arrhenius with regards to temperature (31, 32, 33, 34, 20, 35). Analogously, when colloidal systems are compressed above an “onset” pressure , their relaxation also exhibits a crossover from being “Arrhenius”, i.e., exponentially dependent on pressure, to being “super-Arrhenius” in pressure (36). There exist different perspectives to describe glassy dynamics which explain the significant slow down in the relaxation times as a function of temperature or pressure (37). In this work, we use the perspective of dynamical facilitation (DF) theory (19, 35, 20) to characterize the active glassy dynamics of motile bacterial colonies, and the crossover from swarming to glassy state. DF theory has been successful in predicting the relaxation behaviors of systems including molecular liquids (32), mixtures of glass forming super-cooled liquids (38), atomistic systems containing binary mixtures of particles (20), and binary hard-disc systems in two-dimensions (36). DF theory fundamentally takes into account the dynamical heterogeneity in terms of spatial heterogeneities, also referred to as “excitations” or “soft-spots”, which represent mobile regions observed in an instanton time . These excitations then facilitate the motion of nearby regions in a hierarchical manner, leading to a super-Arrhenius “parabolic” form for the relaxation time as a function of pressure , i.e., , where is a system dependent energy scale, and is the onset pressure (36, 20). See SI Chap. II.1 for a detailed description of the DF theory for passive systems.
To characterize the dynamic heterogeneity and to extend the applicability of DF theory for bacterial monolayers, we created a molecular model containing bi-disperse hard disks based on the “active” Brownian particle model, a paradigmatic model commonly studied in the emergent field of active matter (39, 40, 41, 42, 43). Briefly, the model considers a suspension of self-propelled disks of diameter that translate with a swimming velocity , and their direction of motion is subject to rotational diffusion characterized by a reorientation time . We defined a nondimensional Péclet number as , which is a ratio of the run length of the particle over its size. Unlike experiments on real colonies, molecular simulations enable careful control over packing fraction and activity parameter , and thus are well-suited to test and extend the applicability of DF theory to active colloidal systems and therefore to bacterial colonies. Figure 2C shows dynamical heterogeneity in our active molecular models at high area fractions , that exemplify the behaviors of motile bacterial colonies at high densities (shown in Fig. 2A; also see SI movie S9). This shows that our active molecular models are reasonable representations of real bacterial colonies in their glassy states. Extending the DF theory to the case of active systems yields the relaxation time of the system to be
| (1) | ||||
| (2) |
where is the relaxation time at the onset pressure, and the quantities , and depend on the activity ; see SI Chap. II.2.1 for a detailed analysis of the extension of the DF theory to active glassy systems.
To verify the predictions from Eqs. (1)-(2), we estimate the relaxation times in the molecular model for various activities by studying the time decay of the density correlations described by the dynamic strucure factor
| (3) |
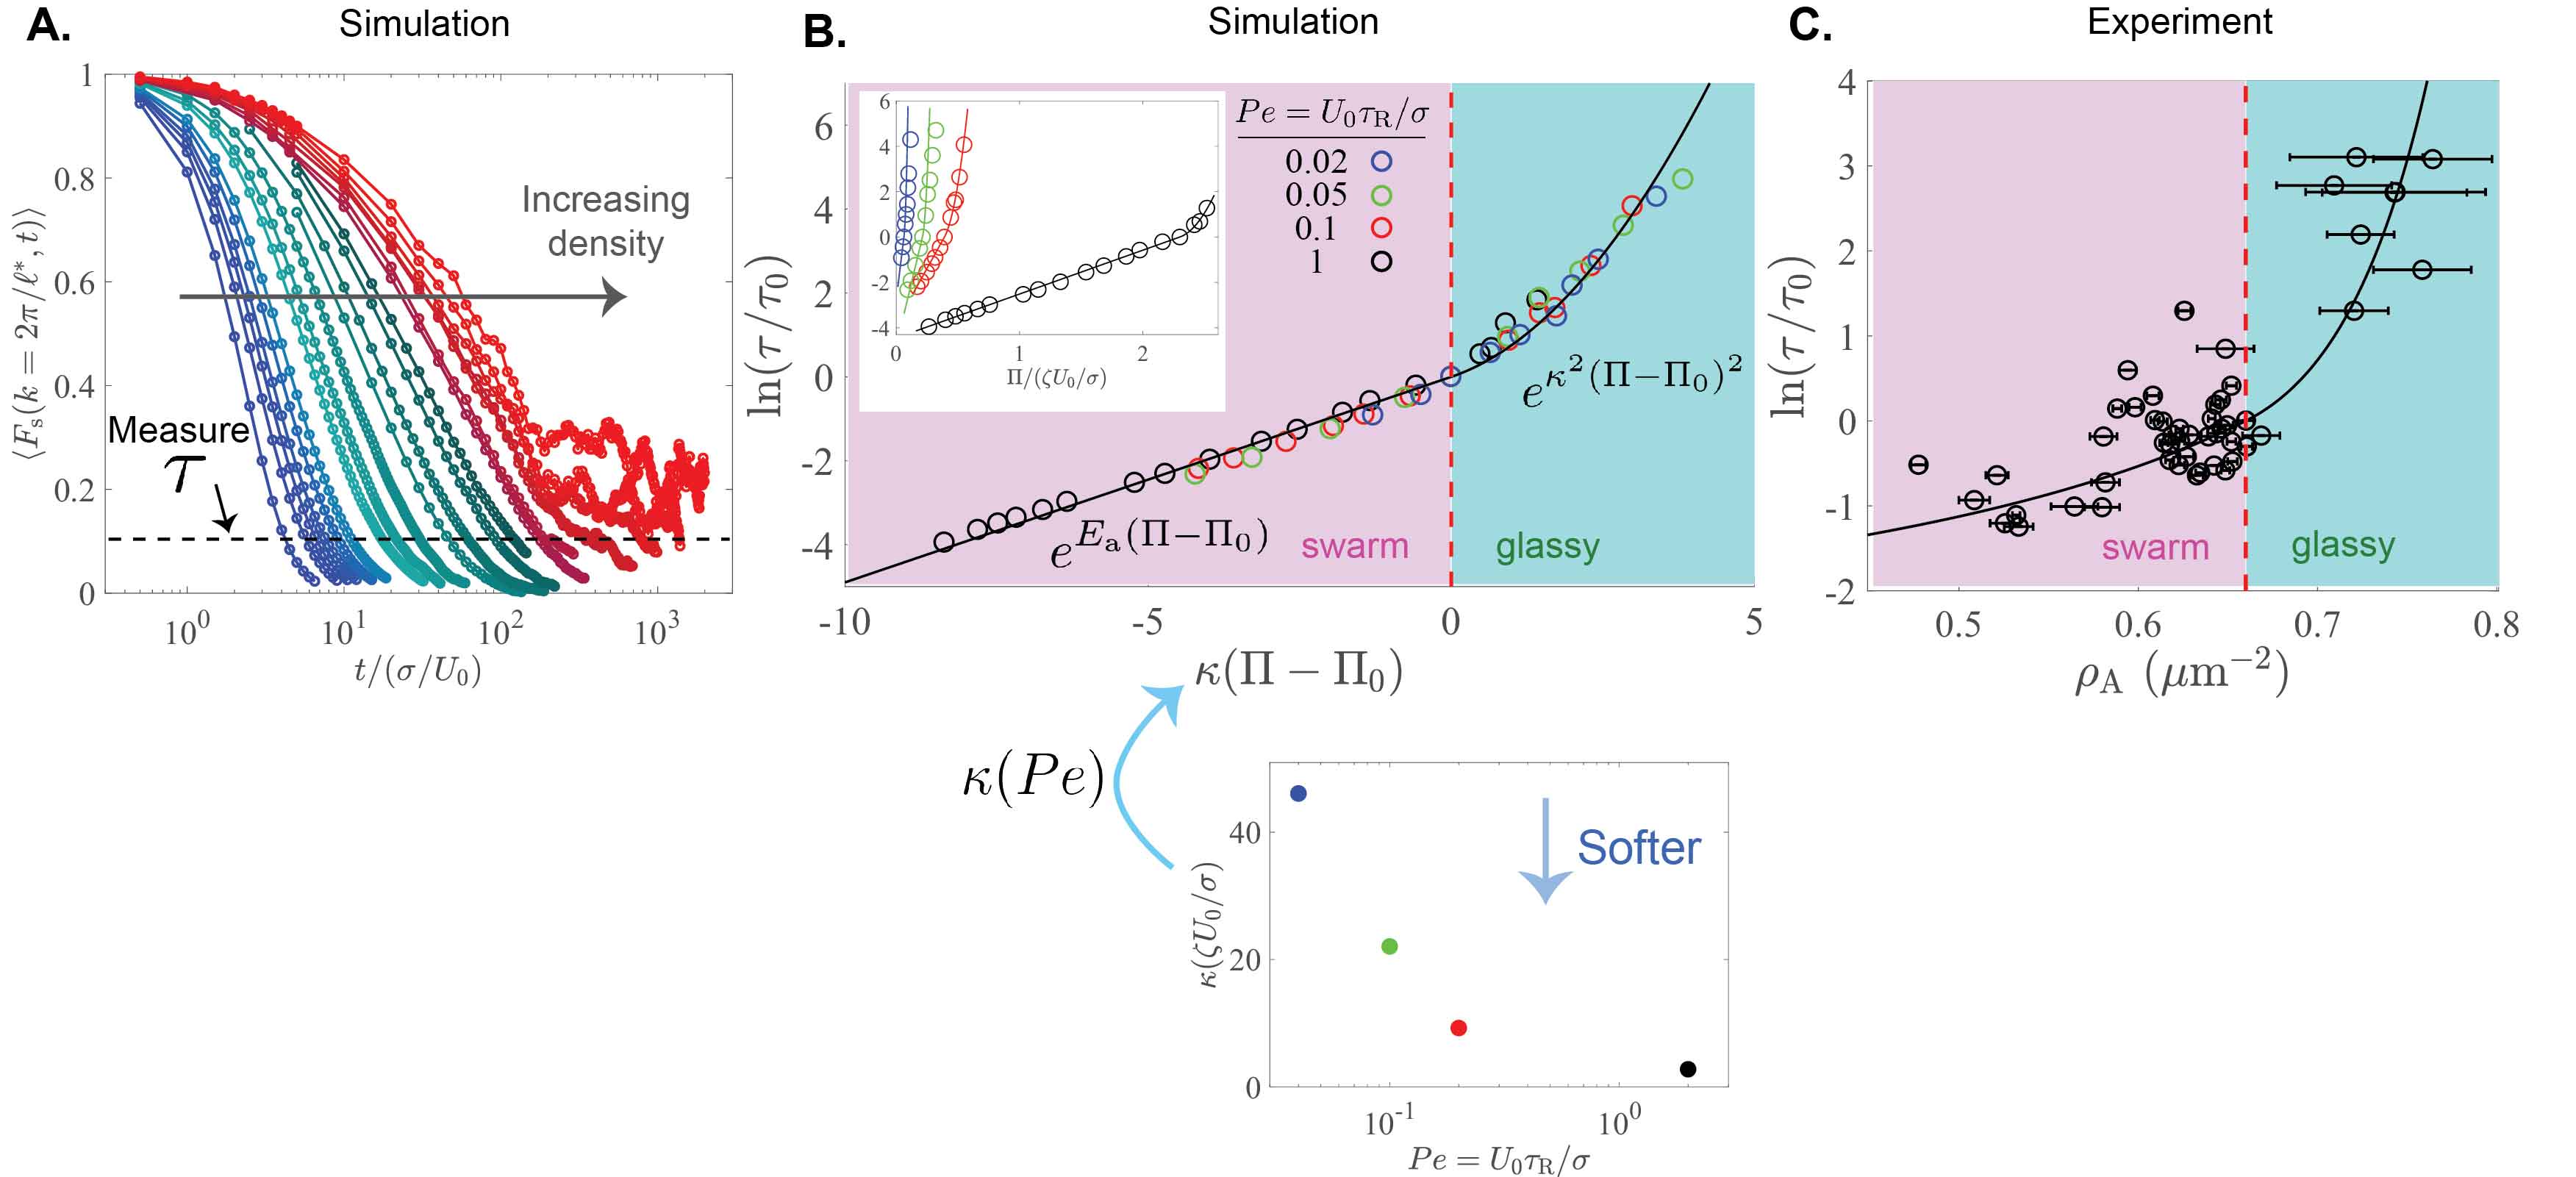
Here, is the wave-vector corresponding to the peak of the static structure factor, and denotes an ensemble average. Figure 3A shows for various fractions , and therefore various pressures , for a given activity . It shows that the long time decay of the correlation functions changes from being exponential at low fractions to stretched exponential at high fractions, resembling the dynamical correlation functions in standard glassy systems (34, 44, 45). Furthermore, defining the relaxation time as the time scale for the decay of to a value of , we find a remarkable crossover from an “Arrhenius” dependence on at low pressures to a “super-Arrhenius” dependence above the onset pressure (see Fig. 3B). Figure 3B also shows that the parabolic form in (1) is in excellent agreement with the relaxation times obtained from above the onset pressure for various , thus demonstrating the universal features of glassy dynamics at all activities. Note that , characterizing the energy scale associated with glassy dynamics, in the parabolic form is not a fit to the data, but rather predicted from microscopic calculations of energy barriers associated with excitations (see SI Chap. II.2.1).
Molecular models of active Brownian disks provide an excellent system for extension of the theory of glassy dynamics to active colloidal systems. However, the active liquid state in these systems below the onset density does not result in a swarming state consisting of flocks as observed in experiments of bacterial colonies, though there exist significant similarities in the glassy state. This is due to the lack of alignment interactions, which are required to stabilize flocking behaviors (46, 47, 48, 49). To this end, we extend our studies to systems consisting of active 2D polydisperse spherocylinders, with polydispersity representative of P. aeruginosa colonies (see SI Chap. II.3.2). In this case, there exist alignment interactions between individual spherocylinders and we find that the system exists in a swarming state below the onset density, and again exhibits a crossover into a glassy state above the onset density (see SI Fig. 2.15). We further extend the DF theory to polydisperse spherocylinder systems, and show that Eqs. (1) and (2) accurately represent the relaxation behaviors.
Motivated by the success of the extended DF theory to active Brownian disks and polydisperse spherocylinder systems, we now study its applicability to P. aeruginosa colonies. To this end, we calculate the dynamic structure factor at multiple densities using (3) by tracking the trajectories of individual bacteria in the colony using confocal microscopy (see Methods). Relaxation times collected from P. aeruginosa colonies at different densities again exhibit a similar crossover from swarming to glassy states, as shown in Fig. 3C. Furthermore, relaxation time behaviors of the colonies above the onset density can be quantitatively explained using the parabolic form (2) (SI Chap. II.4). Taken together, Figs. 3B and 3C exhibit a dynamical state diagram that determines the state of the colony (swarming vs. glassy) as a function of motility strength and cell density. If cell densities are less than the onset density, and therefore less than the corresponding onset pressure , the system exists in a swarming state, where transitions into 3D appear to be correlated with active in-plane flows (Figs. 1B and 1C). If above the onset pressure, the bacterial monolayer enters into an arrested super-compressed or glassy state, and the out-of-plane mechanism resembles the colonies of a non-motile mutant strain (Figs. 1B and 1D). The onset pressure thus plays a significant role in regulating the mechanism by which bacterial monolayers transition out of plane.
Motility-induced buckling of swarming colonies
Having established a connection between cell density and the state of the colony (swarming vs. glassy in Figs. 3B and 3C), we now consider the mechanisms leading to 3D growth of bacterial monolayers. Bacteria secrete extracellular polymeric substances that generate cell-substrate adhesion which keeps the monolayer stable against small perturbations. Sufficiently large destabilizing forces can overcome these adhesive forces and induce a 3D transition. Above the onset cell density, bacteria enter into a glassy state with no significant flows within the monolayer. Here, the cell concentration increases slowly from division and growth, which generate larger in-plane interparticle stresses and induce buckling at a critical stress, similar to the classic Euler-Bernoulli beam bending instability, as observed previously (10, 11, 12, 13, 14, 15, 16). As mentioned before, the characteristic timescale of buckling is significantly larger in the glassy state than in the swarming state; in fact, buckling can be described as quasi-static in the glassy state and for non-motile colonies. However, transitions into 3D in the swarming state below the onset density as observed in Fig. 1 have not been addressed, and their mechanisms are yet to be discovered, which we address below.
An inspection of the swarming state of the monolayer shows a variety of motility induced in-plane flows resembling a 2D fluid, including linear flows such as simple shear, rotational, compressional and extensional flows, and nonlinear flows such as squeeze flows (see Fig. 1B and SI movies S1-S3). In this case, the motility-induced velocity gradients can lead to in-plane shear stresses that destabilize the monolayer. The ability of these in plane flows and the resulting fluid stresses leading to out-of-plane transitions can be understood by analyzing the following simple scenario. Let us consider a uniform velocity gradient that results in a simple shearing flow, i.e., Couette flow (50, 51). In Couette flow, the spatial gradient in velocity is determined by a shear strain rate , which gives rise to compression and extension along two principal axes. For sufficiently large , the forces along the compressional axis may enable the bacteria to overcome substrate adhesion forces, causing an out-of-plane deformation of the monolayer leading to “buckling”, and thus nucleating the transition into the third dimension.
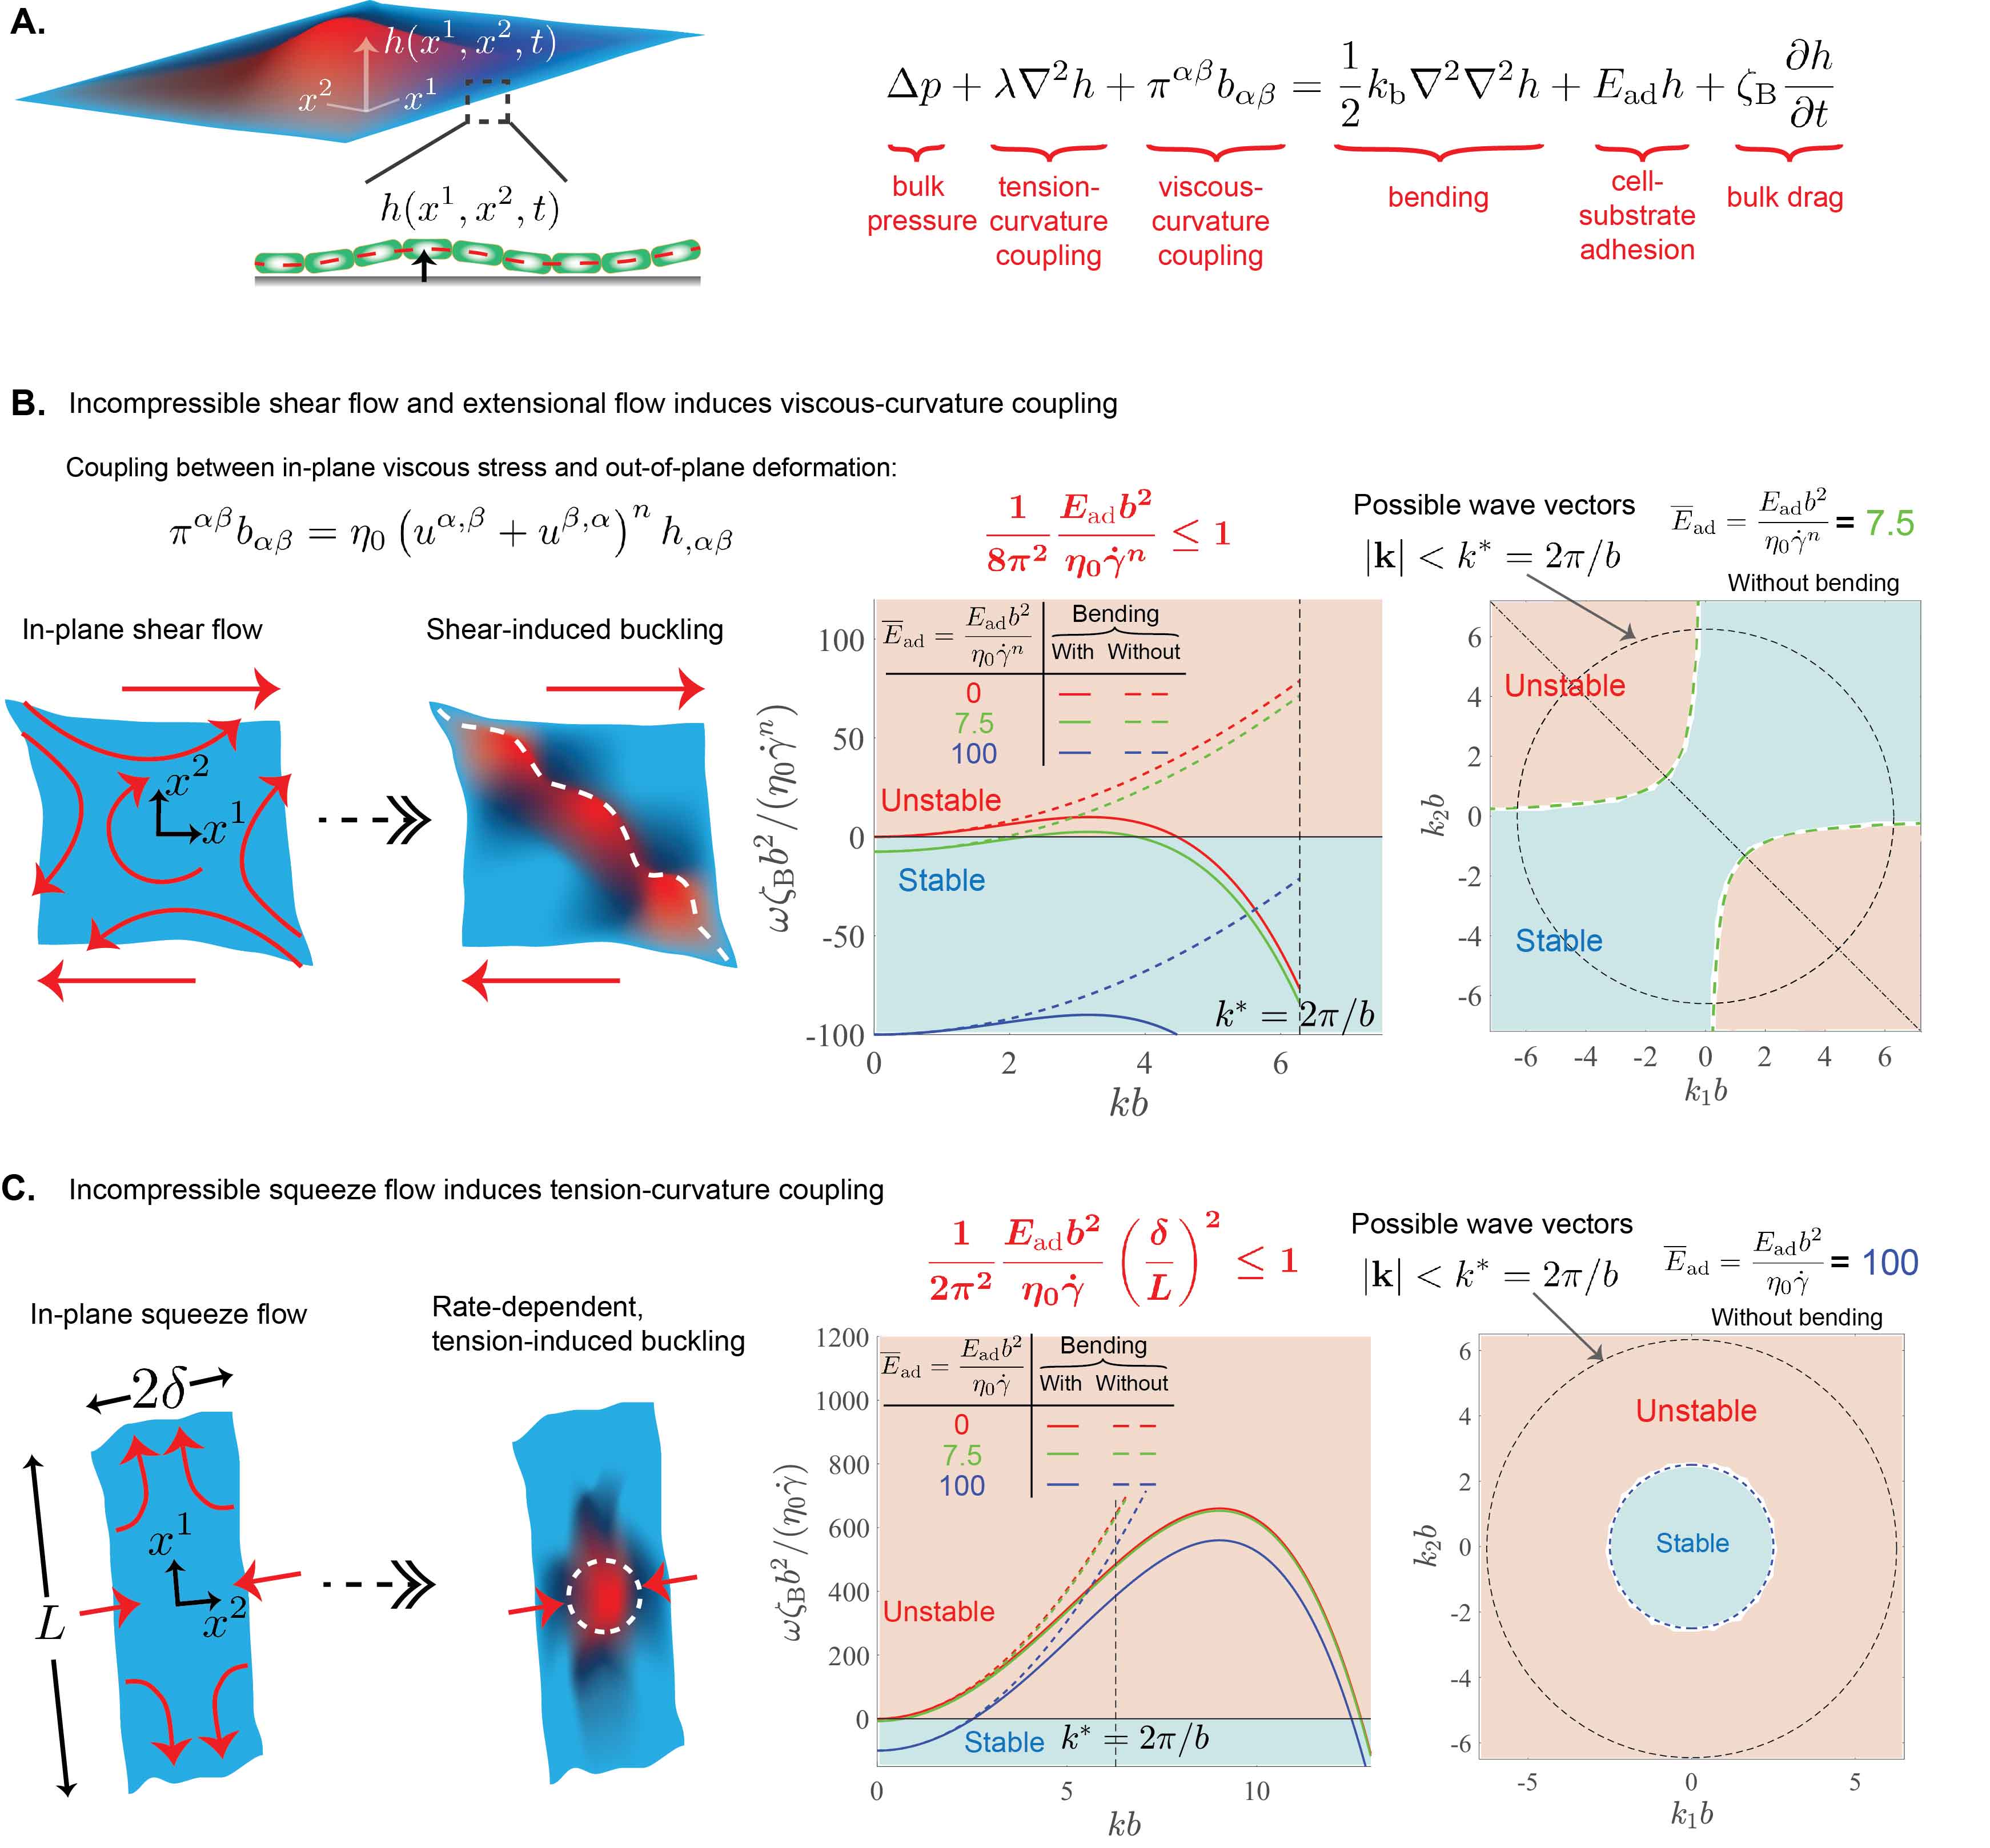
The coupling between motility induced in-plane flows and out-of-plane deformations of the monolayer, and the onset of buckling, can be quantitatively analyzed by considering the monolayer as a 2D sheet, which can deform out-of-plane (see Fig. 4A and SI Chap. III). Such couplings are common in other biological processes, in particular processes involving lipid bilayers (52, 53, 54, 55) and biological membranes (53), which generally behavior as a fluid in plane and deform elastically in bending. Inspired by the 2D theoretical framework involved in modeling lipid bilayers (55, 54, 56), we can write the out-of-plane equation of motion governing the height of a fluid sheet connecting the mid-plane of bacteria subjected to various competing forces (Fig. 4A) as
| (4) |
see SI Chap. III for a detailed derivation of the theory of 2D deformable fluid sheets. In (4), is the bulk pressure acting on the monolayer, is the in-plane tension, are the in-plane viscous stresses, is the curvature tensor, is the bending modulus, is the strength of adhesion of the monolayer with respect to the substrate and denotes a drag on the monolayer.
Using the spherocylinder polydisperse system as appropriate for bacterial monolayers, the rheological behavior of the monolayer is found to be that of a non-Newtonian fluid (see SI Chap. III.4.1). In this case, the in-plane viscous stresses in (4) are given by the non-Newtonian “power law” fluid constitutive equation (50), , where denote in-plane velocity gradients, is an effective viscosity, and is the power. This constitutive equation is particularly relevant for incompressible flows where , but we have also considered the case of compressible flows which will be discussed later. Equation (4) is an extension of the Young-Laplace equation (51) used to describe fluid films, but allows for additional mechanisms related to coupling of intra-membrane viscous flow and curvature , and cell-substrate adhesion that are relevant for understanding the growth of bacterial monolayers into the third dimension.
We now proceed to analyze the mechanisms and quantitative aspects of nucleation of colonies into the third dimension. In what follows, we begin by considering special cases of linear (uniform shear) and non-linear (squeeze) in-plane incompressible flows, linear compressible flows, and show how motility-induced flows lead to rate-dependent buckling instabilities. These special cases allow for exact analytical solutions, elucidate the physical mechanisms of out-of-plane transitions, and are further amenable to testing in both molecular simulations and experiments.
Incompressible linear flows
We begin with uniform linear incompressible shear flows, i.e., Couette flows given by in-plane velocity gradients (see Fig. 4B). The case of shear flow is particularly suitable for testing in molecular simulations, and plays a crucial role to interrogate our hypothesis of motility-induced buckling. In this case, we assume that the in-plane tension is negligible, i.e., . Such a 2D flow corresponds to positive and negative eigenvalues, and , along two principal directions corresponding to the extensional and compressional axes, respectively. This indicates that the bacteria may buckle along the compressional axis for large . To test this hypothesis, we perform linear stability analysis of (4) in terms of Fourier representation for the height, i.e., , where is the Fourier component and is the wave-vector, and is the frequency (see SI Chap. III.3). Note that indicates an unstable out-of-plane deformation, which ultimately leads to buckling of the surface. Figure 4B shows the dispersion curves in the presence and absence of bending for various values of a non-dimensional parameter , which describes the ratio of adhesive forces to viscous forces in Eq. (4) with being the bacterial length. As can be seen in Fig. 4B, when is high, for all wave-vectors, indicating that adhesive forces dominate the viscous-curvature coupling forces, and the monolayer is stable. However, for sufficiently low , i.e., when motility-induced viscous stresses are large, there exist wave-vectors where , which lead to buckling, and subsequent growth of the monolayer into the third dimension.
In the absence of bending stiffness, the dispersion relation is given by , which shows that unstable modes are possible whenever (Fig. 4B). Moreover, growth rate increases monotonically with wave-vector, so the fastest growth of deformation occurs at a wave-vector corresponding to the smallest length scale in the system—an individual bacterial size—indicating that buckling occurs at the level of individual bacteria. This remarkable prediction is consistent with both our experiments and molecular simulations showing individual bacteria popping out into the third dimension in a spatially heterogeneous manner, as opposed to rafts of bacteria delaminating from the monolayer. Note that strong cell-cell adhesion can introduce a finite bending stiffness, which introduces a fourth-order stabilizing term, , leading to a maximum growth rate at intermediate wave-vectors. This can lead to rafts of bacteria that buckle like an elastic sheet as opposed to our experimental studies. We leave this possibility to future work.
In summary, our linear stability analysis of shear flows (see SI Chap. III.3.2) dictates that buckling occurs whenever
| (5) |
indicating that growth into 3D occurs when adhesive and viscous-curvature coupling forces are comparable. We further analyzed other linear flows such as uniform rotational, and incompressible extensional flows (see SI Chap. III.3), and find that rotational flows do not lead to any buckling instabilities. The latter case of incompressible extensional flows is similar to that of the shear flows with identical dispersion curves, and therefore similar mechanisms of buckling.
Incompressible non-linear flows
In what follows, we consider a special case of incompressible nonlinear flow, hereinafter, referred to as the squeeze flow. In this case, we assume that the general constitutive behavior of the compressible fluid is that of a Newtonian fluid instead of a non-Newtonian fluid as considered previously for linear incompressible flows. Such a simplification allows for the possibility of analytical solutions demonstrating the role of non-uniform flows without altering the nature of the physical mechanisms leading to buckling. For an incompressible Newtonian fluid, the viscous stresses are given by , where is the Newtonian shear viscosity. In a natural swarm, it is possible that there exist two sufficiently large motile flocks of bacteria with mean velocity of a length scale travel towards each other, but can only disperse in a constricted manner in a gap in the orthogonal direction where ; see Fig. 4C for a schematic description. Such a scenario corresponds to a rate of squeezing . This generates compressive forces in the center of the squeeze flow region (see SI Chap. III.3.4), which again leads to buckling and nucleation of growth in the third dimension. This build up of the compressive stresses is simply due to inability of bacteria to escape through the constricted region quickly enough.
Using lubrication theory in fluid systems for analyzing squeeze flows (51) and performing the linear stability analysis yields dispersion curves shown in Fig. 4C (see SI Chap. III.3.4 for details). There exists one significant difference between the linear shear and non-linear squeeze flows. In the case of shear flows, buckling and growth in third dimension is a result of the competition between shear stresses and adhesive forces. However, for squeeze flows in a thin gap, the effects from negative tension dominate the viscous stresses by a factor of . This is reflected in the dispersion curves (Fig. 4C), where even for high values of when the monolayers are stable under linear shear flows (Fig. 4B), there exist for squeeze flows leading to buckling of the monolayer. In this case, the linear stability analysis (see SI Chap. III.3.4) dictates that buckling occurs whenever
| (6) |
i.e., when the adhesive forces and the flow induced compressive (or negative tensile) forces resulting from squeezing effects are comparable in (4). This case explicitly demonstrates the role of rate-dependent tension-curvature mediated instability, where in-plane flows result in gradients of tension. Such gradients in tension are dependent on flow characteristics and therefore are again motility induced. Note that the growth rate grows monotonically with wave-vector, as in the case of shear flows, leading again to buckling at the level of individual bacteria (Fig. 4C).
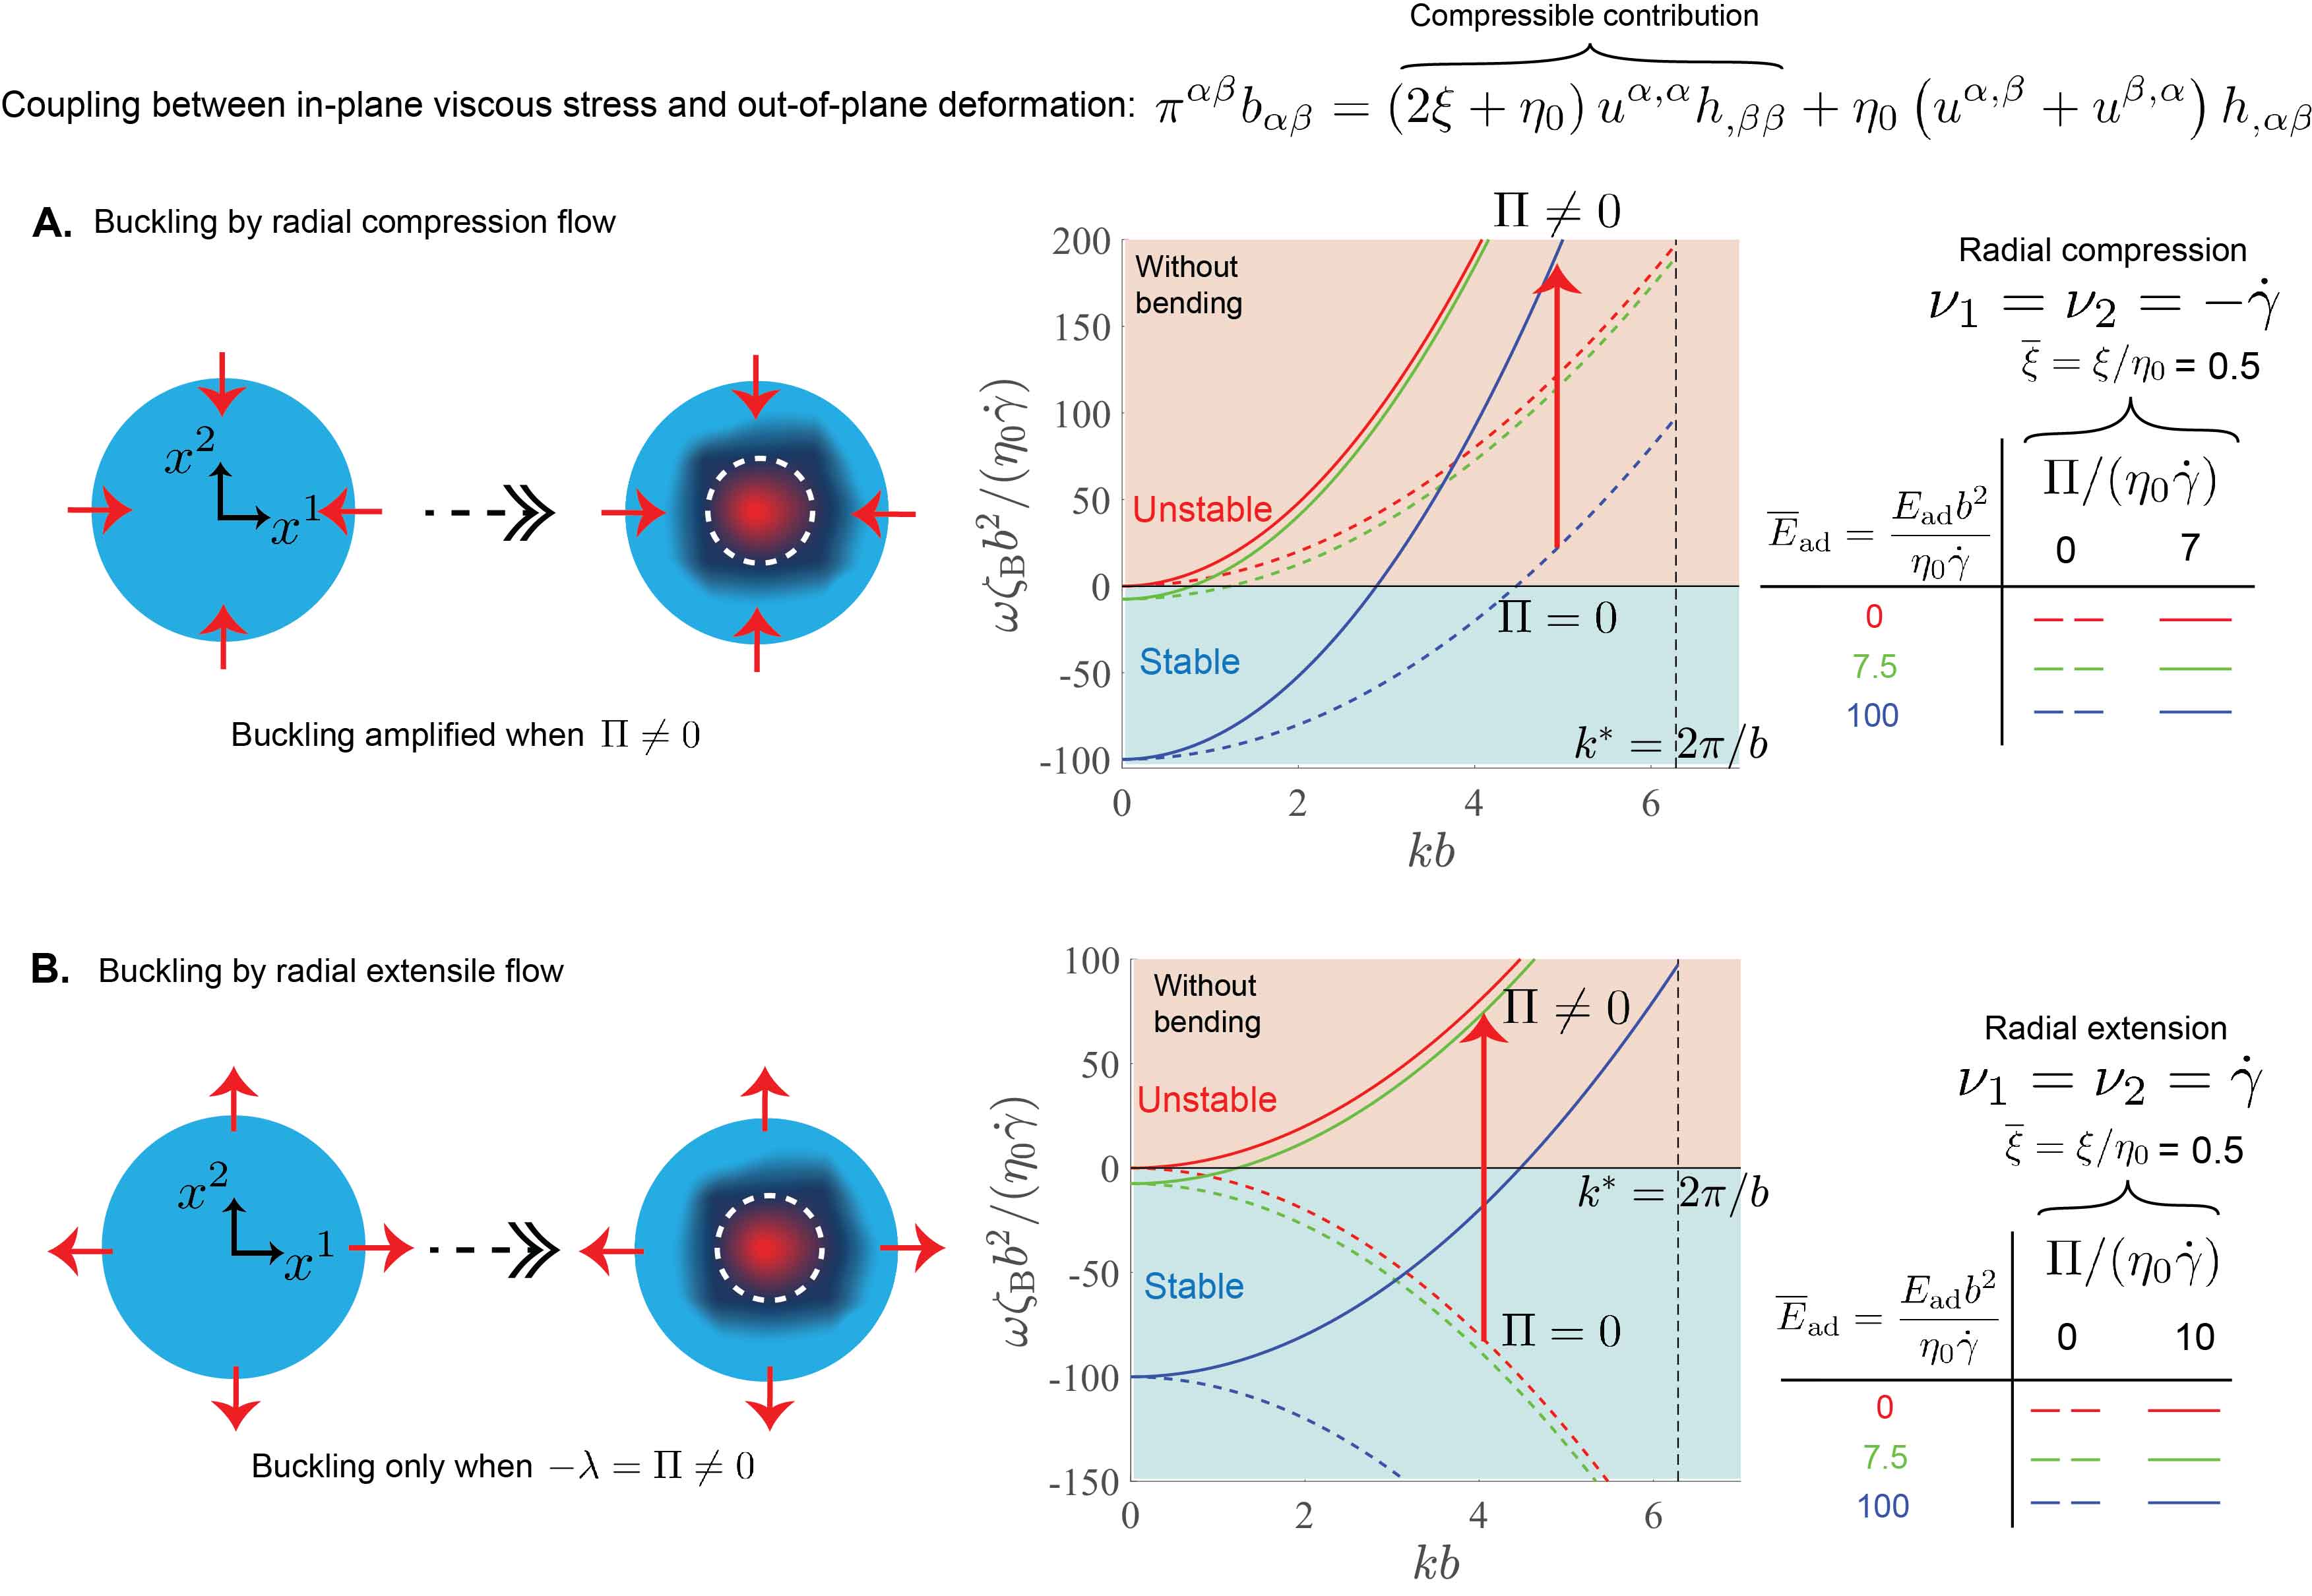
Compressible linear flows
We now study buckling instabilities arising from compressible flows by considering uniform velocity gradients of the type (see SI Chap. III.3.5 for a detailed analysis). The case of corresponds to compressible flows, while represents strictly incompressible flows as analyzed previously. Since and are also the eigenvalues along the two principal directions and need not be equal, this choice of the velocity gradient includes all of the aforementioned uniform linear flows including incompressible shear, rotational and extensional flows. When considering compressible flows, the in-plane viscous stresses will also contain additional contributions from bulk viscosity. Here again, we assume that the general constitutive behavior of the compressible fluid is that of a Newtonian fluid, which allows us to obtain simple analytical solutions that capture the role of compressible flows and bulk viscosity in buckling. The viscous stresses for a compressible Newtonian fluid are given by , where and are the shear and bulk viscosities. This modifies the viscous-curvature coupling term in (4) with an additional contribution from the bulk viscosity (see Fig. 5). To understand the buckling mechanisms arising from strictly compressible flows, we analyze two special cases corresponding to radially symmetric compression () and extensile () flows. We also analyze various cases of base tension , where the base pressure is a function of activity and can be non-zero for large activities. Specifically, we find that the pressure increases with (see SI Fig. 2.18) and plays a significant role in influencing the nature of the buckling mechanisms, particularly for extensile flows.
Figure 5A shows the dispersion curves arising from a linear stability analysis of the radial compression flow () for different base pressures and adhesion strengths (see SI Chap. III.3.5). They are qualitatively similar to the case of uniform shear and non-uniform squeeze flows, where again increases monotonically with wave-vector leading to buckling at the length scale of individual bacteria. However, the fluid sheet buckles at even large adhesion strengths in comparison to shear flows (see Fig 4B). Furthermore, Fig 5B shows that increasing the base pressure , corresponding to an increase in activity , amplifies the buckling instability and makes the fluid sheet unstable to larger adhesion strengths compared to the case . In summary, the linear stability analysis dictates that buckling occurs whenever
| (7) |
where denotes the ratio of shear and bulk viscosities.
We now consider radial extensile flows of the type . Linear stability analysis yields the dispersion curves shown in Figure 5B for different pressures and adhesion strengths (see SI Chap. III.3.5). In this case, it can be seen that when there exists no base pressure, i.e. , the extensile flows are always stable as expected. However, when is large, the growth rate becomes positive leading to buckling even under extensile flows. The condition for which buckling occurs in the extensile case is given by
| (8) |
Using (8), one can also see that the maximum extensile flow below which buckling one can observe buckling is given by
| (9) |
As we will show later, this counter intuitive condition of buckling under extensile flows is relevant in situations at higher activities and also in our experiments of P. aeruginosa colonies.
Molecular simulations
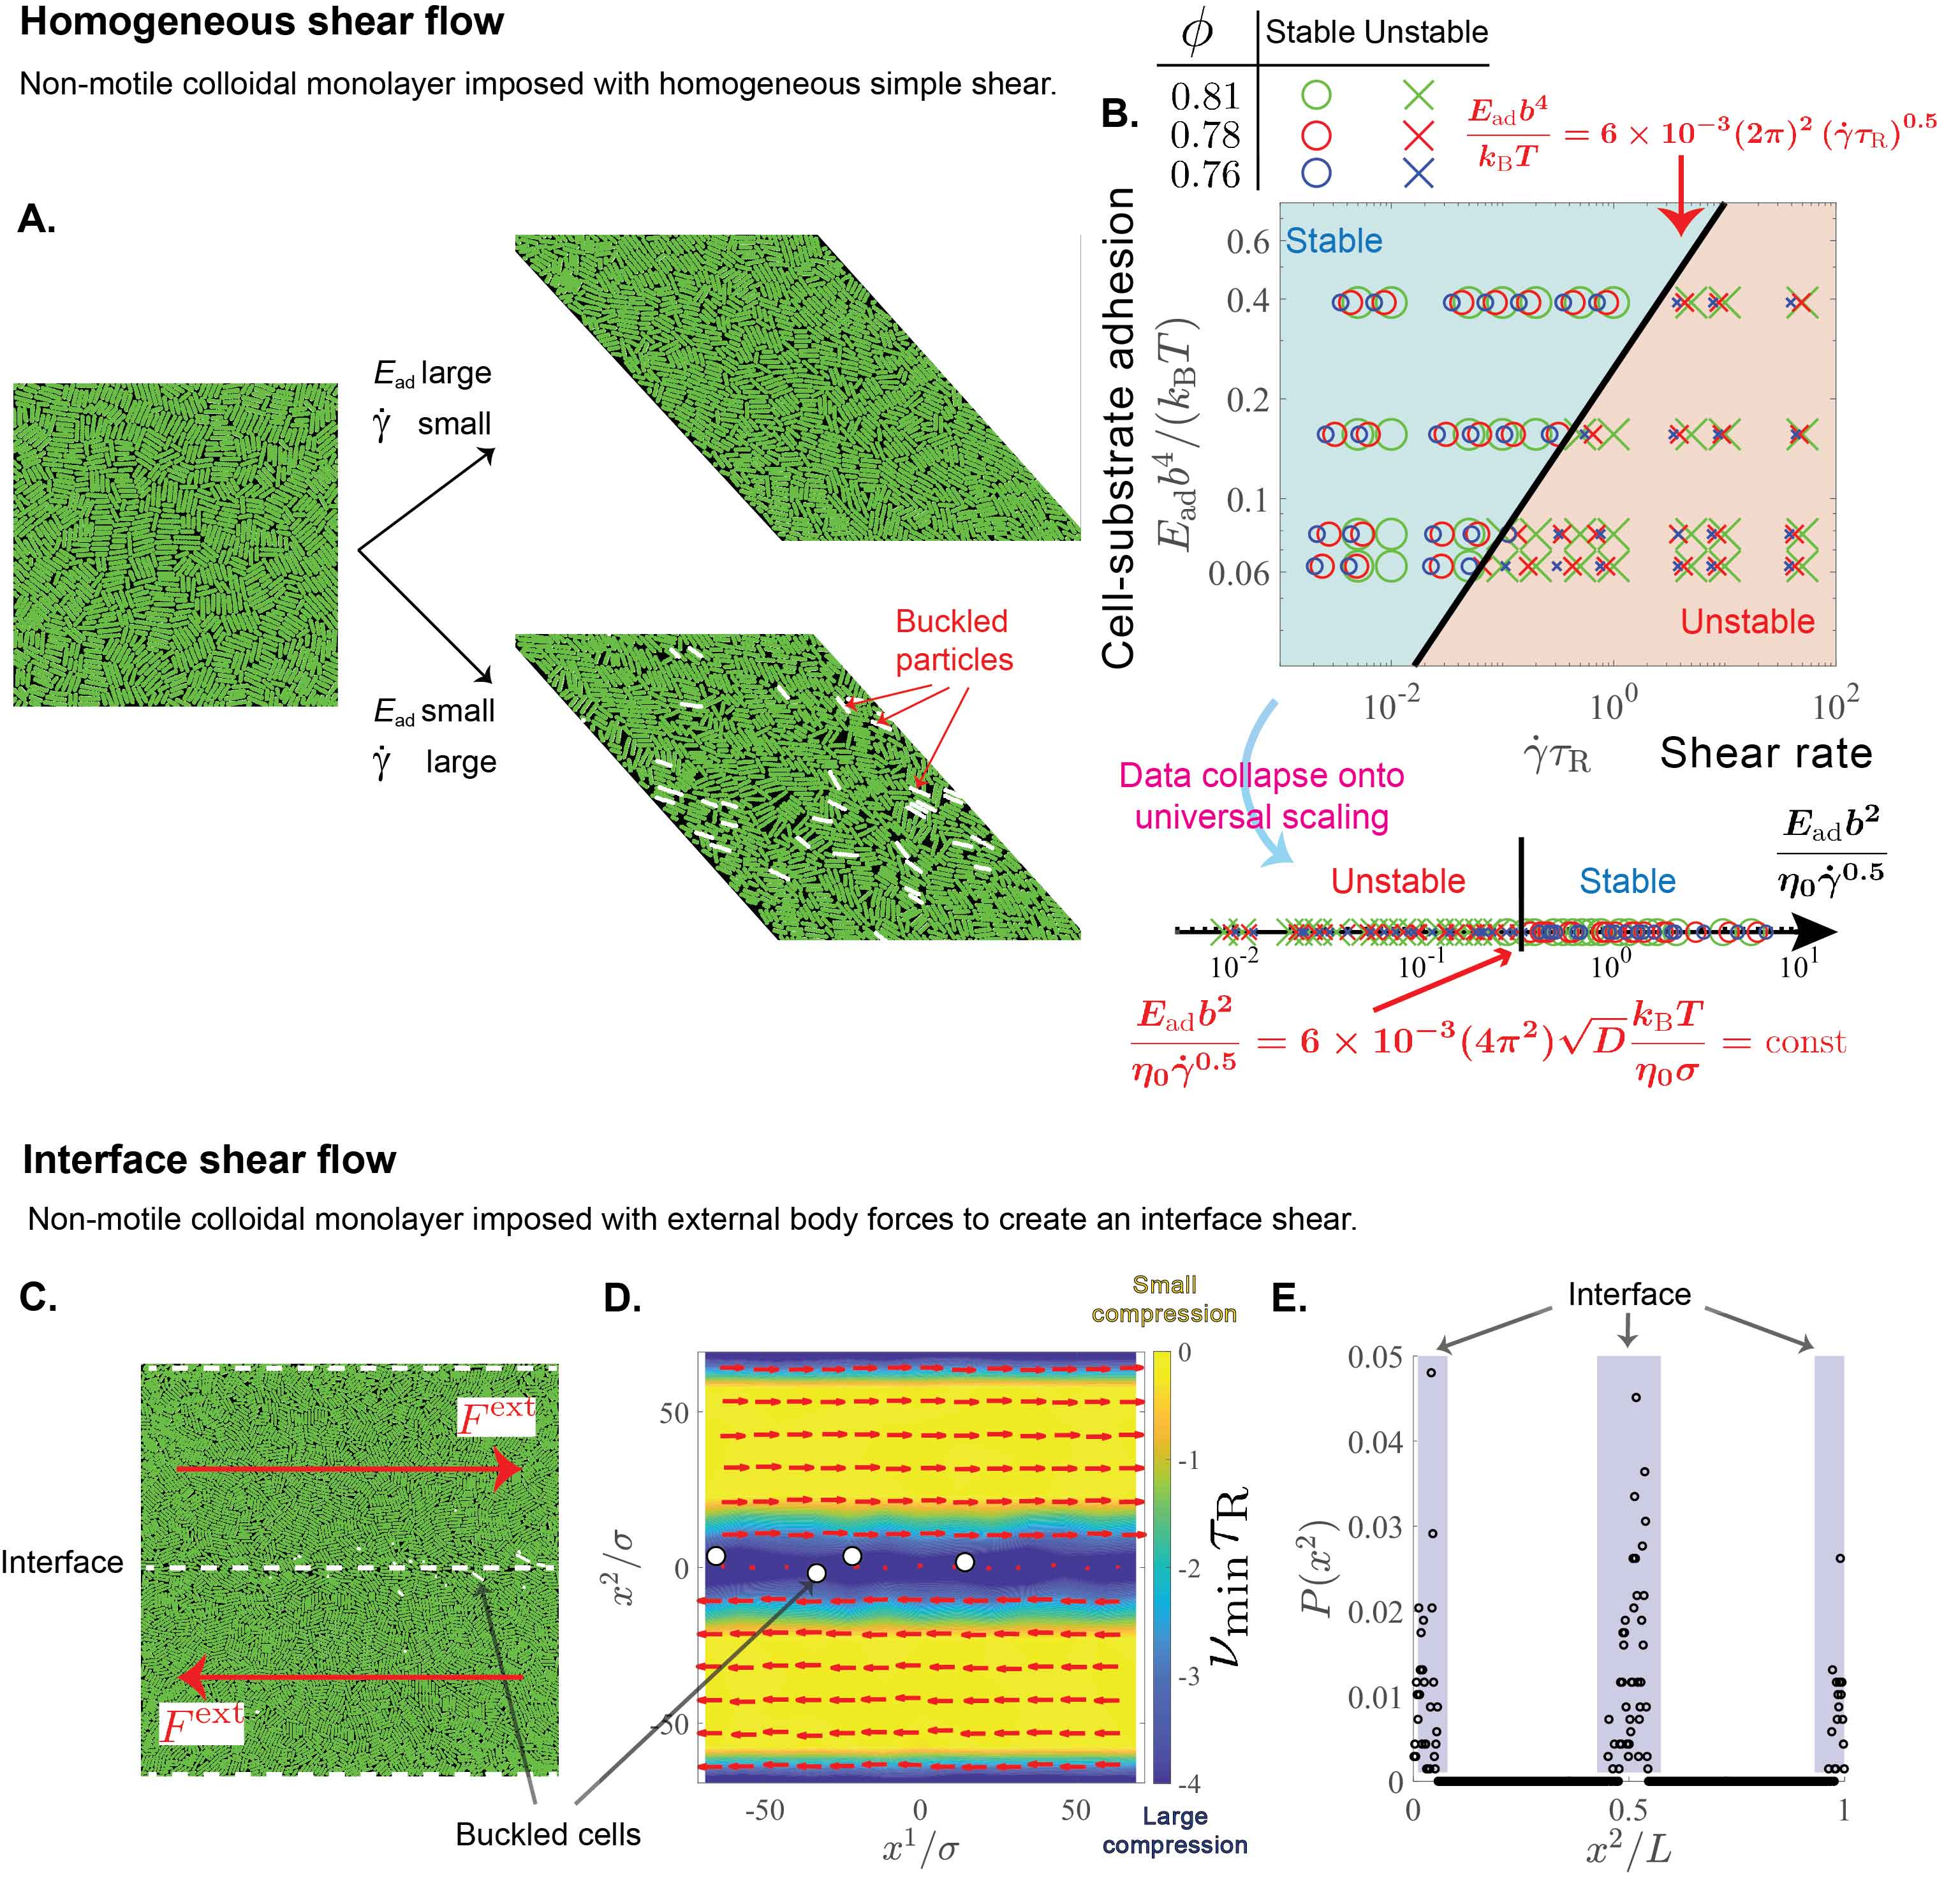
We now test our analytical theory of flow-induced buckling instabilities and out-of-plane growth in molecular simulations consisting of spherocylinders with polydispersity as of that of the realistic bacterial colonies. As mentioned before, the easiest scenario to test the hypothesis corresponds to the case of a non-motile monolayer subjected to in-plane simple shear rates. In this case, one can rigorously test the buckling instability relation derived in (5) comparing the adhesion forces and shear stresses. To this end, we consider a monolayer of polydisperse spherocylinders at varying external shear rates and substrate adhesion; see Fig. 6A, SI movies S10-S11 and SI Chap. III.4 for a detailed analysis. We observe that large shear rates cause out-of-plane transitions, defined as the moment a particle rises 1 particle diameter above the monolayer (shown in white in Fig. 6A). Quantifying the instability across various adhesion and particle densities, the data show a clear relation separating the stable and unstable regions; see Fig. 6B. Remarkably, the data show excellent agreement for critical buckling given by the relation ; see Fig. 6B. Upon conducting further simulations to obtain the stress-strain relationship for the same polydisperse spherocylinder system (see SI Chap. III.4), we find the monolayer to be a power-law, shear-thinning fluid with an effective viscosity , consistent with dense colloidal suspensions (57, 58, 59). This then yields the adhesion-viscosity relation, in (5). Furthermore, Fig. 6B also shows that all the data collapse on to single point when scaled by (5), thus confirming the mechanism of shear flow induced buckling instability. Lastly, we observe that buckling always occurs at the level of individual particles (i.e., largest possible wave vector), consistent with both the analytical theory and experimental observations.
Molecular simulations corresponding to linear shear flows demonstrate the aspect of flow-induced growth of bacterial colonies into the third dimension. We now test the applicability of our proposed buckling mechanisms to an increasingly complex case of non-uniform flows in molecular simulations, corresponding to localized shear flows. To this end, we consider two adjacent flocks that are driven uniformly in opposite directions as shown in Fig. 6C (see SI movie S12). This is reminiscent of two flocks moving in opposite directions in realistic bacterial colonies. In this case, velocity gradients are localized to a boundary layer around the interfaces where the two flocks meet, and there is one negative eigenvalue that indicates compression at the interfaces (see SI Chap. IV.1 for a description of eigenvalue analysis). These negative eigenvalues are shown as a contour plot in Fig. 6D, with corresponding flow fields in red arrows (see SI movie S13). If the aforementioned buckling instabilities arising from the shearing flows is true, one should observe buckling only at the interfaces between two flocks due to compression. This is evident in our simulations in Fig. 6E, where buckling is localized to the interfaces where the two flocks meet, thus providing credence on the generic applicability of our motility-induced instability mechanisms.
Experiments vs. simulations
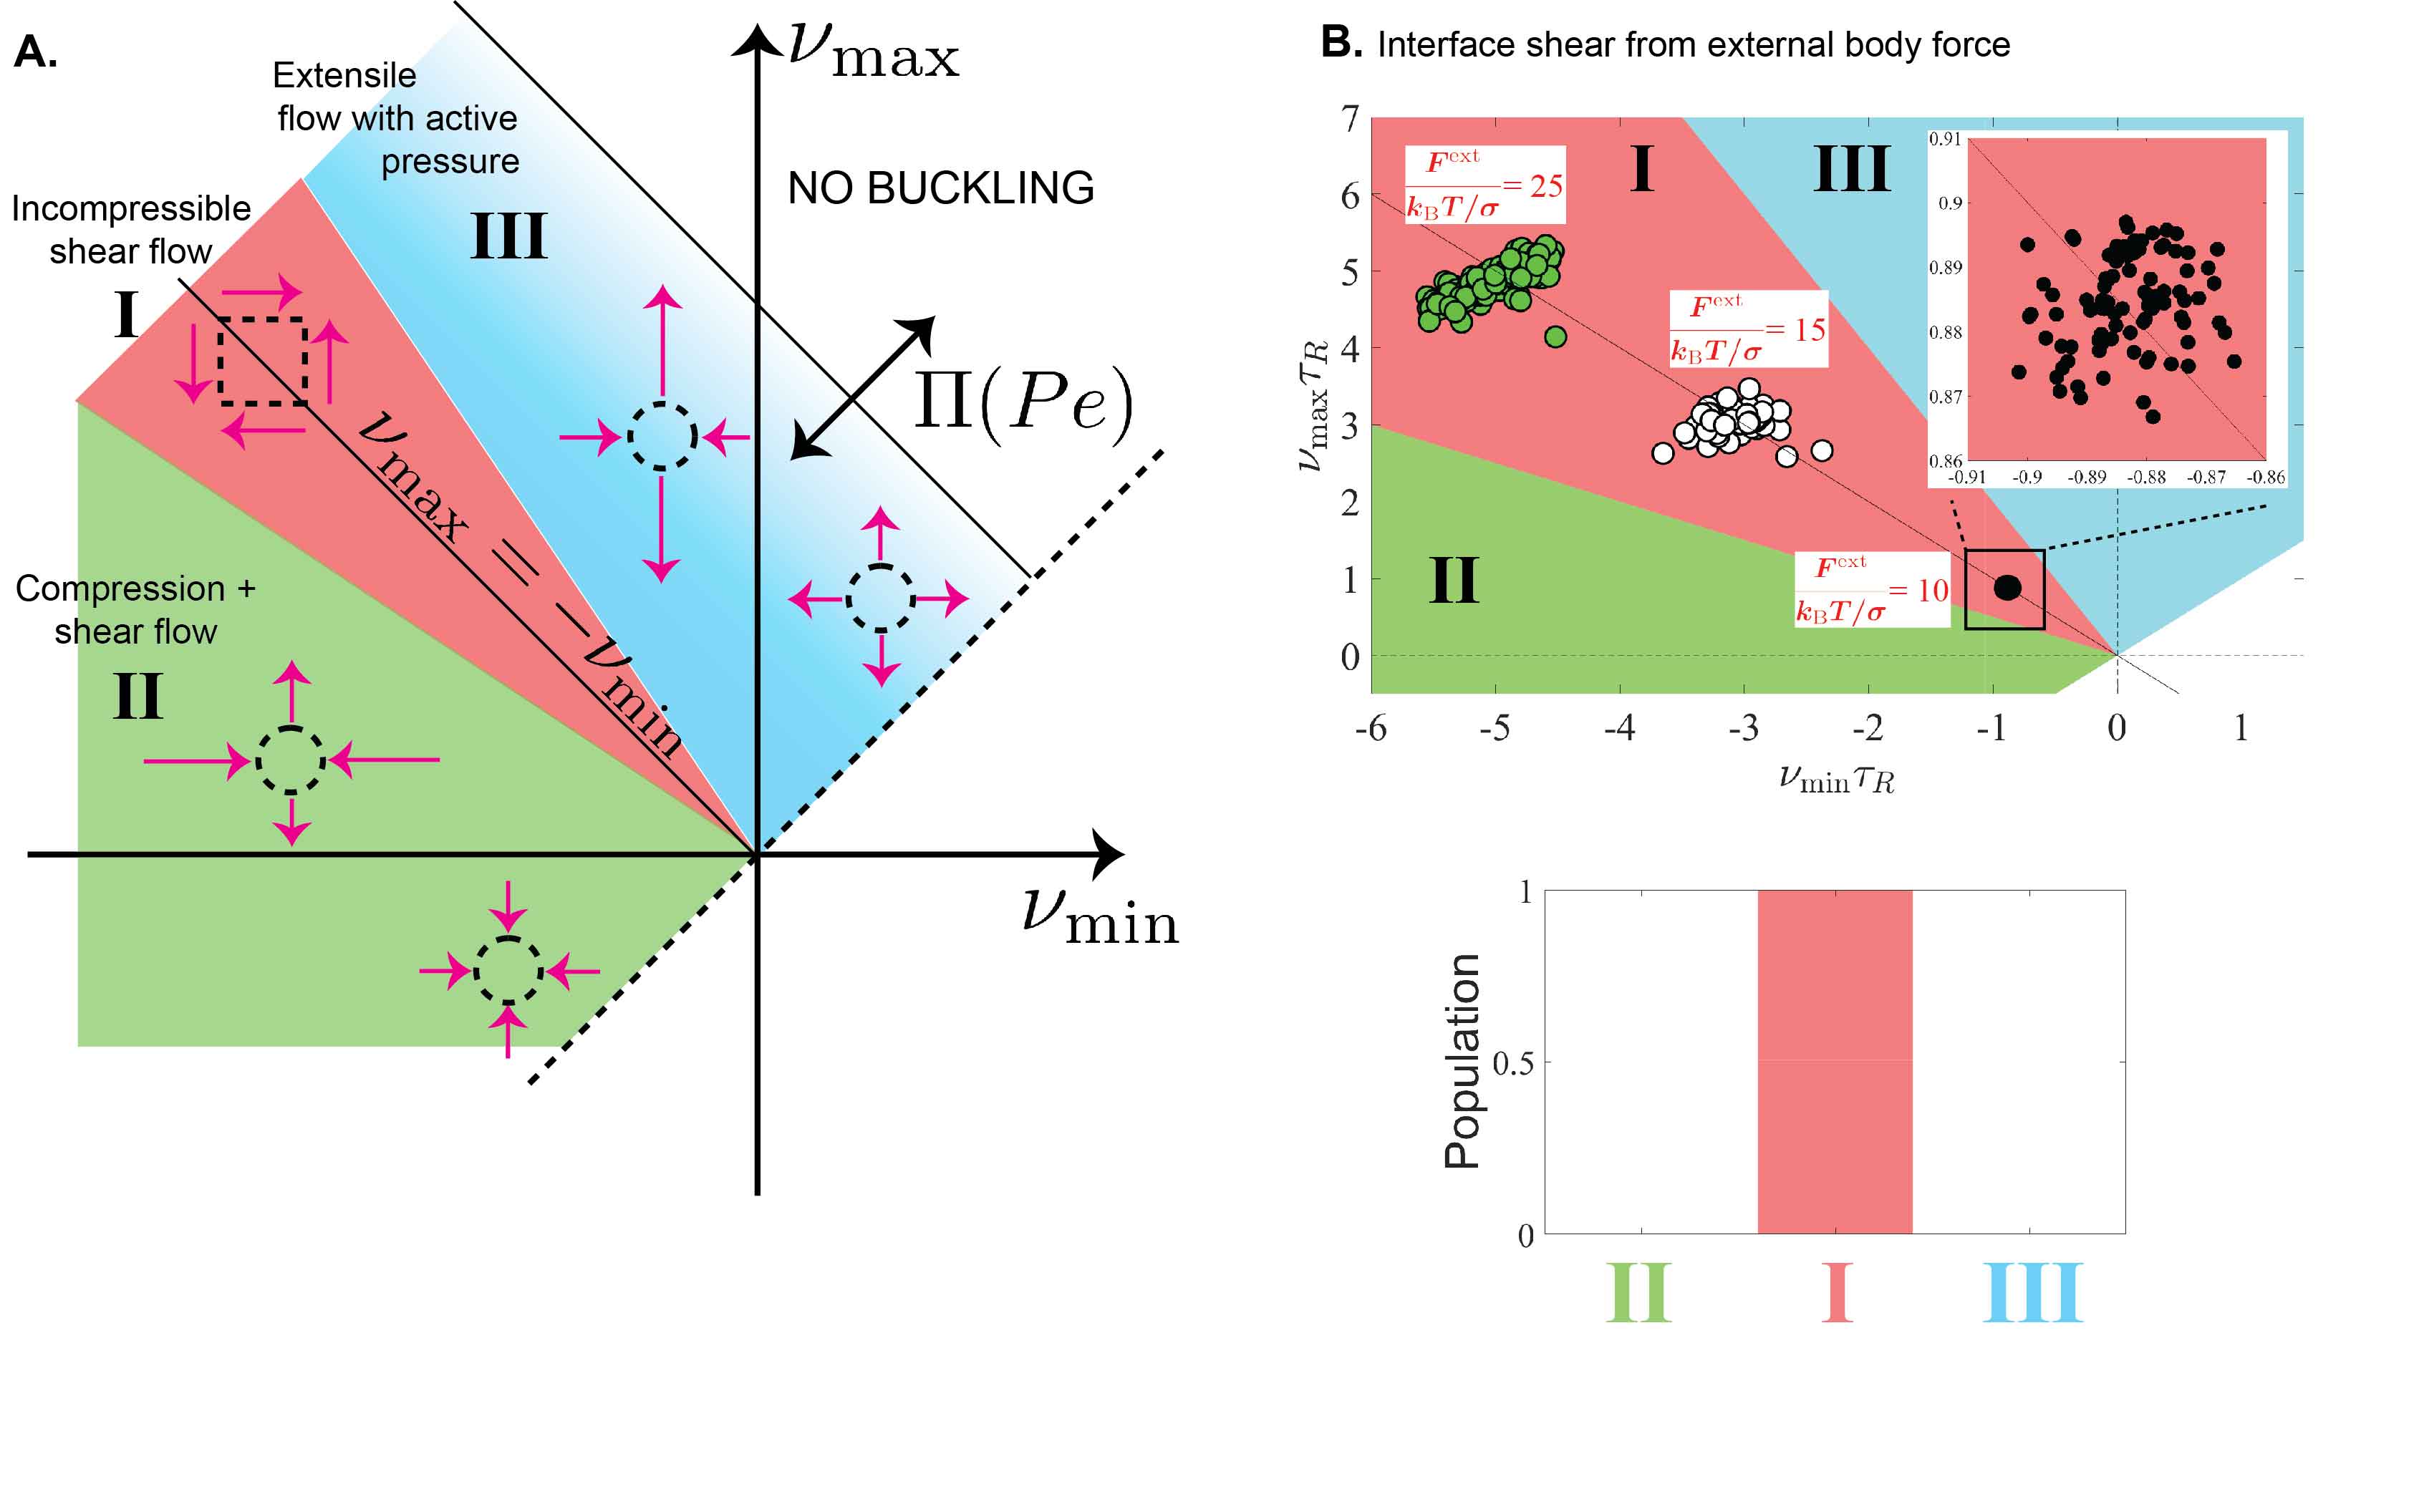
We now study the applicability of our motility induced buckling mechanism in real bacterial swarms, which contain a variety of spatially heterogeneous in-plane flow fields, in addition to homogeneous linear flows and inhomogeneous nonlinear flows. The inherent activity of the bacteria produces natural swarms, and the system will experience a wide range of spatially and temporally-varying shear, tensile, and compressive stresses, which require a new metric to correlate the flow fields to buckling events. To this end, we calculate the rate-of-strain tensor at each fluid element, in both experiments on bacterial colonies and molecular simulations of active polydisperse spherocylinder systems, defined by . The strain-rate tensor contains two eigenvalues and . A negative and positive eigenvalue indicates compression and extension, respectively, in a direction informed by the corresponding eigenvectors. Assuming that buckling is correlated by an appearance of a bacterium onto the second layer, we note the corresponding position and the associated eigenvalues in the bottom monolayer just prior to buckling. These eigenvalues can be represented as in Fig. 7A, with the smaller value on the horizontal axis, and the larger value on the vertical axis.
The eigenvalue diagram in Fig. 7A can be partitioned into three distinct zones, each marking a different motility-induced buckling mechanism: (I) Incompressible shear flow (), in pink; (II) Compression and shear flow (), in green; (III) Extensile flow (), in blue.
We first test the utility of the metric devised in Fig. 7A on describing the buckling mechanisms found in MD simulations of localized shear flows shown in Figs. 6C-E. Since there exists uniform shear stress along the interface between the two flocks, we expect the buckling events to correspond to zone (I), and to lie on the line . As expected, Fig. 7B shows perfect agreement with shear flow mediated buckling for a range of external forcing. Figure. 7B shows the population of buckled particles corresponding to distinct zones again demonstrating that buckling occurs from incompressible shear flow as expected. The case of homogeneous shear flow shows similar results (see SI Fig. 4.2).
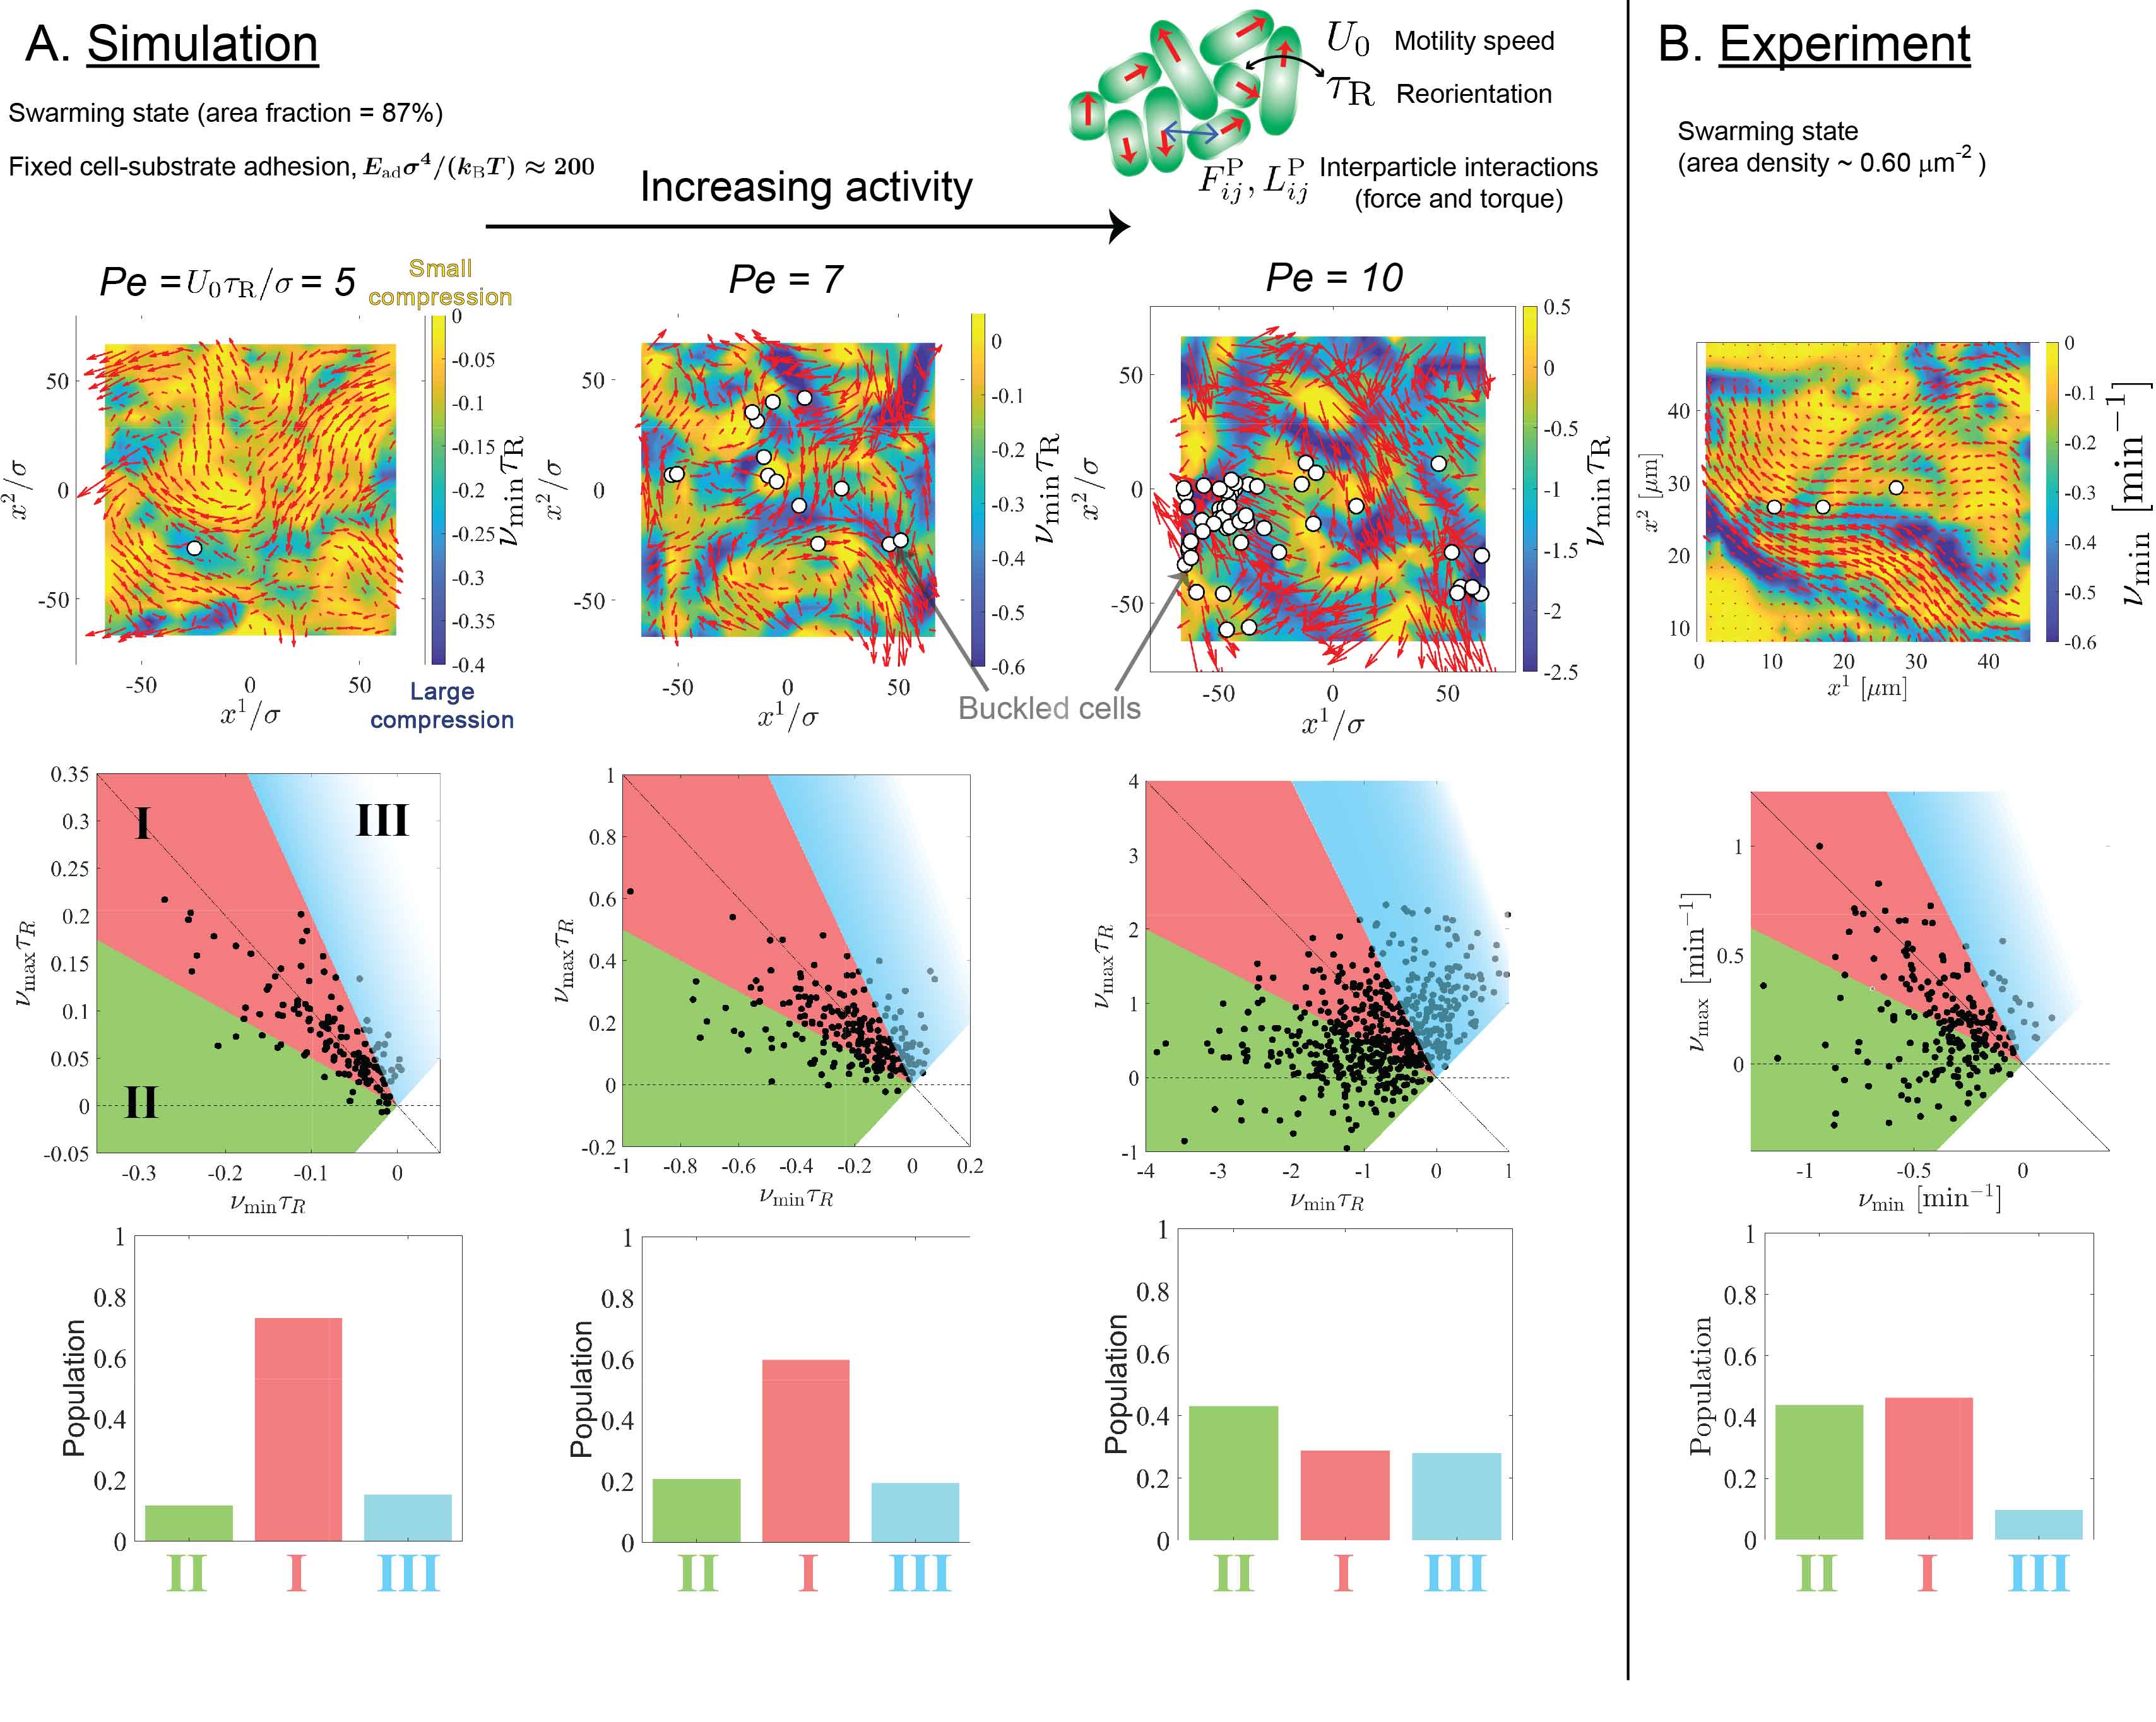
We now apply our metric to experiments and simulations with active swarms to predict motility-induced out-of-plane colony growth. Figures 8A and 8B summarize the results of both MD simulations of active (or motile), polydisperse spherocylinders for various activities and experiments of bacterial colonies, respectively, for densities lesser than the onset density for glassy dynamics. See SI Chap. IV for details on MD simulations of active spherocylinders and experimental quantification. Figure 8 (top row) shows snapshots of molecular simulations and experiments, where the red arrows are the velocity field, , the color contour indicates , and the white circular markers indicate cells that buckled at this time step (see SI movies S14-S16). Note that our MD simulations exhibit swarming flows, consistent with experimental colonies in Fig. 8B (top). Smaller activities ( in Fig. 8A) produce buckling events corresponding to shear flows with rates that are in the vicinity of the unstable region in Fig. 6B. Careful examination of these events reveals that buckling occurs frequently at interfaces between two opposing flows with localized shear stress, similar to interface flows studied in Fig. 6C-E. In this case, we expect incompressible shear flow mediated buckling, corresponding to zone (I), as confirmed in Fig. 8A (middle and bottom), indicating that buckling events are triggered by a competition of the viscous-curvature coupling term () and cell-substrate adhesion () consistent with the instability relation in (5).
As activity increases, swarming patterns evolve more quickly in time and we obtain nonlinear and/or compressible flows, including squeeze and radial compression/extensile flows. This changes the out-of-plane growth from a simple shear flow induced buckling mechanism (zone I) to that of compression, shear and squeeze flow (zone II). Interestingly, we also observe buckling in extensile flow regions (zone III), which may be counter-intuitive based on a sole competition between adhesion versus viscous-curvature coupling . These results indicate the presence of a nonzero in-plane active pressure and a significant role of tension-curvature coupling in (4), as previously analyzed for radial extensile flows leading to (8). In this case, we see that swarming colonies can buckle even in purely extensile regions, if the in-plane pressure is large enough to overcome the stabilizing effects of the extensile flows, as explained in Fig. 5B. Ultimately, it is the competition between (always stabilizing), (always destabilizing), and (either stabilizing or destabilizing depending on flow profile). Indeed, eigenvalue plots and histograms for show transitioning of buckling events from zone (I) to zones (II) and (III). For , the buckling events further spread uniformly across all zones to shear, squeeze, and radial compressible flows, as shown in Fig. 8 (middle and bottom rows). Therefore, if motility is strong compared to cell-substrate adhesion, we predict buckling events via a combination of mechanisms involving both viscous-curvature and tension-curvature coupling arising from shear, squeeze, and radial flows.
Figure 8B shows the analysis of buckling events in motile P. aeruginosa swarms at densities smaller than the onset density for glassy dynamics in Fig. 3C (see SI movies S17-S18). Here, we observe the buckling events spread across all zones (Fig. 8B (middle and bottom)), indicating that swarming P. aeruginosa colonies exhibit all types of flow characteristics, similar to our simulations at intermediate activity . In fact, for the twitching motility speed of , reorientation time of , and characteristic bacteria size of , the activity of the bacteria corresponds to . P. aeruginosa are known to secrete extracellular polymeric substances that facilitate cell-cell adhesion (1, 2, 3, 4, 5); this may partially stabilize monolayers under extensile flows and help explain the lower population in zone (III) compared to the MD simulations, which do not incorporate cell-cell adhesion. Although cell-substrate and cell-cell adhesion cannot be calculated easily in experiments, an activity of gives results consistent with those of our simulations, where buckling is triggered by all mechanisms in (4).
Taken together, Figs. 8A and 8B show that motility-induced buckling mechanisms mediate out-of-plane colony growth. In summary, at densities lower than the onset density, motile bacterial colonies exist in a swarming state and generate motility-induced flows resulting in viscous and compressive stresses. These stresses then induce out-of-plane deformations, subsequently leading to buckling and growth into the third dimension. At cell densities above the onset density, the colony enters into a kinetically-arrested glassy state that suppresses any in-plane flows, and the nature of buckling crosses over from flow-mediated buckling to a quasi-static growth and division-induced Euler-Bernoulli buckling (10, 11, 12, 13, 14, 15, 16). Our dynamical state diagram in Fig. 3C thus provides a fundamental framework to understand and regulate the 3D transition of bacterial colonies.
Discussions
Recent works (17, 60) have focused on topological defects in motile mammalian tissues and their role in “extrusion” or buckling out of a monolayer, by considering the tissue to be an active nematic. For motile bacterial colonies of P. aeruginosa, we observe no indication of out-of-plane transitions occurring preferentially at sites of defects (see SI Chap. III.5 and SI movies S19-S20). Two large differences that contribute to this: (i) bacterial motility speeds () are much larger than that of mammalian cells in (17, 60) (), and (ii) the aspect ratio of bacterial body is small () with significant polydispersity. At these aspect ratios, equilibrium phase diagrams show that monodisperse spherocylinders exist either in isotropic or smectic phases (61, 62, 63). We observe that adding polydispersity in our MD simulations disrupts the smectic phases and results in a micro-crystalline smectic structure. Furthermore, adding activity to MD simulations yields a flowing polycrystal (i.e., small domains of flocks), and not an active nematic; this behavior is also observed in swarming P. aeruginosa colonies. In this case, individual cells and crystals can reorient readily and transient polar flocks are disrupted more easily, thus making defects irrelevant to out-of-plane transitions in this study. We also performed MD simulations of larger aspect ratio particles () and found that in these cases stable defects form, and are consistent with defects present in motile microtubules (64) and other slender biopolymers. At these high aspect ratios, we observe active nematic phases with long range orientational order and associated defects; see SI Chap. III.5 for further discussion of defects, polycrystallinity and role of active nematics. It is of interest to consider motile bacteria with larger aspect ratios, such as Myxobacteria swarms, where the coupling between topological defects arising in active nematics and motility induced in-plane flows may play a significant role in the out-of-plane growth. Such a correlation between the defects and growth has been observed recently in myxobacterial swarms (65).
Our theoretical and experimental analyses predict only the onset of buckling, or a nucleation event. In addition to 3D transitions, we have also observed a rich diversity of swarming behaviors in P. aeruginosa colonies, including patterns at the edges of colonies that resemble fingering instabilities (8, 9). It has been known that extracellular DNA is critical for biofilm formation (66) and its degradation reduces swarming in P. aeruginosa colonies (8). We experimentally observe that the addition of DNA-degrading enzyme DNaseI suppresses swarming and subsequent buckling at leading edges (see SI Chap. IV.3 and SI movie S21-S22). These observations further support our motility-induced buckling mechanism; any perturbation that eliminates swarming prevents rate-dependent buckling. Other biochemical factors that impact the developmental program of bacterial colony growth require reevaluation of the dynamical state diagram (in Fig. 3C), and consequently the motility-induced buckling mechanisms.
Our work demonstrates that motile bacterial colonies can exist in different phases (liquid, glassy, active nematic, etc.), and that their properties in such states are relevant to the dynamical development of a colony. Such a scenario is relevant not only for bacterial colonies but may be broadly applicable to a wide variety of living systems such as yeast (67) and confluent mammalian cells (28, 17, 60).
Methods
P. aeruginosa cell culture and under-agar assay
Standard cell culture techniques were used to handle P. aeruginosa strain PAO1. Briefly, PAO1 expressing GFP from a pSMC2 plasmid was grown in Luria broth (LB) nutrient media with carbenicillin. An overnight culture was diluted into fresh media and grown for 2 hours before centrifuging down to a desired concentration. For the under-agar assay, a small volume () of cell suspension was carefully placed on a cut agar nutrient pad containing LB media, agarose (IBI Scientific Molecular Biology Grade), carbenicillin. For DNase experiments, M SYTOX Orange Nucleic Acid Stain (Invitrogen, S11368) and 250 Kunitz/mL DNaseI from bovine pancreas (Sigma Aldrich, D5025) were additionally added within the agar pad. The drop of cell suspension was left upright to air dry the liquid. A glass-bottom 35 mm dish, No. 1.5 Coverslip, (MatTek corporation) was carefully placed on top of the cut agar pad to create a thin layer of cells between the glass and the agar pad as shown in Fig. 1A. The chamber was sealed with parafilm and incubated in C for 1-2 hours before imaging. Experiments using P. aeruginosa strain PA14 were also conducted and showed similar behavior as PAO1.
Confocal imaging was performed using a Nikon Eclipse Ti microscope (Nikon Instruments) with a Yokogawa CSU-X spinning disk and an Apo TIRF 100x oil-immersion objective (numerical aperture ). Two solid state lasers at wavelengths 488nm and 561nm were used for excitation (ILE-400 multi-mode fiber with BCU, Andor Technologies), and filtered with emission filters (535/40m and 610/75, Chroma Technology). Experiments were also conducted with bright field illumination only, which indicated no change in out-of-plane transition or glassy behavior. Photodamage of cells does not affect our results.
Images were acquired on a Zyla 4.2 sCMOS camera (Andor Technologies), using open-source Micromanager software. Different positions of the colony were scanned, and only those that began with a single monolayer were imaged. Four planes of z-slices were acquired every sec, depending on the system. ImageJ (NIH) and MATLAB (Mathworks, Inc) were used to analyze data from images. Open-source software SuperSegger (68) and PIVLab (69) were used to track cell positions and velocities.
Molecular simulations
To explore a molecular model of motile bacterial colonies, we performed coarse-grained molecular dynamics (MD) simulations using the active Brownian particle model. See SI for a full description of the simulations. Briefly, the overdamped Langevin equations with an active propulsive force was added to each particle as a body force. Hydrodynamic interactions were not included in our model. We varied the area fraction and the activity parameter given by the Péclet number , a non-dimensional number defined as the ratio of the intrinsic run length of the active particle over its diameter .
For spherical active particles used for glass simulations in Fig. 2 and Fig. 3, we developed a custom code using hard disks, where the potential is singular and non-zero only at contact. To avoid interference by crystallization, we used a binary mixture of small and large particles with diameters and , and mole fractions and , respectively. Dynamic structure factor was monitored to ensure that the relaxation time does not change with time.
For spherocylinder simulations, we used a GPU-enabled open source HOOMD-blue molecular dynamics package(70, 71), where the spherocylinder particles use the rigid constraint functionality(72). Spherocylinders were created by a rigid assembly of overlapping spherical particles along their line of centers. All pair interactions were modeled with a Weeks-Chandler-Andersen (WCA) potential (73), in which a Lennard-Jones potential is shifted upwards, truncated at the potential minimum of (such that the potential is purely repulsive), and assigned a well depth of . The spherocylinders have width and mean side length (corresponding to the center-to-center distance of the first and last particles of the spherocylinder). Polydispersity was implemented in our simulations by normally distributing the particle length between seven discrete sizes. Bacterial division is not modeled in this work in regards to the phenomena of motility induced buckling phenomena or glassy phenomena because of the large separation of timescales between motility () and division rate (). In all simulations, time steps were varied from , where is the Stokes-Einstein-Sutherland diffusivity based on the particle width .
We acknowledge Muhammad Hasyim for a critical reading of the manuscript. S.C.T. acknowledges support from the Miller Institute for Basic Research in Science at U.C. Berkeley. K.K.M. acknowledges the support of University of California Berkeley. K.K.M and S.C.T are also supported by Director, Office of Science, Office of Basic Energy Sciences, of the U.S. Department of Energy under contract No. DEAC02-05CH11231. We thank the Fleiszig Lab for generous donation of P. aeruginosa strain PAO1.
References
- (1) Lyczak JB, Cannon CL, Pier GB (2000) Establishment of pseudomonas aeruginosa infection: lessons from a versatile opportunist. Microbes and infection 2(9):1051–1060.
- (2) Gellatly SL, Hancock REW (2013) Pseudomonas aeruginosa : new insights into pathogenesis and host defenses. Pathogens and disease 67(3):159–173.
- (3) Faure E, Kwong K, Nguyen D (2018) Pseudomonas aeruginosa in chronic lung infections: How to adapt within the host? Frontiers in immunology 9(2416).
- (4) López-Causapé C, Rojo-Molinero E, Maciá MD, Oliver A (2015) The problems of antibiotic resistance in cystic fibrosis and solutions. Expert review of respiratory medicine 9(1):73–88.
- (5) Bjarnsholt T (2013) The role of bacterial biofilms in chronic infections. APMIS 121(s136):1–58.
- (6) Kearns DB (2010) A field guide to bacterial swarming motility. Nature reviews microbiology 8:634.
- (7) Rashid MH, Kornberg A (2000) Inorganic polyphosphate is needed for swimming, swarming, and twitching motilities of Pseudomonas aeruginosa. Proceedings of the national academy of sciences 97(9):4885–4890.
- (8) Gloag ES, et al. (2013) Self-organization of bacterial biofilms is facilitated by extracellular dna. Proceedings of the national academy of sciences 110(28):11541.
- (9) Verstraeten N, et al. (2008) Living on a surface: swarming and biofilm formation. Trends in microbiology 16(10):496–506.
- (10) Yan J, et al. (2019) Mechanical instability and interfacial energy drive biofilm morphogenesis. eLife 8:e43920.
- (11) Beroz F, et al. (2018) Verticalization of bacterial biofilms. Nature physics 14(9):954.
- (12) You Z, Pearce DJ, Sengupta A, Giomi L (2018) Mono-to-multilayer transition in growing bacterial colonies. arXiv:1811.08875.
- (13) Dell’Arciprete D, et al. (2018) A growing bacterial colony in two dimensions as an active nematic. Nature communications 9(1):4190.
- (14) Grant MAA, Wacław B, Allen RJ, Cicuta P (2014) The role of mechanical forces in the planar-to-bulk transition in growing escherichia coli microcolonies. Journal of the royal society interface 11(97):20140400.
- (15) Boyer D, et al. (2011) Buckling instability in ordered bacterial colonies. Physical biology 8(2):026008.
- (16) Farrell FDC, Hallatschek O, Marenduzzo D, Waclaw B (2013) Mechanically driven growth of quasi-two-dimensional microbial colonies. Physical review letters 111(16):168101.
- (17) Saw TB, et al. (2017) Topological defects in epithelia govern cell death and extrusion. Nature 544(7649):212.
- (18) Shraiman BI (2005) Mechanical feedback as a possible regulator of tissue growth. Proceedings of the national academy of sciences 102(9):3318.
- (19) Chandler D, Garrahan JP (2010) Dynamics on the way to forming glass: Bubbles in space-time. Annual review of physical chemistry 61(1):191–217.
- (20) Keys AS, Hedges LO, Garrahan JP, Glotzer SC, Chandler D (2011) Excitations are localized and relaxation is hierarchical in glass-forming liquids. Physical review X 1(2):021013.
- (21) Hunter GL, Weeks ER (2012) The physics of the colloidal glass transition. Reports on progress in physics 75(6):066501.
- (22) Weeks ER, Crocker JC, Levitt AC, Schofield A, Weitz DA (2000) Three-dimensional direct imaging of structural relaxation near the colloidal glass transition. Science 287(5453):627–631.
- (23) Song C, Wang P, Makse HA (2008) A phase diagram for jammed matter. Nature 453:629.
- (24) Berthier L, Biroli G, Bouchaud JP, Cipelletti L, van Saarloos W (2011) Dynamical heterogeneities in glasses, colloids, and granular media. (OUP Oxford) Vol. 150.
- (25) Berthier L (2011) Trend: Dynamic heterogeneity in amorphous materials. Physics 4:42.
- (26) Kob W, Donati C, Plimpton SJ, Poole PH, Glotzer SC (1997) Dynamical heterogeneities in a supercooled lennard-jones liquid. Physical review letters 79(15):2827.
- (27) Dauchot O, Marty G, Biroli G (2005) Dynamical heterogeneity close to the jamming transition in a sheared granular material. Physical review letters 95(26):265701.
- (28) Angelini TE, et al. (2011) Glass-like dynamics of collective cell migration. Proceedings of the national academy of sciences 108(12):4714.
- (29) Garrahan JP (2011) Dynamic heterogeneity comes to life. Proceedings of the national academy of sciences 108(12):4701.
- (30) Puliafito A, et al. (2012) Collective and single cell behavior in epithelial contact inhibition. Proceedings of the national academy of sciences 109(3):739.
- (31) Angell CA (1995) Formation of glasses from liquids and biopolymers. Science 267(5206):1924–1935.
- (32) Elmatad YS, Chandler D, Garrahan JP (2009) Corresponding states of structural glass formers. The journal of physical chemistry B 113(56):5563–5567.
- (33) Ediger MD, Angell CA, Nagel SR (1996) Supercooled liquids and glasses. The journal of physical chemistry 100(31):13200–13212.
- (34) Debenedetti PG, Stillinger FH (2001) Supercooled liquids and the glass transition. Nature 410(6825):259.
- (35) Garrahan JP, Chandler D (2003) Coarse-grained microscopic model of glass formers. Proceedings of the national academy of sciences 100(17):9710–9714.
- (36) Isobe M, Keys AS, Chandler D, Garrahan JP (2016) Applicability of dynamic facilitation theory to binary hard disk systems. Physical review letters 117(14):145701.
- (37) Berthier L, Biroli G (2011) Theoretical perspective on the glass transition and amorphous materials. Reviews of modern physics 83(2):587.
- (38) Katira S, Garrahan JP, Mandadapu KK (2019) Theory for glassy behavior of supercooled liquid mixtures. Physical review letters 123(10):100602.
- (39) Tailleur J, Cates ME (2008) Statistical mechanics of interacting run-and-tumble bacteria. Physical review letters 100(21):218103.
- (40) Marchetti MC, et al. (2013) Hydrodynamics of soft active matter. Reviews of modern physics 85(3):1143–1189.
- (41) Cates ME, Tailleur J (2013) When are active Brownian particles and run-and-tumble particles equivalent? consequences for motility-induced phase separation. Europhys letters 101(2):20010.
- (42) Ramaswamy S (2010) The mechanics and statistics of active matter. Annual review of condense matter physics 1(1):323–345.
- (43) Lauga E, Powers TR (2009) The hydrodynamics of swimming microorganisms. Reports on progress in physics 72(9):096601.
- (44) Kob W (1999) Computer simulations of supercooled liquids and glasses. Journal of physics: Condense matter 11(10):R85.
- (45) Horbach J, Kob W, Binder K (1998) Molecular dynamics simulation of the dynamics of supercooled silica. Philosophical magazine B 77(2):297–303.
- (46) Vicsek T, Czirók A, Ben-Jacob E, Cohen I, Shochet O (1995) Novel type of phase transition in a system of self-driven particles. Physical review letters 75(6):1226.
- (47) Grégoire G, Chaté H (2004) Onset of collective and cohesive motion. Physical review letters 92(2):025702.
- (48) Mahault B, et al. (2018) Self-propelled particles with velocity reversals and ferromagnetic alignment: Active matter class with second-order transition to quasi-long-range polar order. Physical review letters 120(25):258002.
- (49) Epstein JM, Klymko K, Mandadapu KK (2019) Statistical mechanics of transport processes in active fluids. ii. equations of hydrodynamics for active brownian particles. The journal of chemical physics 150(16):164111.
- (50) Bird RB, Stewart WE, Lightfoot EN (2007) Transport phenomena. (John Wiley & Sons).
- (51) Leal LG (2007) Advanced transport phenomena: fluid mechanics and convective transport processes. (Cambridge University Press) Vol. 7.
- (52) Seifert U (1993) Curvature-induced lateral phase segregation in two-component vesicles. Physical review letters 70(9):1335.
- (53) Evans EA, Skalak R (1980) Mechanics and Thermodynamics of Biomembranes. (CRC Press, Boca Raton, Fl.).
- (54) Arroyo M, DeSimone A (2009) Relaxation dynamics of fluid membranes. Physical review E 79(3):031915.
- (55) Sahu A, Sauer RA, Mandadapu KK (2017) Irreversible thermodynamics of curved lipid membranes. Physical review E 96(4):042409.
- (56) Rangamani P, Agrawal A, Mandadapu KK, Oster G, Steigmann DJ (2012) Interaction between surface shape and intra-surface viscous flow on lipid membranes. Biomechanics and modeling in mechanobiology 12(4):833–845.
- (57) Isa L, Besseling R, Poon WCK (2007) Shear zones and wall slip in the capillary flow of concentrated colloidal suspensions. Physical review letters 98(19):198305.
- (58) Petekidis G, Vlassopoulos D, Pusey PN (2004) Yielding and flow of sheared colloidal glasses. Journal of physics: Condensed matter 16(38):S3955–S3963.
- (59) Lin J, Wyart M (2018) Microscopic processes controlling the herschel-bulkley exponent. Physical review E 97(1):012603.
- (60) Kawaguchi K, Kageyama R, Sano M (2017) Topological defects control collective dynamics in neural progenitor cell cultures. Nature 545(7654):327.
- (61) Bolhuis P, Frenkel D (1997) Tracing the phase boundaries of hard spherocylinders. The journal of chemical physics 106(2):666–687.
- (62) Bates MA, Frenkel D (2000) Phase behavior of two-dimensional hard rod fluids. The journal of chemical physics 112(22):10034–10041.
- (63) Bautista-Carbajal G, Odriozola G (2014) Phase diagram of two-dimensional hard ellipses. The journal of chemical physics 140(20):204502.
- (64) DeCamp SJ, Redner GS, Baskaran A, Hagan MF, Dogic Z (2015) Orientational order of motile defects in active nematics. Nature materials 14(11):1110.
- (65) Copenhagen K, Alert R, Wingreen NS, Shaevitz JW (2020) Topological defects induce layer formation in myxococcus xanthus colonies. arXiv:2001.03804.
- (66) Whitchurch CB, Tolker-Nielsen T, Ragas PC, Mattick JS (2002) Extracellular dna required for bacterial biofilm formation. Science 295(5559):1487–1487.
- (67) Atis S, Weinstein BT, Murray AW, Nelson DR (2019) Microbial range expansions on liquid substrates. Physical review X 9(2):021058.
- (68) Stylianidou S, Brennan C, Nissen SB, Kuwada NJ, Wiggins PA (2016) Supersegger: robust image segmentation, analysis and lineage tracking of bacterial cells. Molecular microbiology 102(4):690–700.
- (69) Thielicke W, Stamhuis E (2014) Pivlab–towards user-friendly, affordable and accurate digital particle image velocimetry in matlab. Journal of open research software 2(1).
- (70) Anderson JA, Lorenz CD, Travesset A (2008) General purpose molecular dynamics simulations fully implemented on graphics processing units. Journal of computational physics 227(10):5342–5359.
- (71) Glaser J, et al. (2015) Strong scaling of general-purpose molecular dynamics simulations on gpus. Computer physics communications 192:97–107.
- (72) Nguyen TD, Phillips CL, Anderson JA, Glotzer SC (2011) Rigid body constraints realized in massively-parallel molecular dynamics on graphics processing units. Computer physics communications 182(11):2307–2313.
- (73) Weeks JD, Chandler D, Andersen HC (1971) Role of repulsive forces in determining the equilibrium structure of simple liquids. The journal of chemical physics 54(12):5237–5247.